
In
this week’s educational article, we want to share with you our introductory
system to NeverLossTrading: TradeColors.com identifies institutional triggered trading opportunities by
a two-candle-color-sequence.
Trade
potentials arise when the high of the second or next blue candle is surpassed
by the following candle or when the low of the second of following red candle
is surpassed by the next candle.
You
basically put a buy or sell stop at those levels and then you trade along with
the set price direction.
Crude Oil Futures on November 26, 2013 (Time: November 25, 18:00 to
November 26: 24:00)

TradeColors.com is an introductory concept to “Algorithmic
Trading with Human Interaction”, featured by NeverLossTrading® and
provides you with a high probability trading system.
However, successful trading is a combination of
finding high probability trade entries in combination with formulating immediate
targets for the trade, recognizing where the market forces let us expect supply
and demand or support and resistance.
In respect of target setting: TradeColors.com offers two different trading
types:
Type
1: Momentum
trading – After the second same color candle initiates a trade setup, you trade
for the expected price move. But how do you define this target? In our aim to
support you in your trading, we added in the upper left hand corner of the
chart, a field with states: Price Move Approximation and a number behind it.
This field helps you to define the exit or target-1 for your trades.
The Crude Oil Futures Chart shows a current expected
price move of $0.16, when the high/low of the trade initiation candle is ticked
out, which relates to a potential trade gain of $160 per contract on a 10
minute chart. The expected time in the trade until this target is reached is 1-5
bars: In our example this would mean 10 – 50 minutes.
Type
2: Trend
trading – You trail the stop below the prior candle until you get stopped.
However, for a trend move, we also formulate our positive exit with the use of
the blue lines on the chart. They function as key support and resistance lines
and you learn in your mentorship class, how to put those blue-lines on the
chart and how to use them for setting your trend trading goals.
Take a look at the orange highlighted areas and you
will see how often prices accumulated at the blue-lines. In our mentorship, you
will learn to formulate those price levels prior to entering into a trading
sequence.
Crude Oil Futures with Key Support and Resistance
Levels (Highlighted)

Imagine, how trading will be for you by finding
entries in a candle-color sequence and formulating targets either with the help
of the blue line or by the price-move-approximation.
You recognize: “There is no overhead resistance line
on the chart”. How to trade in such a situation? When you do not have an
orientation line to trade to and from, then you either momentum trade,
formulating an approximated target-1 and target-2 or you trend trade by following
the candle color sequence until either your trailing stop gets triggered or the
low of the first red candle is surpassed.
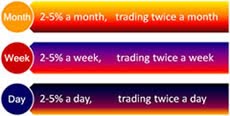
User focused, two different systems
are available:

The TradeColors.com education packages
offer you a budget, however, powerful vehicle to operate in the world’s
financial markets.
The chart below shows SPY (ETF for
the S&P 500 Index) and its development for the last six months. Trade-setup
situations are highlighted in orange and follow the two candle color sequence
model:
SPY (June-November 2013)

Again, you see how the directional
price moves setup in a two-candle-color-sequence, which was followed through.
In addition, the chart shows how the used price gravitation lines defined key
supply and demand levels were the price of SPY accumulated or made a major move
after a breakthrough.
With the help of our scanner, we
help our subscribers on a daily basis to find Stocks, Futures and FOREX pairs,
where this setup constellation was found.
AAPL Two-Candle-Color-Sequence and
Follow-Through

The AAPL chart shows that the stock
is concluding an up-move, where the price comes close to facing overhead
resistance at $550.
If you sign up now for
TradeColors.com, every dollar you pay will be accounted on an upgrade to a
NeverLossTrading mentorship, in addition, you receive a $500 year-end-discount.
Click
this link…. or call 866 455 4520
or contact@NeverLossTrading.com

TradeColors.com
is applicable for all asset classes and for their derivatives, Options and
Futures:
- Stocks, ETF’s, Mutual Funds
- Commodities
- Currencies
- Treasuries
With TradeColors.com, aside
from providing you with a trading concept, we share our market scans at least
three times per week, reporting stocks, futures and FOREX pairs with a two-same-color-candle-sequence,
sharing with you were market pressure and trading opportunities arise.
Considering stocks widely held and
traded with institutions, we scan:
- 180 Stocks from the S&P 100 and NASDAQ 100.
- 78 FOREX pairs, covering the world currencies.
- 50 Focus Futures, ranging from stock market indexes, via currencies to commodities and treasuries.
With your subscription to TradeColors.com, you will receive this report free,
for 30-days, with the right to renew of your subscription for a monthly fee of
$99 after. Subscriptions can be cancelled at any time with PayPal a leading
provider of payment option; they even give you the opportunity of financing the
tuition for 6-months without payment.
You save hours of time to find and
document trading opportunities. Imagine checking 180 charts every night,
documenting and selecting those you want to trade. We do the work for you and
for a price for less than $5 per trading day, we provide you with constant
reports, spelling out:
- Blue or Red Candle Sequences with market pressure.
- Potential Momentum Reversals with market pressure.
The average stocks, we repot, has an
expected 1-Expansion-Move of 1.7%, based on the cash price of the asset. When
you use overnight margin, this relates to a 3.4% return and on an
intra-day-basis to a 6.8% return potential.
Futures and FOREX trading, by the
used leverage allows for much higher returns.
Always remember: Past performance is
not indicative for future results.
Why would one want to upgrade to a
NeverLossTrading Mentorship?
NeverLossTrading systems have two
major advantages compared to TradeColors.com:
- Higher Probability Trade Setups
- More Trading Opportunities Per Time-Unit-Observed
Hence, if you are serious about
trading, NeverLossTrading systems provide the higher productivity.

TradeColors.com
it gives you:
- An easy to follow, high probability trading system.
- The possibility for a short-term payback on your tuition.
- The ability to upgrade to NeverLossTrading Mentorships at full reimbursement of your costs.
- Clear cut documentation.
- Focused training.
- One month support with all your questions answered.
If you are ready for this you can
purchase your education package online…click
here or
Call +1 866 455 4520 or contact@NeverLossTrading.com
No comments:
Post a Comment