Spot and Trade Institutional Money Moves

Algorithmic Trading with Human Interaction for:

Day Traders, Swing Traders, Long-Term Investors

Saturday, August 23, 2014

How to Trade with the Odds in Your Favor


Many private traders like the exciting environment of trading the financial markets. Trading can be a wonderful hobby. For hobbies, we like to spend money and this is usually what happens; however, if you want to take trading and investing serious, you need to start being a probability thinker: Understanding how probable it is for you in a string of investments to make money following clearly defined trading or investing guidelines.
What are your odds of making money?
Before we help you to answer this question, let us reiterate some prerequisites of trading success:
  • Have a system.
  • Be disciplines and follow the system.
  • Trade only, when the odds are in your favor
Example: NeverLossTrading Top Line Chart for FAS

At this NeverLossTrading example, you only trade when the price development of the candle following the trade initiation candle (situations marked with numbers) surpasses the spelled out price threshold: Buy>$101.10 for example. Summary: The price of the next candle has to move higher to validate the entry proposal. The trade target is pre-calculated and either marked with a dot on the chart or by a horizontal NLT Price Gravitation Line. The red line on the chart: NLT Double Decker Line allows for trailing your stop.
To calculate or evaluate the odds of the trade situation, we run a quick appraisal for the three trade situations, which all have a high probability trade setup at the chart constellation:
Situation-1: Risky, by having a substantially higher risk than reward: Stop at the high of the candle.
Situaiton-2: Favorable setup. Stop at the low of the candle, with a higher reward than risk.
Situaiton-3: Favorable setup. Stop at the low of the candle, with a higher reward than risk.
However, if your trading system does not portrait entries, exits, and stops, what do you do?
A simple way of calculating the odds of a trade setup is:
Probability of the Trade Setup (past performance) x Reward / (Risk x Probability of Failing)
At this point, note the Golden Rule of Trading Success:
The factor of this calculation shall be above 1.5-points.
Example-1: Probability for success of the trade setup (from history): 65%, with a risk of $1 and a reward of $1. The calculated factor comes to 1.94; thus, it is above 1.5 and tells you that you found a trade setup where the odds in your favor according to our Golden Rule. 
Example-2: Probability for the trade setup: 58%, with a risk of $1 and a reward of $1. The calculated factor comes to 1.38 and is below 1.5 telling you that the odds of the trade setup evaluated are NOT in your favor.
When it is that easy, why do most private investors fail to achieve their financial goals?
Our answer: Most private investors or traders use trading systems, which are either random or produce a probability for success between 53% - 57% where the factor < 1.5.  Examples are:
  • Moving average based indicators: MACD, Bollinger Bands, RSI, CCI...
  • Candle setups: Doji, Harami, Hangman…
  • Long-term patterns: Head and Shoulder, Cup and Handle…
We tested and programmed all of those setups and many others. For traders who sign up for our program, we always offer to parallel-program the trade situation, you based your decision on and then we compare.
In addition, most standard indicators are lagging and propose entries when the major price move is close to over; providing you a trade-setup where the risk is mostly higher than the reward; bringing you into a circle-of-doom-pattern:  Small gain, small gain, big loss.
This is where NeverLossTrading systems make a difference.
1.    You trade at major swing points of institutional supply and demand shifts.

E-Mini S&P 500 Daily Chart with NLT Top-Line Indicators


2.    By the support of calculation tables, you get your trade situation appraised, calculating the likelihood for success, potential risk and reward, with a proposal for the position sizing.
NeverLossTrading Evaluation Model


3.    Critical for the private investor is to know about trading opportunities. Choosing from 40,000 US-traded stocks is not easy. With NeverLossTrading, you can always stay engaged in the market, by either scanning the for favorable trade setups, using NLT Top-Line integrated market scanners or by subscribing to the NLT Alerts (free for three months with a mentorship).
Scan for Your Trading Opportunities or Subscribe to our NLT Alert Service

In the NeverLossTrading Mentorship, you further experience:
  • Individual training units, fit to your personal wants and needs (all recorded)
  • 200-page documentation for easy access to key information.
  • Six month of mentorship with trade feedback and further education.
  • All software installed for you. The license fee paid off with the initial tuition.
  • Real time data on a server based programming, available from every computer.
  • Data feed from a free platform with no need to change your broker relationships.
  • ...
All for helping you to develop yourself into the trader, you want to be!
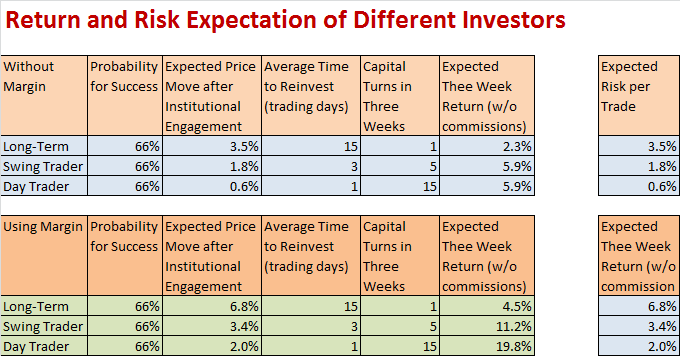
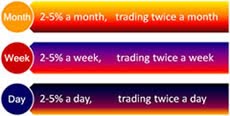
Several NeverLossTrading Mentorships are offered, which support Day Traders, Swing Traders, and Long-Term Investors.
Take the chance and test us live. Schedule a free consulting hour, where we get together online with you, share our screens and answer your questions:
Call: +1 866 455 4520
In case you are not yet subscribed to our free trading tips and market reports, sign up here:
Please always consider the risk of trading and that past performance cannot be taken indicative for future results.
Good trading,
Thomas

Saturday, August 16, 2014

Trading is a Professional Business and Professionals Make Money with What They Do


How to make money in the financial markets? 

Historically, the stock market was in focus of the private trader. Lately the FOREX market is gaining more and more interest and attracts first time traders by its nature of pure leverage: $2,000 controlling $100,000. 

Another market with long-term focus: Metals. For a good while, I met people who shared their opinion about Gold and Silver: “It will always go up”; however, since Gold dropped from $1,700 per oz. to $1,300, those voices got quiet. An even more drastic development in Silver: Dropping form $40 per oz. to $20. You sure remember the hype in Silver: All cellphones and the new tablets; they all need Silver coated connectors. In the new industrial future, a desperate need for this metal was a given. Silver was stated as the most undervalued material of the century and had to sky rocket to more highs after it reached $40 per oz.

As we know now, many if not all of those predictions did not hold true. What can you do? 

Our answer: Understand supply and demand patterns and how financial markets work, where assigned market makers provide liquidity and thus an offering at multiple price levels on the bid and ask side of an asset. Some still believe that the market makers live from the penny bid/ask-spread, but when you see the amount of people that receive a paycheck from those companies and the building they reside in, you recognize, there must be something else that fuels their cash account.
How do all those fund managers make money? By the 1% maintenance fee they charge? Surely not, but how does that work, because they hold assets in the value of gazillion dollars from 401(k) and mutual fund investors. 

Do yourself a favor and check the income statements of the big prop traders of our today’s world: Goldman Sachs, JP Morgan, Deutsche Bank, UBS, Barclay’s and many more… Even so they 
perfectly hide their source of income through international corporate balance sheet consolidations, the picture gets clear: A lion share of their income results from trading and not from the basic banking business. 

If you bring it all together: 

·         There are many institutional participants who produce and income above or beyond what you are making as a private investor. 

  • Following publically shared trade opinion’s does not lead to picking the market direction.
  • Fund holders care more about their than your account development.

Conclusion: If you had a way to follow institutional money moves to the up- and downside, you would be better on than you are now. 

What to do to get there? 

Suggestion: Finding a system, which helps you to identify where institutional money is moving. 

Spot and follow Institutional Money Moves with NeverLossTrading

NeverLossTrading Top-Line Chart for Gold Futures July 2013 – Aug. 2014

NeverLossTrading systems spot and follow institutional money moves, offering high probability chart setups with defined entries and exits (colored dot on the chart) and stops (red line).
Surely, this also can be done on lower time frames:
NeverLossTrading Top-Line Chart for Crude Oil Futures: August 14th and 15th.

How about stocks? 

IBM on the Daily NeverLossTrading Top-Line Chart: July to August 15, 2014

How about FOREX?

EUR/USD on the NeverLossTrading Daily Top-Line Chart: July to August 15th 2014

Learn more about NeverLossTrading systems … click here

Take the chance to test us live:

Schedule a free consulting hour and we get together online, share our screens and answer your questions:
Call: +1 866 455 4520 or contact@NeverLossTrading.com

In case you are not yet subscribed to our free trading tips and market reports, sign up here:

http://www.neverlosstrading.com/Reports/FreeReports.html 

Please always consider the risk of trading and that past performance cannot be taken indicative for future results.

Good trading,

NeverLossTrading
A Division of Nobel Living, LLC
401 E. Las Olas Blvd. – Suite 1400
Fort Lauderdale, FL 33301

Saturday, August 9, 2014

Trading Financial Market Patterns


Price changes in all financial markets: Stock market, Commodities, Currencies, and Treasuries are a pure expression of supply and demand changes.  
 
NLT Top-Line Chart: Sell Signal with a NLT Light Tower Pattern and NLT Lime Line Price Move  

The chart above contains a clearly defined trade entry, which was confirmed by the next candle surpassing the formulated price threshold: Sell <$99.90. By our algorithm a NLT Light Tower initiated trend (candle with a cyan dot, signifying key changes in institutional supply and demand patterns) has a high probability (74%) to end in a NLT Light Tower, when using a 1-hour time frame. In addition, we find high predictability for price moves from one to the next NLT Lime Line (Quant based price levels). 

As an investor (longer-term perspective) or trader (short-term perspective), your key challenge is to find swing points where a shift between supply and demand takes place. 

In my early trading years, I got introduced to Moving Averages; today still key TV channels characterize the sentiment of an asset by their price position in relation to the 200-day and 50-day moving average. This for sure gives a chart reading; however, years back when writing an algorithm and taking charge at moving average based price turning points, such system turned out to be a pure gamble with a low probability for success. Imagine, if knowing the price position of an asset in relation to two moving averages would be enough to make a living from trading: Then nobody would ever go to work. 

How else to capture shifts in supply and demand patterns? 

Historically, technical analysis is used to predict a future happening on the price chart. The first technical analysis is reaching back to the 1600’s, when “Japanese Candle Sticks” started their development in tracking historic price moves to predict the price moves to come. Since then, there is an understanding that in traders are trying to gauge the depth to produce a high or low breakout of the price direction. When this is happening, usually the crowd follows the leaders and this is what we portrait on the chart in our 21st century algorithmic trading systems. They are related to the base understanding of the 1600’ but fit today’s market requirements. 

This is how NeverLossTrading records and portraits changes in price move patterns. 

NLT offers various systems for day traders, swing traders and long-term investors, taught in individual session to custom fit your personal wants and needs. For more information on our most favored mentorship, click the hyperlink on: NeverLossTrading Top-Line, a system for the high probability day trader, swing trader and long-term investor. 
 
Another Example for Crude Oil Futures on the NLT 1-Hour Top-Line Chart

Again, you find the same formation: What begins in an NLT Light Tower signal ends in a NLT Light Tower Signal: Trend initiation and trend exhaustion patterns, triggered by a change in institutional supply and demand: Price moves from NLT Lime Line to Lime Line. 

Click here to learn more about NeverLossTrading Top-Line

Feel free to schedule a private consulting hour: 

Call: +1 866 455 4520 or contact@neverlosstrading.com
 
In case you are not yet subscribed to our free trading tips and market reports, sign up here:
http://www.neverlosstrading.com/Reports/FreeReports.html 

We are looking forward to hearing back from you.

Good trading,

Thomas

Saturday, August 2, 2014

What return can you expect when putting your money in the financial markets: Stock Market, Currencies, Commodities, and Treasuries?

Our answer: It depends on the time frame you plan to stay in your investment.

Let us take an example of an average stock:

When institutional money starts flowing in or out, you can expect an average price move of about 1.8% of the share value in the next 1-5 days. If you are a long-term investor, expect about a 3.5% price move in the next 1-5 weeks. If you rather open and close your trade in the same day, expect about a 0.6% value change in 1-5 hours.

With a median time in the trade of three bars, this means:
  • Long-term Investments: 3.5% return in three weeks.
  • Swing Trading: 1.8% return in three days.
  • Day Trading: 0.6% return in 3 hours.
This picture changes when utilizing margin (factor four for day traders and factor two for swing traders and long-term investors) or leverage by trading the option of the underlying stock (about a factor 20, depending on the underling and implied volatility).

However, let us continue the stock trading example, assuming: Your trading system gives you two wins out of three trades; you constantly reinvested and you allow the price move a wiggle room of the expected return, then this will be the expected calculated returns:
Return and Risk Calculation for different Trader or Investors
The above table shows that the day trader, when using margin can expect the highest return and is risking the least amount of money per trade, while the long-term investor is taking a risk above the average expected return. Swing Traders in both examples have a positive expectation between risk and reward.

Why do so many people prefer long-term investing?

Our answer: This is what you been thought investing in; thus you prefer long-term holding of Mutual funds, 401(k), and broker held assets or ETF’s.

Make a change, learn to engage your money with the odds (reward over risk) in your favor: NeverLossTrading is a premier trading education institution teaching you how to benefit from utilizing algorithmic trading, where you trade with the odds in your favor, constantly engage your money and strive for above market average returns. We offer multiple mentorship classes that are tailor made to your trading style as a day trader, swing trader or long term investor. Two of our most liked programs;
If you want to find out which program suits you best, contact us for an individual consulting hour:
Call +1 866 455 4520 or contact@NeverLossTrading.com

In case you are not yet subscribed to our free trading tips and market reports, sign up here:
http://www.neverlosstrading.com/Reports/FreeReports.html 

We are looking forward to hearing back from you.

Good trading,

Thomas