Spot and Trade Institutional Money Moves

Algorithmic Trading with Human Interaction for:

Day Traders, Swing Traders, Long-Term Investors

Thursday, July 30, 2015

How to Spot Upside Market Potential - [eBook & Videos]

[eBook & Videos] – 5 New Ways to Improve Your Trading Balance
Dear Trader,
We’ve all heard the phrase “cut your losses and let your profits run”. 
And while this sounds nice, what does it really mean and how is the best way to go about doing it? 
Well, I recently had a unique opportunity to get together with 4 other industry pros to share our favorite setups for placing and managing trades with favorable risk-to-reward ratios. Our thoughts and ideas have been captured in a brand new eBook called Maximizing Profit While Minimizing Risk.
eBook Cover Promo July 2015
Whether you are a new or experienced trader, it’s always interesting to see what markets and setups the experts look for when they are considering entries with strong upside potential and minimal risk. It has helped me in the past, and I think you’re going to really like what we have to say about:
  • How to Spot Impulse Buy Retracement Setups
  • Why Forex Trading Differs from the Futures and Equities Trading
  • The Magic of the 200 SMA and Why You Should Use It
  • How to Confirm Your Entry and Exit with Confidence
  • An Algorithmic Approach to Help Identify Future Price Movement
  • And so much more …
Not only do we tell you what markets we like to trade, but we also show you the setups we like and how to trade them. 
Thanks for your support and I hope this new eBook helps you in your trading activities.
Thomas Barmann
Never Loss Trading
PS:  We’ve also made the eBook “interactive” and it has links to video demonstrations of our set-ups in order to make them easier to understand and use right. Watch our contribution: Trade Price Continuation Patterns live at: http://youtu.be/APJjz8G5_wg

Monday, July 27, 2015

Day Trading the S&P E-Mini Futures

Successful traders have a system, which is portraying key price turning points that have a high probability to conclude in the desired direction and are repetitive. In addition, such setups need to have clearly defined entries (spelled out price thresholds), exits (dots) and stop levels (red lines on the chart).
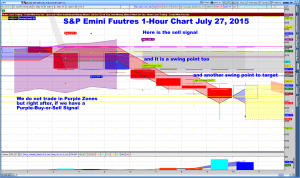
Emini S&P Futures Trade on the 1-Hour Chart, July 27, 2015
Emini S&P Chart July 27
This morning, the S&P 500 Emini Futures started the European session in a Purple Zone, signifying ambiguity: Institutional investors are not clear about the trade direction. As a result, we stay out of trades, even so signals might occur; until the Purple Zone ends in a directional price move signal:

The Purple Sell> $2068.75 occurred in the 6 a.m. candle and got confirmed in the 7 a.m. candle, leading to a short trade, producing a 3-point gain.

Simultaneous, an NLT Swing Point signal was painted, pointing in the same direction (double confirmation).
The minimum target for this trade was $2065.50 and it was reached in the 7 a.m. candle.

At the 8 a.m. candle another Swing point signal that was confirmed and came to target at $2060.75, giving you a 3.5-gain.
At times we get asked, why we offer multiple systems: To increase your participation rate.

On the above chart, we show a favored combination: NLT Top-Line and NLT Swing Point. 

What you see is activity based trading chart, following institutional money moves.
We teach you how you can spot and follow those trades on your own charts:
All mentorships are individually taught and focused on turning you into the trader you want to be.
To experience how NeverLossTrading works live, do not hesitate to schedule your personal consulting hour:

Call: +1 866 455 4520 or contact@NeverLossTrading.com 

We are looking forward to hearing back from you:
Thomas
NeverLossTrading
A division of Nobel Living, LLC
401 E. Las Olas Blvd. - Suite 1400
Fort Lauderdale, FL 33301

Monday, July 20, 2015

Mastering Your Trading

Experience different ways of trading the financial markets: reaching from Price Volume Analysis to Activity Based Trading by following institutional money moves.
Download your FREE copy of:
Mastering Your Trading: Learn from Expert Trading Advisors (Traders World Online Expo Books Book 6) Kindle Edition
Sign in your Amazon account and click download or cut and paste the following URL into your browser:
Never be late for a trade
We teach you how to spot and follow institutional money moves: 
All mentorships are individually taught and focused on turning you into the trader you want to be. 

To experience how NeverLossTrading works live, do not hesitate to schedule your personal consulting hour: 
Call: +1 866 455 4520 or contact@NeverLossTrading.com 

We are looking forward to hearing back from you:

Thomas

Friday, July 17, 2015

How to Stay Engaged in Your Trading – Pre-Market Movers

In our series of how to stay engaged in your trading, today, we want to refer to assets with a price move prior to the US-market opening.
Many of the US listed stocks are traded on international exchanges. Based on that, institutions already set new price points prior to the US market opening.
Never be late for a trade
In the morning, between 8:30 a.m. and 9 a.m. east, some of you receive a report called NeverLossTrading Pre-Market Movers. Listed are assets with market pressure and we prefer trading those either on a 10-Minute chart or on a 4-hour chart.
The referring trading concepts are taught in our mentorships.
Your big advantage of receiving this report: You trade assets on the move.
NLT Pre-Market Movers for July 16, 2015 (yesterday)
Pre-Market Movers July 16, 2015
What you see are stocks, futures and Forex pairs, where our scanners and indicators found price pressure, which might lead to stronger directional price moves.
As said, we prefer to trade developing price moves on 10-minute and 4-hour charts. Here our yesterday’s results, following our entry and exit rules:
NLT Pre-Market Movers Alert Results on July 16, 2015
Pre-Market Movers July 16 Results, 2015
What is the return expectation?
Prior to getting there, let us run some numbers on trading days and opportunities:
  • We have about 250 trading days.
  • At 50 out of 250 days, nothing is happening: leaves us with 200 opportunities for trading.
  • On a 4-hour chart, in average, we are about two days in a trade.
  • With two days in a trade, this gives us 100 opportunities a year to participate in trades.
  • About 40% of the listed opportunities fulfill the set trade conditions.
  • When trading a 10-minute chart, all positions opened will be closed the same day.
  • To open and close about three positions per day, you need to find 600 trading opportunities a year.
  • When we trade on a daily chart, the average time in a trade is four days; hence, we assume to take 50 trades per year.
As a result, you need to develop 250 – 600 trading opportunities per year either on your own or you rely on a proven alert system like NLT Alerts.
Return Expectations, at winning two out of three trades:
Stock Return Calculation
On a return expectation, the 4-hour trade runs at par with daily trade, trading frequently at 10 minute charts, has a 2.4 times higher return expectation.
When you want to be part of learning to find and trade high probability trade setups, schedule your personal consulting hour:
Call +1 866 455 4520 or contact@NeverLossTrading.com
Subscribe to our Pre-Market Movers or one of our other NLT Alerts…click.
If your aim is to achieve higher returns, leveraged products like Stock Options, Futures, and FOREX will be the right choice for you and we are happy to give you personal insights.
If you are not yet part of our trading tips and free webinars, please sign up here and we keep you up-to-date….sign up here.
We are looking forward to hearing back from you,
Good trading,

Saturday, July 11, 2015

Trading in Times of Ambiguity

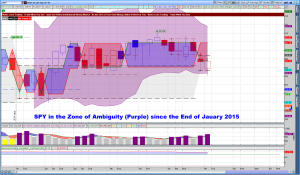
Since the end of January 2015, SPY, our leading indicator for the stock market, remains in the Purple Zone; expressing ambiguity: Institutional leaders give no clear sign for directional price moves.  
SPY Price Development 2015 (Weekly Chart)
SPY in Ambiguity 2015
However; we observe long weekly candles, which allow for shorter-term directional trades, while positioning trading is only advisable for assets with strong individual price moves. Independent individual movers on our watch list for next week are for example: AAL (however, DAL will declare earnings, which might have an impact), and EBAY.
As a consequence for next week, we favor 4-hour, 1-hour, 30-min and even 10-min trades over positioning trades.
Please build up your watch lists for stocks accordingly:
  • 4-hour trades from the last hour movers and long-term investor alerts, scans prior to 9 a.m. and 1 p.m. ET.
  • 1-hour trades from the last hour movers and the stock alert list.
On the side of Futures trading, we see market pressure at Stock Market Indexes, Bonds/Notes.
Currency traders, watch for moves in the AUD, JPY, and CND.
This question came to us: How important is the lower earnings declaration of AA (Alcoa) for the stock market development? Let us put the SPY (pink line) and Alcoa (red/blue line) on one chart:
SPY and Alcoa Price Development Compared on a Daily Chart
SPY and Alcoa July 2015
Since February of this year, Alcoa took and independent price move to the downside, which was not correlated with the overall stock market; hence, the influence of AA reporting 10% lower than expected earnings is not seen as significant for the price development of the overall stock market.
For your next week’s trading, please consider that a new earnings season just started. Hence, trade carefully and consider protecting long-term positions over earnings.
The financial markets have their complexity; however, we help you to de-complex them by focusing on spotting and following institutional money moves. If you like to learn how you can do this on your own, check our offering: http://NeverLossTrading.com and feel free to schedule your personal consulting hour:
Call +1 866 455 4520 or contact@NeverLossTrading.com
If you are not yet part of our trading tips and free webinars, please sign up here and we keep you up-to-date….sign up here.
We are looking forward to hearing back from you,
Good trading,

Thursday, July 9, 2015

Recording: Spot and Follow Institutional Money Moves

Institutional investors dominate the financial markets: Stocks, commodities, treasuries, and currencies. In case, you missed our yesterday's presentation or if you want to reiterate specific presentation parts, please watch our YouTube video (only up for short), using the following link:
Pre-Stages and Continuation Stages of Price Moves
Swing Point Trading ES 4-Hour Chart
Your charts can reflect those price turning points.
You can act on those buy and sell signals!
We dedicate our time and effort, teaching you to trade: stocks, their options, futures, and Forex with NeverLossTrading systems, all suited to your individual wants and needs.
Here is a short overview of our Mentorships
All mentorships will be individual taught and focused on turning you into the trader you want to be.
To experience how NeverLossTrading works live, do not hesitate to schedule your personal consulting hour:
Call: +1 866 455 4520 or contact@NeverLossTrading.com
If you are not yet part of our trading tips and free webinars, please sign up here and we keep you up-to-date….sign up here.
We are looking forward to hearing back from you,

Sunday, July 5, 2015

Spot and Follow Institutional Money Moves

Institutional investors dominate the financial markets: Stock markets, commodities, treasuries, and currencies. The market action results in a zero sum game, where one only can better its situation when another one is losing. As a private investor, you have the best starting position: You can implement and exit entire positions at once; institutions have to scale in and out of positions. This is giving you the competitive edge; you can rely on, over and over again
Join our Free Webinar at OnlineTraderCentral ....click
Wednesday, July 08, 2015 4:30PM EDT
Presenter: Thomas F. Barmann
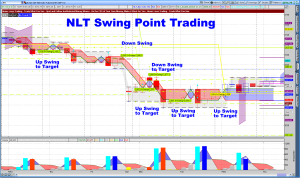
NLT Swing Point Trading Chart: Dots and lines on the chart signify target points.
Swing Point Trading ES 4-Hour Chart
The chart shows you:
  • Six trading points
  • Red Lines on the chart signify stop levels
  • Horizontal NLT Price Gravitation lines identify price accumulation or target levels

Would it make a change to your trading to act on such signals?

Do you think you can learn to act on buy and sell signals? 

We dedicate our time and effort, teaching you to trade: stocks, their options, futures, and Forex with NeverLossTrading systems, all suited to your individual wants and needs. 
All mentorships will be individual taught and focused on turning you into the trader you want to be. 

To experience how NeverLossTrading works live, do not hesitate to schedule your personal consulting hour: 

Call: +1 866 455 4520 or contact@NeverLossTrading.com 

We are looking forward to hearing back from you: 

See you at our Free Webinar: 

http://www.onlinetradercentral.com/presenter_YYRWD3.asp
Thomas