Spot and Trade Institutional Money Moves

Algorithmic Trading with Human Interaction for:

Day Traders, Swing Traders, Long-Term Investors

Saturday, October 31, 2015

Track and Trade Institutional Money Moves

TradeColors.com Weekly Chart for AA: Four trades, three winners; what else do you want?
With TradeColors.com, you trade after a sequence of two of the same-color-candles, when the high/low of the second same color candle is surpassed in the next. The above chart shows four trades; three winners (75% attainment rate), showing how high probability trading works for: stocks, their options, commodities, currencies, and treasuries.
Experience how to track, trace, and trade with the direction of financial market leaders.
If you cannot attend in person, receive the recording link.
Institutional investors dominate the financial markets, spot what they do and trade along with what you see on your charts:
Register…here or copy this URL into your browser:
If you like to read more about how to trade with institutional investors works, download this eBook, where we represent one of five authors, sharing how to trade the financial markets.
In case you feel ready to take the next step: Schedule your personal consulting hour:
Call +1 866 455 4520 or contact@NeverLossTrading.com
We are ready to help you, turning yourself into the trader you want to be and we are looking forward to hearing back from you,
Thomas

Saturday, October 24, 2015

Enter the World of Activity Based Trading

Experience in multiple events, how activity based trading can make a difference for you: as a day trader, swing trader or long-term investor.
Spot and Follow Institutional Money Flow
Institutional Money Flow by NeverLossTrading
Check us out and test us to the limits:
  1. The NeverLossTrading Principle explained: Clear cut documentation of how and why.
Read on for details….click.
  1. Free Ebook: Growth And Income For Any Account Type
We are one of five authors, sharing our way of trading.
Download your Free copy …here.
  1. Upcoming presentation at Festival of Traders on November 2, 4:30 p.m. EST
Register…here, for:  How to Track, Trace, and Trade with the Direction of Financial Market Leaders
Experience how our systems perform live.
Schedule your personal consulting hour:
Call: +1 866 455 4520 or contact@NeverLossTrading.com
Knowledge is power: We help you to turn yourself into the trader you want to be with  industry-leading one-on-one training and coaching.
If you are not yet part of our free reports, trade tips and webinars register here.
We are open for new students, spaces are limited.
Good trading,
Thomas

Monday, October 19, 2015

Stock Market Outlook by NeverLossTrading

Let us take some indications and prepare for our last quarter trading in 2015:
What are the world markets telling us?
  • Nikkei: Down 15% from August highs.
  • DAX: Down 20% from April highs and Deutsche Bank declaring an earnings problem.
  • Heng Seng: Down 15% from April highs.
  • S&P 500: Down 3.5% from July highs.
  • Crude Oil below $50, and below the cost base of most on land and sea productions, bringing the CAD down 20% in relation to the USD.
There is some room for movement in catching up to the overall world development.
Are you prepared for this?
  • Do you have a clear cut downside strategy to short the markets even in your retirement account?
  • Are your charts telling you when the move is happening?
  • Can you deal with volatility, where after a sharp down move a strong up-reversal is expected?
Imagine, you had the help of the following vector graphic for defining your trade direction and instead of staying in a trend forever, you traded for two-bars, with exit at the closing of the second bar or if the price of the asset moves to the red horizontal stop line. Your buy- or sell stop order placed three cents above the spelled out price threshold.
SPY October 1 – 16, 2015, Trend Catching Chart
Trend Catching SPY Example Calculated
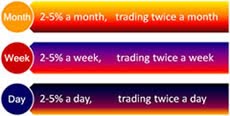
A 3.8% net return in 15 days does surely not sound too exciting; however, the NLT Trend Catching system caught 75% of the directional move and if you compounded interest, you would even be ahead of the overall price move of the market: we show you how to do this in our mentorships.
Too make it more exciting for you, let us now take a leveraged product and trade the same index performance with the with a futures product and measure the return based on the same rules:
Emini S&P Index Future: One Contract Performance October 1-15, 2015


Now we are talking: A 67% return was achieved, calculated based on the overnight margin of $5,060 for the Emini S&P Future.
We surely can also show you how the performance would have been, had you traded options or other leveraged products.
NeverLossTrading systems measure the activity of institutional investors and we do not most ingenious, we trade along with the move, from where it starts, to where it ends; only accepting little risk and aiming for what we call explosive breakouts that pay us along the price move.
We are a primer education institution with focus on one-on-one training, were you and your wants and needs are in focus and not the questions of other education participants that might just ask more than you do: Our focus is you and helping you to turn yourself into the trader you want to be.
To be part of this, schedule your personal consulting hour:
Call +1 866 455 4520 or contact@NeverLossTrading.com
We are open of new students now: Do not miss out.
If you are not yet part of our free reports,  trading tips, and webinars sign up here..click.
Good trading,
NeverLossTrading

Wednesday, October 14, 2015

Read Your Chart like a Pro

The challenge for every trader or investor is to predict the future price move of an asset right from the chart; however, if you had the following help, would that make a difference to your trading?
GOOG Daily NeverLossTrading Trend Catching Chart
Trend Catching Goog Example Daily
What you see on the chart from left to the right:
  • Sell< $620: Thus, you can place a buy stop order and when the price drops below the spelled out threshold of $620, you enter into a short trade on Google. In case your account does not allow you to short stocks, we share with you how to initiate the same trade by using options.
  • The red-line above of the candle, with the Sell<$620 signal builds the stop level and thus, you know when your assumed price direction is no more accepted and you either exit the trade or you apply an appropriate trade adjustment method (this is where our name came from, helping people to apply trade adjustment methods: instead of taking stops, turning potential losers still into winners).
  • Then you see on the price chart a #5-sign. This tells you, we have five of the same color candles in a row (here, red candles) and best take profit, expecting a counter trend move.
  • Indeed, a counter trend move happened and resulted in a Buy>$612.09 signal. The spelled out price threshold was surpassed in the next candle and again we trade; this time to the upside, where we exit at candle #5. The stop or adjustment level was below the red line.
How does this work?
Our indicators focus on institutional activity and portray, when institutions start selling or buying. With the help of the indicator on the bottom, you will judge if sellers or buyers are in command. In addition, you see their handovers in form of Buy- or Sell-signals, highlighting the candle in which the command changes, in our example:
  • One bar prior to the Sell signal: 9/22/2015
  • Right at the bar of the Buy signal: 10/1/2015
If you like what you see and you want to get a personal demonstration of our NLT Trend Catching- or any other NLT-System, please schedule your personal consulting hour:
Call +1866 455 4520 or contact@NeverLossTrading.com
NeveLossTrading systems are applied by day traders, swing traders and long-term investors.
We are in business since 2008 and focus purely on one-on-one teaching, where we can best focus on your wants and needs, helping you in turning yourself into the trader or investor, you want to be.
If you are not yet part of our free trading tips, webinars and reports…sign up here.
We are looking forward to hearing back from you.
Good trading,
NeverLossTrading
The risk of trading securities, options, and futures can be substantial. Customers must consider all relevant risk factors, including their own personal financial situation before trading. In our teaching of how to trade the markets, in our newsletters, webinars and our involvement in the Investment Clubs, neither NOBEL Living, LLC, the parent company of Never Loss Trading, or any of the speakers, staff or members act as stockbrokers, broker dealers, or registered investment advisers. We worked out trading  concepts and share them through education with our members and clients.