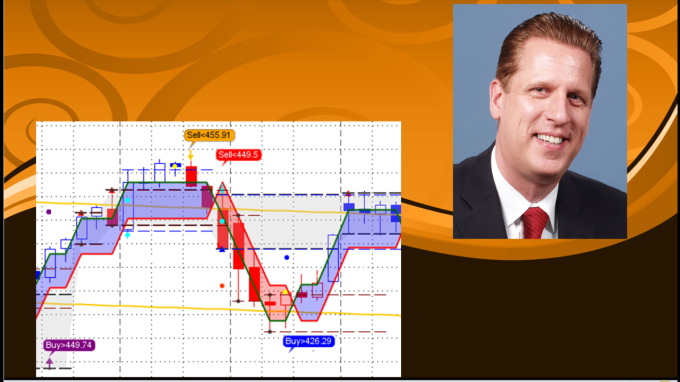
Are you seeking to move ahead with your trading or investing efforts?
If yes, read well and take notes about the details of what it takes to improve your results.
Why to take notes?
If mankind could learn by reading an article or a book, why would we need to study subjects for years and still keep very little in us?
Learn how to stack up the prerequisites for trading and investing in your favor.
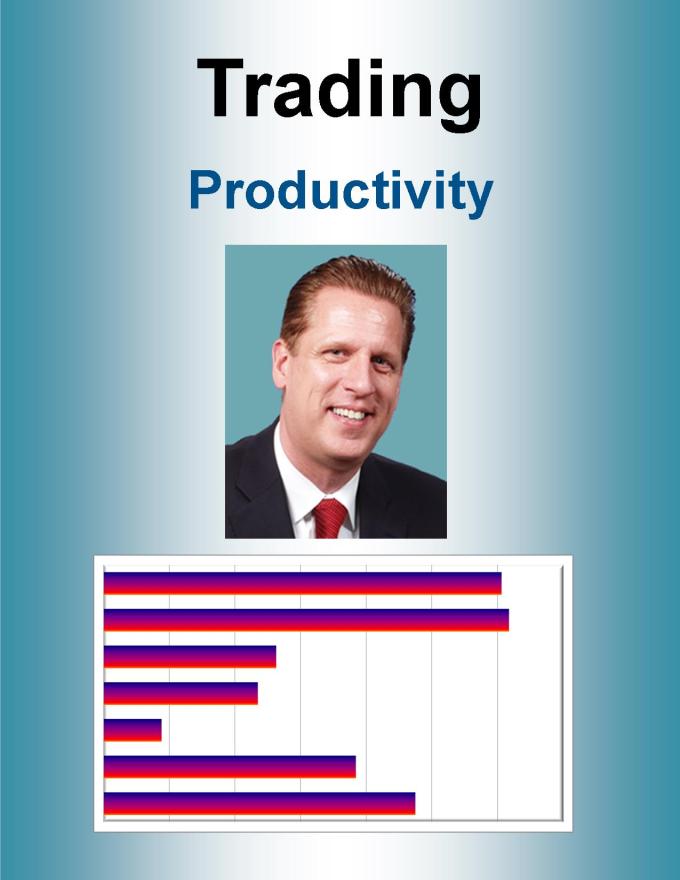
Productivity, a frequently used word, but what is behind it and how does a productivity measure open up the book with seven seals to trading success?
Productivity as a measure helps you to define the status quo of your trading and what it takes to move ahead.
In addition, you can calculate your efficiency ratio: how many trading opportunities are provided and in how many do you participate in and with which results?
With NeverLossTrading, we are offering multiple trading systems; all taught and coached in one-on-one mentorship programs, suited to your wants and needs.
Our internal measurement of the system productivity index is based on all of the System Provided Trade Setups (participation rate) x Average Probability for Success x Average Reward/Risk-Ratio per Setup.
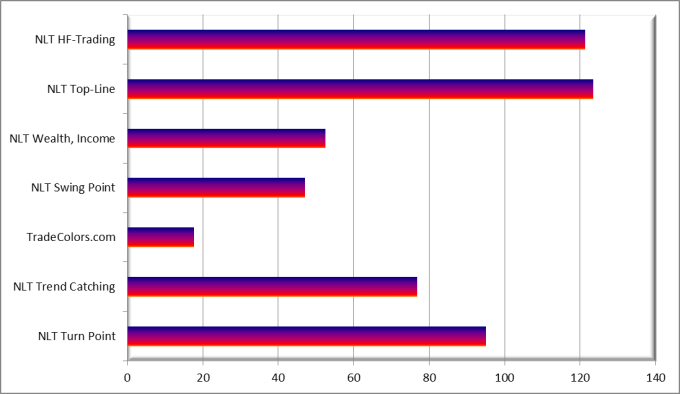
Chart-1: NeverLossTrading Productivity per System
Chart-1 shows a very tiny productivity index value for
TradeColors.com; however, please consider that this system beats most other trading systems available and allows you a budget entry into the world of algorithmic trading (see the example of Trader-3, below). By investing into a higher grade mentorship, your participation rate and trade accuracy will increase and thus, your trading productivity. Our flag ship product:
NeverLossTrading Top-Line achieves the highest productivity index.
NLT TurnPoint Trading is our latest edition, specifically designed for the more mechanical trader, who does not want to take considerations and rather trades signal-by-signal.
All our systems are modular and can be combined. Many of our clients use more than one system: When the tuition for the first system is paid back, they invest into another system to achieve a higher participation rate and trade accuracy: excelling the productivity index to the next level.
Let us give you a little background, why we publish and measure productivity in trading.
Commonly, productivity is defined as a measure of output per unit of input. In an economic function, input factors are capital and labor.
When we come to trading, capital remains to be one of the input factors; the output is measured by the return on capital per time unit (month, year). Let us now check which additional input factors to consider for a trading productivity measure:
1. The Reliability of Your Trading System: What is the probability of your trading system to produce reliable and repetitive results?
This is where most commonly used systems come short; they barely make it to produce a 50:50 chance and thus, most traders lose money. Your goal is to strive for a reliability >65%; giving you a chance to produce positive results.
2. The Participation Rate: In how many of the possible trading opportunities do you participate in?
When you only trade at a pre-defined chart constellation, how often does it occur and how can you scan for assets that provide you with the desired constellation? Unfortunately, few traders only are prepared for this and constantly know after the fact about an opportunity that was given. This factor is very often neglected and those, who are prepared can participate in a higher amount of opportunities.
3. Average Returns per Trade Based on a Unit of Risk
There is no risk-free trade and you better have a way to calculate how far a price move will reach when you enter a trade, allowing you to bring reward and risk into a predictable balance. By our observations, if you do not want to be constantly stopped by not allowing for a minimum volatility of the price move, your maximum risk per reward unit at entry shall be up to 1.2-times the reward you are trading for. This negative reward/risk balance shall surely not be the case for every trade; however, staying conservative in our calculations, we assume an average 0.9-reward per risk unit, balancing the average risk to reward at 1.11. Some systems promise 1:5 and 1:10 relations; however, in reality, you might be stopped 20-times before you realize a positive directional trade and thus let’s better stay realistic.
Successful trading has a lot to do with managing those relations. In our calculation example, we take four different traders, trading for a 2% return per trade, for a 100-bar period, with a base capital of $10,000.
Trader-1 observes a limited amount of assets and trades by his system with an average positive expectation of a 54%-win rate and turns his capital about 15-times.
Trader-2 observes a limited amount of assets and trades only when a Doji formation is built, which shall give him a 2:1 reward/risk ratio on a 54% probability (we have statistical evidence for this probability). The formation occurs rarely and thus he turns his capital 7-times.
Trader-3 observes a wide number of assets and by his scans or alerts (regularly finds trading opportunities), 25-capital turns are produced, on a 66%-predictability for the trade to commence in the desired direction with a 0.9-reward/risk ratio.
Trader-4 uses a high probability trading system with a predictability of 75% and constantly finds assets to trade by his scanners or alerts; hence, 33-capital turns are produced with a 0.9-reward/risk ratio.
Table-1: Productivity Comparison
Table-1 shows that Trader-3 produces double the amount of output (return on capital) and Trader-4 even three times the return of Trader-1 or Trader-2.
If you like to simulate with a copy of this Excel table, just send us an email with subject line: Productivity Comparison Table to
contact@NeverLossTrading.com
What does that mean to you?
If you are not producing profit or struggle with little profit from trading, consider upgrading to a higher probability trading system, helping you to produce returns from your capital and the amount of hours you are putting in: take a look at our overview site and see which system best suites you
…click.
See if there is a system you like and we are happy to give you a live demonstration and guide you what suits your trading needs the best.
We are looking forward to hearing back from you,
Thomas