Options offer wonderful tools for private investors to participate in the price moves of the underlying stocks, futures, commodities, and currencies.
With options, you find a variety of trading opportunities by Calls, Puts at various strike prices and expiration dates; not to mention the ability to create multiple types of spreads and combinations to take advantage of different market conditions; however, we want to keep it simple and focus on using options for participating in directional price moves of the underlying assets and you can do this with any type of account, even IRA, custodian, or cash accounts.

Thus, let us share with you how to find strong directional price move setups and explain the reasons for trading options instead of the underlying assets.
Focusing on a simple way of option-trading, we buy Calls to participate in price moves to the upside and we buy Puts for price moves to the downside.
What will be your advantage of buying options over buying or selling the asset?
Our answers are multifold:
- You can limit your maximum risk to the premium paid.
- Options allow you to only invest a fraction: 1% - 5% of the asset price.
- You operate with leverage, striving for 30% - 200% return per trade.
- Trades can be repaired when they do not work: reducing losses or even turning losers into winners.
- There is no uptick rule for buying or selling options and thus, you can participate in price moves to the downside in any type of account and market condition.
Your key to successful option-trading is your ability to repetitively predict directional price moves with a high accuracy.
This is where a trading system comes into play and you best only consider trading systems that offer you the following:
- A ≥ 65% probability to predict the future price move of an asset.
- Trading/investing at specific and confirmed entry conditions only.
- At entry, you receive specific target prices, reachable in a pre-defined period of time.
- Operating with specific stop price levels, where you either exit your trade or you start repairing it.
For option traders, the element of high predictability of a price move at a pre-specified time period is important: At whatever strike price you buy Puts or Calls, you are always paying a time value; which is decaying, taking away from your investment even so the underlying asset price might not even move in your disfavor.
Let us put together two examples:
TSLA Daily NLT-Top Line Chart March 5 to March 29, 2018
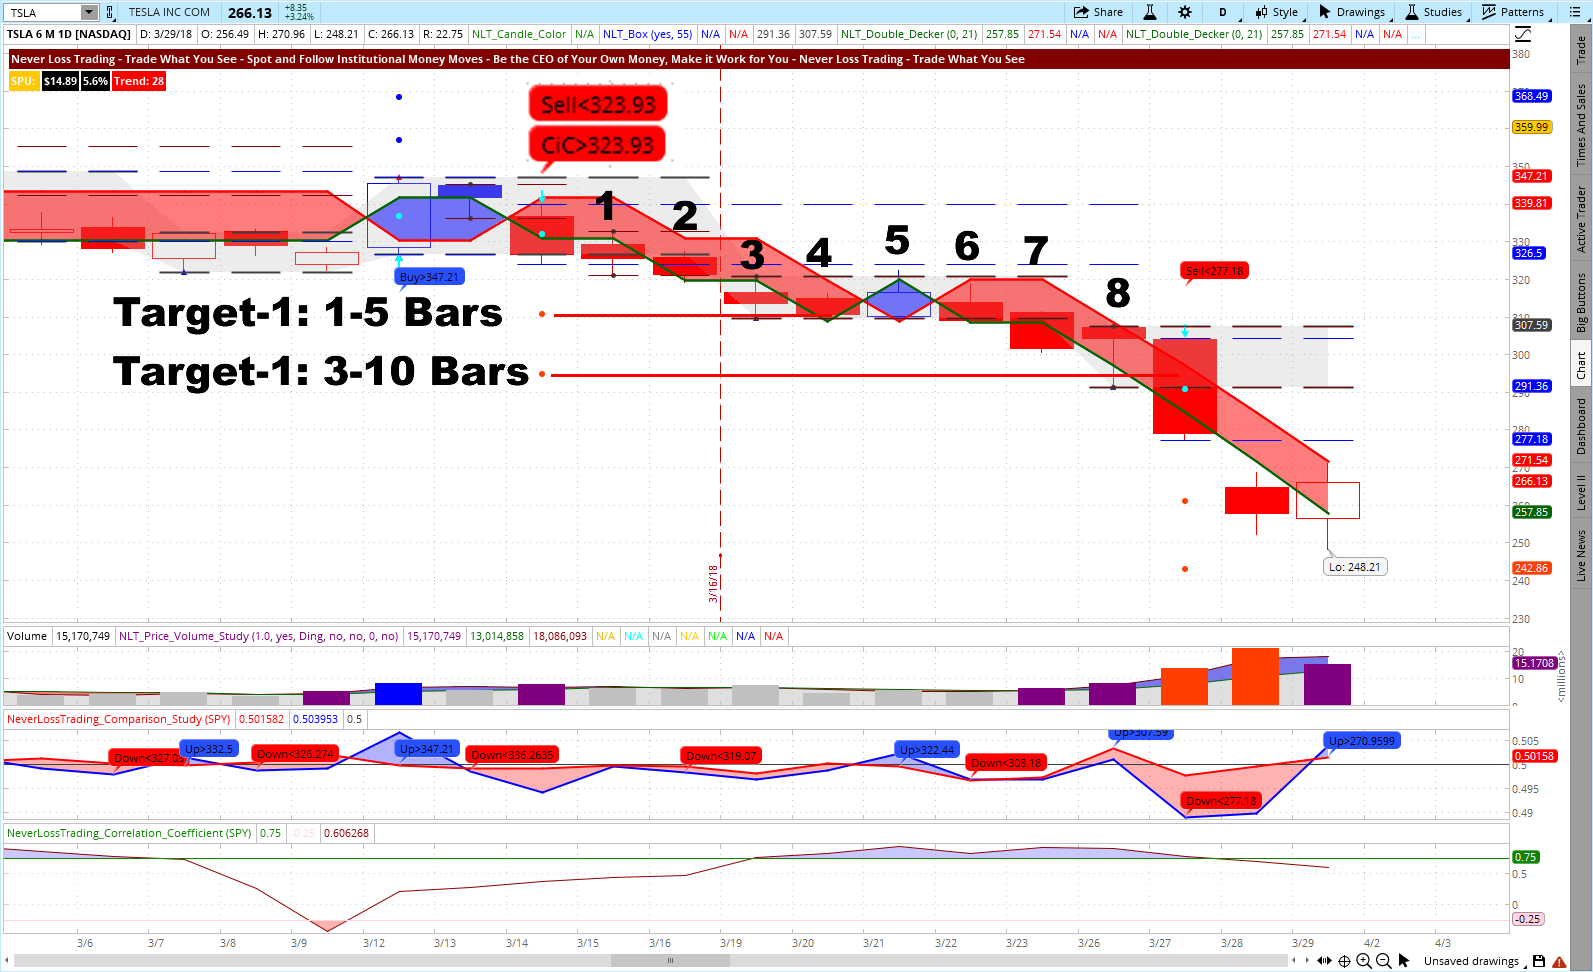
The chart shows you on 3/14/2018 a trade condition: Sell <$323.92 (CiC expresses a change in command; sellers take over from buyers at this setup). Thus you can operate with a clear-cut entry-level condition: When the price-move of the next candle surpasses the set price threshold, go short in the asset (TSLA) through buying Puts.
The trade entry condition was met in the next candle/bar on 3/15/2018 and thus confirmed the trade entry. By the system conditions, you know the maximum and favorable price to pay for the option and the time to expiration to decide for. We teach those details, concepts, and strategies in our mentorships and give you the tools on hand for taking solid trading and investing decisions.
Where is the magic in trading options?
Let us explain:
- You are able to participate in the downside price move of TSLA without the need to comply with SEC regulations that do not allow sorting stocks with account holdings < $25,000, or in an IRA, or cash accounts.
- No need to borrow TSLA stock from your broker, with the risk that it might not be available for you.
- The NLT system conditions specified at the chosen instance, the maximum price to pay for TSLA Put options at $14; favorably at $7:
- When accepting the trade, Puts were available at $7.22 and such the price to pay was in spec. (the NLT chart dashboard expresses those price levels).
- In essence, your minimum investment to participate in the price move of TSLA was 2.2% of the share price at entry (just a fraction); asking you for a $722 investment, which is more or less the price of two shares and you control 100.
- By NLT Top-Line, we assume to reach the price target-1 after a maximum time in the trade of five bars/candles.
- Actually, the price moved to target-1in three bars, producing a 70% return on investment.
- Price target-2 was supposed to be reached after a maximum of 10 bars and was reached at bar-8, with a return on investment of 433%.
Next, we show you if you like to take a longer-term perspective, how the system can help you to make sound decisions with fractional investments:
MSFT Weekly NLT-Top Line Chart, November 2017 to March 2018
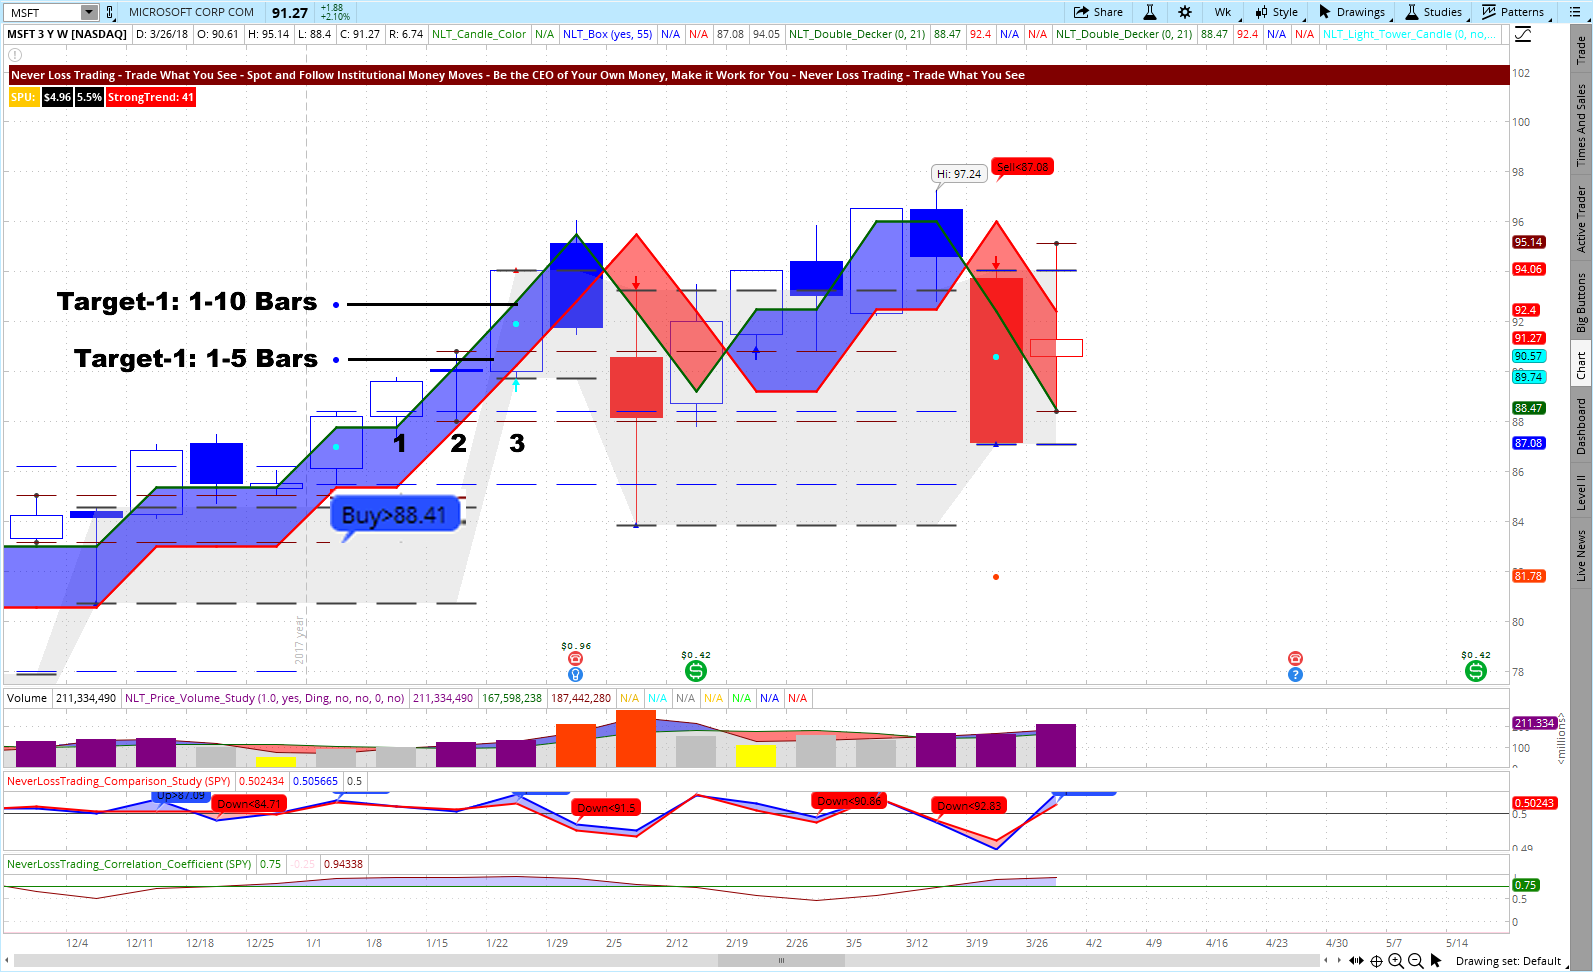
The chart shows a buy threshold at Buy>$88.41, which was confirmed in the price move of the next candle, allowing the trade entry with Call options. This way, you can pre-condition your order so it only goes into the market when your conditions are met, at your pre-defined offering price. This way, you do not have a need to sit in front of your computer for the order entry.
By our system, we originally assumed to reach the target-1 after one to five bars and got there in two bars. Target-2 was reached at bar-3 (3-weeks later), with the following return expectations:
- Return at target-1: 52%.
- Return at target-2: 110%.
Again, you just had to invest a fraction of the share price: <2 able="" and="" in="" increments.="" investment="" move="" of="" p="" participate="" price="" the="" to="" underlying="" were="" you="">
We hope this shows you, how you can keep more of your own money and make better than average returns… and fewer mistakes. NeverLossTrading provides you with the systems and knowledge to find such opportunities and to make those decisions. You stay in control as the markets move up and down, with at-a-glance guidance where the chart will tell, when to best buy or sell. Your trade potentials are either to be found by own scanners or by the NeverLossTrading Alerts (subscription service).
To learn more about what you will experience trading the markets the NeverLossTrading way,
check out our info page and make a decision..click. We are in business since 2008 and developed multiple systems and the necessary tools and knowledge base to support you in your aim for trading and investing success. If this is for you and you want to experience how it works live:
Call
+1 866 455 4520 or
contact@NeverLossTrading.com
If you are not already subscribed to our free trading tips, reports, and webinars
…sign up here.
Best regards,
Thomas Barmann
Disclaimer, Terms and Conditions,
Privacy |
Customer Support