Spot and Trade Institutional Money Moves

Algorithmic Trading with Human Interaction for:

Day Traders, Swing Traders, Long-Term Investors

Wednesday, December 16, 2015

Act Like Institutional Investors

The big money moves the markets and the influence of leading financial institutions even increased in the last seven years. One little demonstration: Goldman Sachs balance sheet development 2007 – 2014 (source: annual report): Since the end of 2007, the common equity of GS is up 85 percent. Their liquidity is approximately three times higher than the end of 2007, with further progress in 2015.
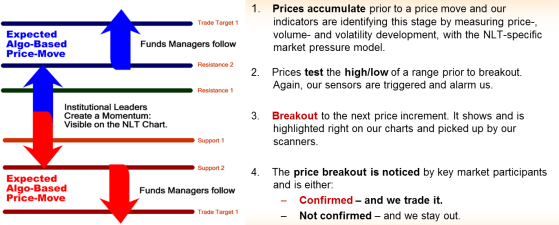
By the action of key financial institutions asset prices constantly change and when you are able to spot key price turning points, you can be part of the constant change in supply and demand.
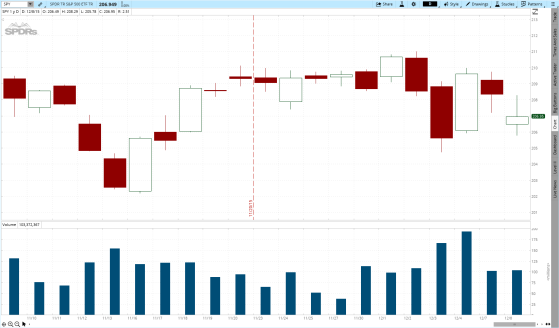
Price Turning Points for the Goldman Sachs Stock, November 20 – December 14, 2015
NLT Top-Line GS Daily.png
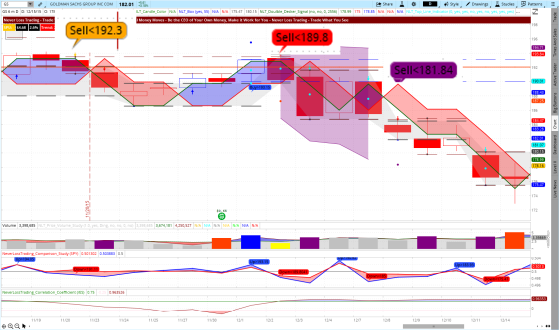
On the NLT Top-Line chart above, you see three key price turning points, which were found by the NeverLossTrading algorithms. At each trade a defined entry level price threshold is formulated which builds the entry price level for a in this case, the sell-stop orders: Every trade has a clearly defined entry, exit and stop. Above, we showed a trading example from a daily chart, how does such system look at a lower time frame?
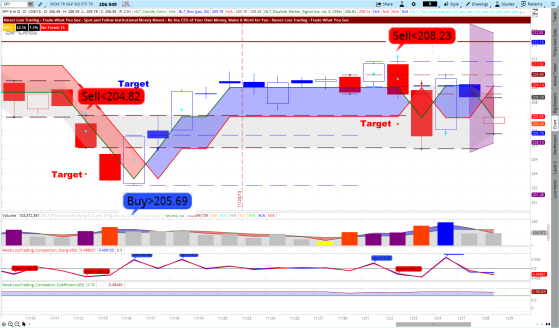
NeverLossTrading Top Line Chart: 1-Hour Goldman Sachs, December 10 – 15, 2015
NLT Top-Line GS 1 Hour
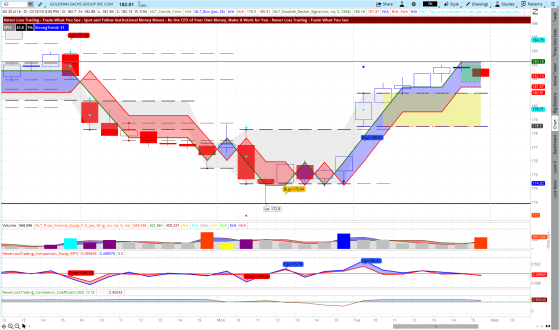
When it works for a stock, does it work for an index or commodity too?
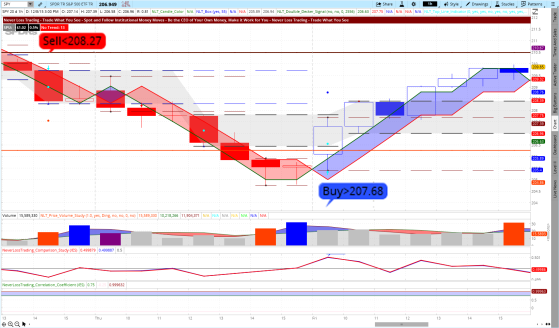
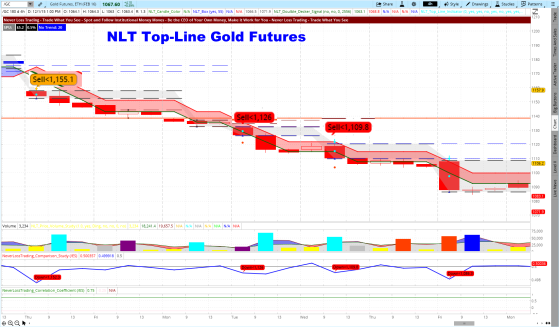
NLT Top-Line, 1-Hour Crude Oil Chart, December 11 – 15, 2015
NLT Top-Line Crude Oil 1 Hour December 2015
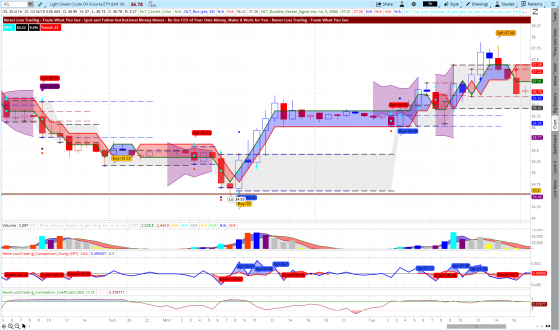
Can you see the key turning points our activity based trading system portrayed on the chart?
As a private investor, you have a key advantage over institutional money: speed. You can enter and exit entire positions at once, while institutions scale in and out of positions and thus, they leave a trace that you can spot and follow.
If your account does not allow you to short stocks or trade futures, learn how to participate in downturns with simple to learn and highly effective option strategies.
Make a change to your trading for the upcoming year:
  • Find key price turning points.
  • Apply strategies to trade to the up- and downside.
  • Always define entry-, exit-, and stop levels for every trade to take.
  • Trade frequently when prices turn, entering and exiting entire positions at once.
  • Build a business plan, including a financial plan and action plan, telling you what and when you want to trade.
Do you have this entire already in place?
If not we are happy to work with you, call +1 866 455 4520 or contact@NeverLossTrading.com for a personal consultation, where we help you to find the system that will prepare you for 2016 as day trader, swing trader, and long-term investor.
If you are not yet part of our free trading tips, webinars, and reports…sign up here.
By teaching one-on-one, spots are limited.
Do not miss out!
We are looking forward to hearing back from you: contact@NeverLossTrading.com  

Wednesday, December 9, 2015

Market Timing

Market timing means buying and selling at the right price: This is exactly the business all institutional investors are in and why the financial markets progress in alternating prices.
Let us put this in action terms: You focus on a specific price at which you enter the market and pre-define where you want to exit.
If you feel, you are not yet predicting market prices or market timing to your satisfaction; you might want to consider using a system, which gives you high probability trade setups with defined entry and exit prices.
NeverLossTrading Top-Line Chart, SPY – Daily - November 9 – December 8, 2015
Top-Line SPY November 9 to December 8, 2015
The above chart shows how our algorithmic-, activity based trading system defines price thresholds like Buy>$205.69; when this price threshold is surpassed in the next candle, we enter a trade with a buy-stop order and exit at the pre-defined target, highlighted on the chart.
In total, we had three winning trades on SPY, staying in a position between one and two days.
Check the chart again to recognize how important it was to exit at target: At both sell signals, the price immediately reversed after the target was reached: In this case perfect market timing on trade entry and exit.
Why did this work?
With our activity based trading system, you can spot and follow institutional money moves as a day trader, swing trader and long-term investor.
We teach one-on-one, how you can specifically apply our systems at your available time and for the assets you prefer to trade: Stocks, options, futures, FOREX.
Day Trading Example: NLT Top-Line, SPY 1-Hour Chart, December 2 – 4, 2015
Top-Line 1 Hour SPY December 2  to 4, 2015
From left to right, you see a late in the day entry on Sell<$208.27 and a day trade that was closed the same day on Buy>$207.68.
Institutional supply and demand specifies the action we filter with our algorithms and paint the potential trade situation on the chart for you.
In case you trade from an IRA account, we show you how to participate in market downs with the help of trading options.
Our charts will help you to figure out where price will turn and where they most probably will go, considering major supply and demand levels, where you can expect institutional orders to drive the price in the one or the other direction:
A significant supply/demand imbalance turns the prices and our systems help you to spot and act on those instances.
This is most likely how you would have seen the same situation on your chart:
SPY Daily Chart without Indicators, November 9 – December 12, 2015
SPY on a blank chart
No wonder, that it is hard to make sound trading decisions without a fact based proposition.
Make a difference to your trading and schedule your personal consulting hour to find out which of our systems suits you best:
Call: +1 866 455 4520 or contact@NeverLossTrading.com
If you are not already part of our free trading tips, market reports, and webinars, sign up here.
We are open for new students, capacities are limited, do not miss out.
We are looking forward to hearing back from you.
Good trading,
Thomas

Wednesday, December 2, 2015

Basic Trading Success Principles

As a trader you are making financial decisions which involve another party to buy or sell to: Somebody is taking the other side of your trade and they are trying to profit from your decision.
Some people perceive this as an unfair game; however, this is how the system is set up: Realize that the responsibility to make the right decision is on one person, you.
Your challenge is to first become aware of this issue, and then understand how to make the right decision and, lastly, feel comfortable doing it repetitively.
Who represents the other side of your trade?
An institution, providing liquidity; allowing your order to be instantaneously filled when your offer is matched.
Liquidity providers – often characterized as market makers, but not limited to market makers - can only stay in business when they constantly make more right than wrong decisions.
By this setup, you are facing a strong opponent: A professional trader, prepared and ready for doing everything that his decision is better than yours.
This simple understanding already gives us a hit why many beginning traders fail in their trading endeavors.
What is your way around this and how can you be more on the right than on the wrong side of a trade?
Institutions dominate more than 85% of the financial market decisions. Their activity leaves a trace, which gives you a base to spot and follow institutional money moves by applying the success principles of NeverLossTrading:
Always consider: A single action of an institution does not start a price trend; you only want to put money behind the action when other market participants confirm the new trade direction:
NeverLossTrading Activity Based Price Move Model
Pricing Model NLT
Another important aspect you want to take a note on: Key asset holders will have a strong need to re-balance their inventories and thus, at a certain price expansion point will either float- or shorten supply, which will result in an opposite directional price move; taking away from your profits. Knowing this, we pre-calculate how far the expected price move shall reach and encourage you to take profit, before you can assume prices to retrace or revert.
Our tool to calculate the expected price move is the SPU = Speed Unit
SPU with Text
Basically: You trade with the trend when it starts and you exit before the end.
Does that always work?
The answer is no, but we can show you how it works frequently with a high probability.
Setup your personal consulting hour:
Call +1 866 455 4520 or contact@NeverLossTrading.com
Find the system, which is right for you and learn trading from a success coach, focused on highly efficient one-on-one training and coaching sessions.
Learning trading class-room-style is inefficient and takes years: to move ahead on a fast pass, learn one-on-one, with focus on your wants and needs.
Let us give you some chart examples:
Example-1: NLT Trend Catching Chart November 11 to December 1, 2015
Trend Catching ES 4-Hour Trade
NLT Trend Catching provides multiple re-entries on a developing trend with limited risk and clearly defined targets. The constellation above shows highlighted in orange, when trade directions got confirmed. According to our trading model that we shared above, signals that do not get confirmed lead to no trade.  
Example-2: NLT Top-Line Chart for Gold Futures
Top-Line Gold 2015
Gold futures dropped 65 basis points or $6,500 dollars/contract in seven trading days.
Would such clearly distinct directional signals help you to make more sound decisions along with institutional investors?
If you are not a futures trader, we show you how to participate in such a downtrend with an ETF.
In case your account does not allow you to short assets, let us demonstrate how you can reach the same and on top leverage the price move by trading options.
Make a change for your trading and setup your personal consulting hour:
Call +1 866 455 4520 or contact@NeverLossTrading.com
You want more detailed explanations on NeverLossTrading: Download your PDF write up…click.
Based on one-on-one training our capacities are limited.
Do not miss out.
If you are not yet part of our free trading tips, reports, and webinars, sign up here…click.
We are looking forward to hearing back from you,
Thomas