Spot and Trade Institutional Money Moves

Algorithmic Trading with Human Interaction for:

Day Traders, Swing Traders, Long-Term Investors

Saturday, January 28, 2017

Video on High Probability Trade Setups

Watch in our 10-minute video how you can spot and follow high probability trade setups with the NeverLossTrading algorithms and vector graphics. 
Trade what you see: Let the chart tell, when to buy or sell! 
high-probability-by-neverlosstrading
If you are not yet signed up for our free trading tips, reports, webinars...click. 
If you like to learn more about our Trading Systems: 

Call +1 866 455 4520 or contact@NeverLossTrading.com 

We are happy to give you a personal demonstration and we are looking forward to hearing back from you. 
In support of your trading performance,
www.NeverLossTrading.com 

Saturday, January 21, 2017

Free Webinar: High Probability Trade Setups

You are Invited to Experience: High Probability Trade Setups

Thursday, January 26, 2017 4:30 PM EST

Click here to register...click.

There are repetitive happenings based on changes in supply and demand that you can spot and follow. With the help of our algorithms and vector graphics, we make those visible for you and you can follow the resulting price moves with multiple trading strategies: as a day trader, swing trader, and long-term investor.

High probability means for us: When you back test 100 trades, your system shall produce >65 winners, by following specifically spelled out conditions.
Repetitive Happenings
Price changes have an underlying measurable pre-phase and continuation phase. Our algorithms highlight those happenings and you learn to follow them with clear cut and pre-defined Entries, Exits, Stop or Trade Adjustment levels.
Expect to be in a directional trade for 1-5, maximum 10-bars: Surely, our systems work on very short-term, 1-hour-, 2-hour, 4-hour, daily and weekly charts.
Our mathematical models are based on the real life happening where institutional leaders trigger a change in supply or demand and we trade when other market participants follow the action, with the aim to close the trade at a pre-defined price point.
Algorithmic trading methods, prior only available for the big banks, are now available for you.

NLT Top-Line Chart for the S&P E-Mini Futures✽ (with special offer)

✽Trade initiation when the spelled out price threshold is surpassed: Target at the set dot or horizontal lines, marked as Exit.
Join our presentation and experience more examples of how we can help you to spot and follow institutional money moves with the help of our algorithms and vector graphics.

Click here to register...click.Click here to register...click.

This webinar will be presented by:

Thomas Barmann from NeverLoss Trading

Please Email: contact@neverlosstrading.com or Call +1.866.455.4520 if you have any questions prior to the event. We look forward to seeing you ALL there Thursday afternoon at Online Trader Central!

❋  Sign up for our FREE Trading Tips, Webinars and Reports!  ❋

Thomas F. Barmann - Owner and Inventor of NeverLossTrading® and TradeColors.com
His first introduction to trading came when he was 22 years old (30+ years ago). Over the years, he acquired a wealth of knowledge, how private investors can make money in the markets by focusing on constant income. He acts by taking advantage of spotting and trading institutional price moves, minimizing risk and compounding interest. His aim is to make the world a better place by sharing knowledge and giving education. A very small group of people keeps the knowledge how to trade the financial markets and those who enter, without being well prepared are most welcome, because they have a very low likelihood to leave with their money. Make a change and make money in the markets by spotting and following institutional money moves.

Saturday, January 14, 2017

7 Commandments of Successful Trading

Today, we want to share with you seven key elements to consider for being a successful day trader, swing trader, long-term investor, or a combination of those.
Let us prepare a short list for you and then fill it with life:
  • Strategy: System
  • Faith: Follow Your System
  • Discipline: Focus
  • Preparation: Ready
  • Management: Execute
  • Improvement: Progress
  • Dedication: Plan
With the following guide, you have three choices:
  • Implement all of those steps on your own: took us more than 10,000 hours.
  • Find a provider who can teach you: we are in business since 2008.
  • Disregard them and continue the way you always did.
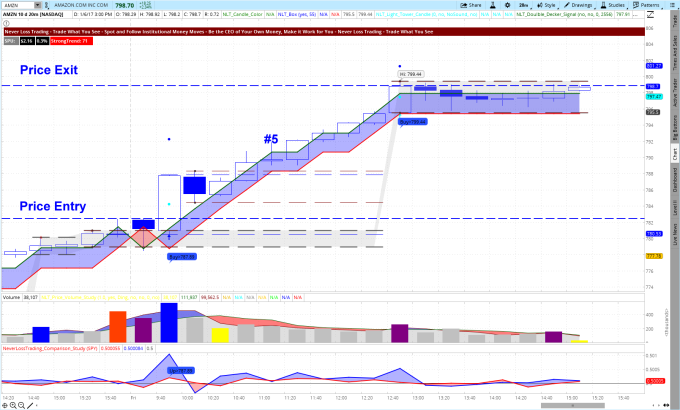
1) Law of Strategy: have a system with clear cut entries, exits, stop- or adjustment levels; that produces repetitive, favorable trade patterns for you.
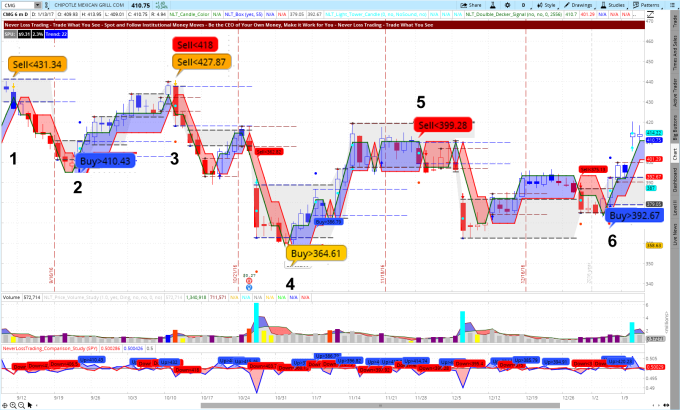
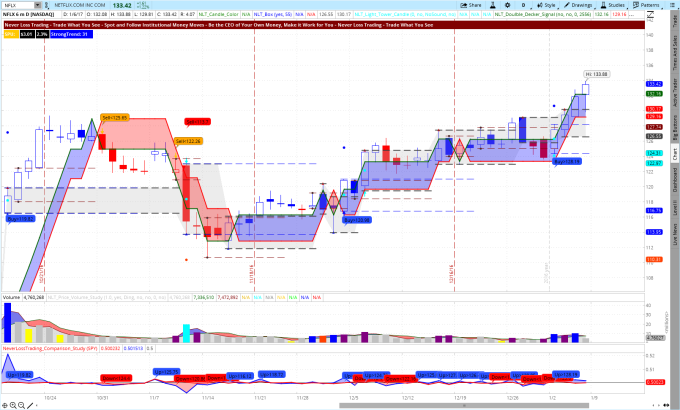
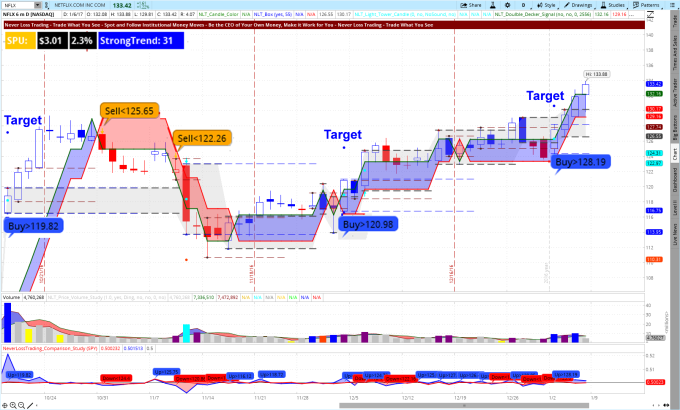
CMG Daily NeverLossTrading Top-Line Chart, September 2016 to January, 11, 2017
cmg-september-8-to-january-11-2017
The CMG chart shows you multiple highlighted trade potentials, spelled out by the system, with the following conditions:
  • Trade, when the spelled-out price threshold is surpassed in the next candle to be sure other market participants follow the indicated direction.
  • On red- and blue signals, trade up to five bars or 2-Speed-Units (SPU); on orange signals trade for a maximum of 10-bars. In each case, you can trail your stop with the red line on the chart.
This way, you were able to participate in six trade setups. Let us discuss those one-by-one:
SituationSignalTrailed Stop2-SPU ExitTiming
1Orange+$24+$19Entry at 9/12/16
2Blue+$18+22Entry at 9/23/16
3Red, Orange+$14+$20Entry at 10/12/16
4Orange+$30+$22Entry at 11/3/16
5Red-$11-$11Entry at 11/29/16
6Blue+$21+21Entry at 1/6/2017
Result
+$96+$93
The above table shows similar results by either trailing the stop or exiting after a 2-SPU move (SPU is an in-house developed algorithmic measure for the expected price move after institutional engagement was assumed and confirmed).
Without compounding interested and trading the stocks, a 25% return on cash in four month was achieved. We are specialists in teaching you how to trade options of the underlying, investing only 1% - 5% of the share value, accelerating returns, limiting risk. It will be eye opening for you!
If you like to implement such in your trading, call +1 866 455 4520 or contact@NeverLossTrading.com.
2) Law of Faith: Follow your system, in particular at times when the going gets tough; no system produces 100% positive results and thus, dealing with setbacks and failure is part of trading.
stock-prices
It is easy to back test a system; just make sure it has clear cut rules for entry, exit, and stop. Check how many trades out of 100 confirmed trade situations were winners and how many losers.
We encourage people to use a system that produces high probability trade setups where you win more than 65% of the time…check for some recent examples…click.
Thus, when you have such system, hold the course, even when things go wrong. Unfortunately, this is where many give up and hunt for the next system; while considering that standard indicators will not give you a higher predictability than 55% on average.
3) Law of Discipline: When your time for trading is there, you focus, you are ready and prepared to execute on the opportunities that arrive, not letting other influences disturb you from doing what you prepared for.
Working or trading from home is not for everybody. Do not let daily life disturb your trading. Have your screen setups and everything in place that you can do what you want to do; focused and undisturbed.
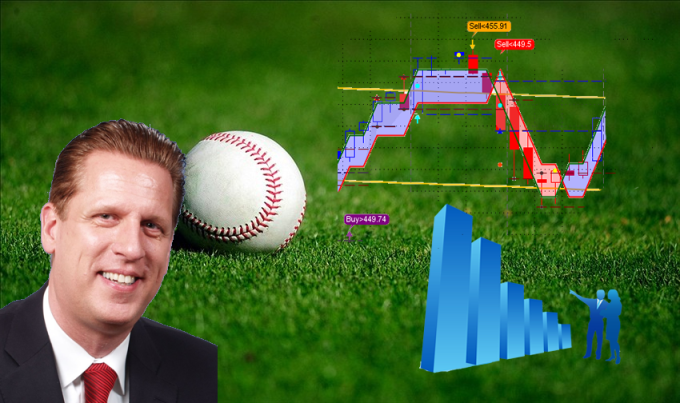
The success principles of trading can be compared to professional sports: Success comes from skill and practice.
  • When stepping onto the plate, I am prepared to swing, wait for the right moment and trade.
  • On each opportunity, I am prepared to make short-term good profits, administering tight stops, and when the market allows, I am aiming for the fences.
baseball-scheme-by-neverlosstrading
  • Bring the odds on your favor; take trades in accordance to defined system entries.
  • Fill the bases: Scale in and out of positions to capitalize on home run possibilities.
  • Accept losses as part of trading, knowing the next trade will come from your system.
  • Concentrate on what you are doing without distraction.
4) Law of Preparation: Every day that you want to trade, you are prepared with a clear cut analysis, knowing which instruments to trade and how; you operate with a cheat sheet (electronic form welcome) of what to do and the strategy to follow.
NeverLossTrading offers multiple alerts to highlight trading opportunities for you. In two of our systems, you even operate with market scanners and watch list indicators, allowing you to do your own analysis on multiple time frames.
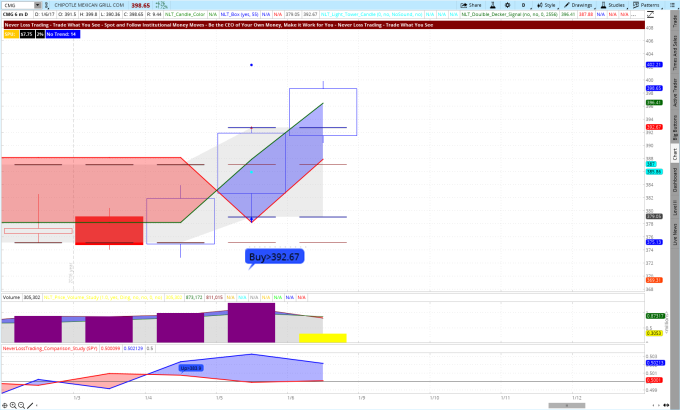
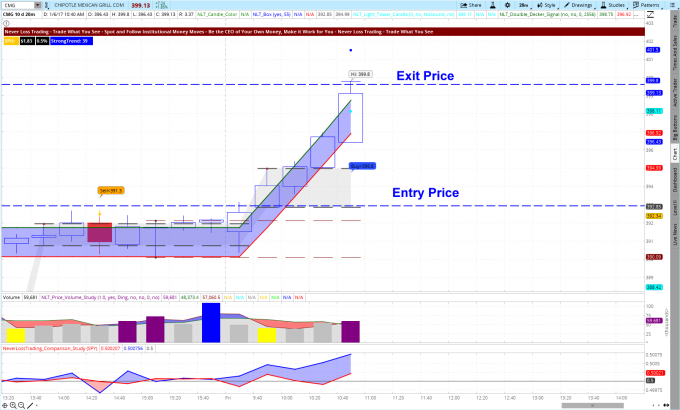
Let us give you one example for the newly developed NLT Strong Movers Alert. It is based on NLT Top-Line signals and highlights specifically strong price turning points.
For January 9, 2016 we had the following trade potentials specified and applying our conditions, this were the results.
Highlighted StocksSentimentDaily Chart Setup Approximation (tight stop)Comment on the Daily SignalResult
WMTBearFavorableSignal not confirmedno trade
ADMBearFavorableSignal not confirmedno trade
KBHBearFavorableSignal confirmed and trade closed 1/12/17Win
PHMBearFavorableStoppedLoss
TEVABearAcceptableSignal confirmed and trade closed 1/11/17Win
MDTBullFavorableSignal confirmed and trade closed 1/11/17Win
EBAYBullRiskyRisky, no trade.no trade
ABullAcceptableSignal confirmed and trade closed 1/11/17Win
TXNBullAcceptableSignal confirmed and trade closed 1/11/17Win
The report contains per symbol, clear cut entry, exit, and stop rules to follow.
We offer multiple trading systems….click, all taught one-on-one, with high dedication to your best available times. If you like what you see, ask for a personal demonstration:
Call +1 866 455 4520 or contact@NeverLossTrading.com
5) Law of Management: All trade mechanics are setup to execute your orders and in case you need to adjust a trade, you will know when and what to do. Trade adjustment has two dimensions: adding to winners and repairing potential losing trades. You work with buy-stop and sell-stop orders (bracket orders preferred), so you can pre-program your conditional orders in advance that they execute automatically when your conditions are met. This way you never run behind the happening and you realize the participation rate you desire.
6) Law of Improvement: You strive for constant improvement by journaling your trades to analyze what you do well, which you will repeat and where you did not do well; which you will stay away from if possible or improve.
We sure help you to do such and add a mentorship period after teaching you how to work with our systems, where you can send in your trades for constant feedback and improvement.
Hence, you are not alone, you are coached to turn yourself into the trader you want to be.
7) Law of Dedication: You treat trading as a business; regardless if you occasionally trade or trade for a living; thus, you follow a written business plan, which contains the elements of a financial plan: expected returns, maximum risk per trade etc. and an action plan: what to do when and how: instruments to trade, trade strategies to follow, times to be in or out of a trade (news announcement, earnings).
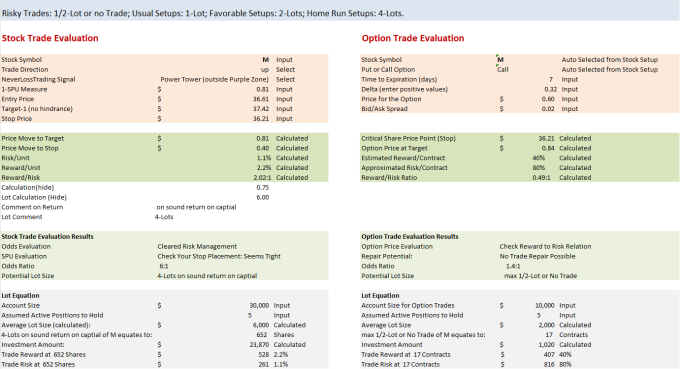
Example of a Position Sizing Model to Decide for Stock or Option Trades
position-sizing-model-2016
The table above shows just one small instrument, our focus is having you to operate with a  clearly distinct written business plan that gives you a sound perspective of the maximum risk you take per trade, the expected returns per instrument and trading strategies; how to put everything into action: a guide to follow striving for trading success as a day trader, swing trader, long-term investor or a combination of those.
We are ready to implement all of this into your trading routine:
Call +1 866 455 4520 or contact@NeverLossTrading.com
By teaching one-on-one, spots are limited, so do not miss out!

If you like to subscribe to our FREE trading tips, webinars, and reports...click
We are looking forward to hearing back from you,

Saturday, January 7, 2017

High Probability Stock Trading

In this publication you will experience how to translate high probability daily chart setups into short-term trades with very favorable reward/risk-ratio constellations: Algorithmic trading with the odds in your favor.
Key question: How do you know where the stock price will go?
stock-prices
The answer is easy: You don’t and we do not know it for certain either; however, we can help you with algorithms that find institutional engagement and thus produce high probability trade setups, indicating where a price move initiates, will go to, and where it might turn.
By using vector graphics and real time data, our slogan is: Let the chart tell when to buy or sell!
NFLX Daily NeverLossTrading Top-Line Chart on January 6, 2017
nflx-january-6-2017
The NFLX chart has many details; most important, it spells out defined buy- or sell indications. In addition at each red- and blue signals, you find a set target to trade for: dot on the chart. The stop for the trade is either at a horizontal dashed line or at the red line on the chart, called the NLT Double Decker Stop Line (helps you to trail stops if desired).
In the top left corner of the chart, you see a dashboard, which is telling you our SPU-measure: An approximation of how far the bar-by-bar price move shall lead at trade entry, with the assumption that orange signals have a good chance to produce a 2-SPU price move after a maximum of 10-bars and thus, we did not paint a price target dot on the chart.
We teach in multiple hours, one-on-one, how to work with all chart details, trading strategies, a clear cut business plan (action plan and financial plan in our mentorships)…and more. Our training is focused and each session recorded: Highest learning efficiency at your best available days and times.
If this is for you: Call +1 866 455 4520 or contact@NeverLossTrading.com for more details.
Is it hard to read the chart?
Let us magnify the most important chart indications.
NFLX Daily NeverLossTrading Top-Line Chart on January 6, 2017
nflx-january-6-2017-2
At the end of the day, all buy and sell signals indicated for NFLX produced positive results by exiting the trades at target and prior to the price direction changing again.
What do you do if holding stock positions overnight is not your thing?
You want to close your position at the end of the day and not worry about what can happen overnight!
Not a problem, we use fractal based algorithms that replicate their signals at all time frames and for all asset classes: stocks, options, futures, FOREX; just in this publication we refer to stock trading only.
Longer- and shorter time-frames can be easily combined.
On our newly developed NLT Strong Movers Alert for January 6, 2017; CMG triggered a long signal. If you do not want to trade with the required risk for handling a daily chart, you can do the following:
  • Scale down to a 20-minute chart.
  • Take your trade Entry point from the daily chart: Buy > $392.67 (buy stop order).
  • Set an open target by trailing with the red line on the chart or exit at bar number-5 of the same color series, or consider an exit after a 2-SPU move.
  • The initial stop will go to the red line on the chart: NLT Double Decker Study ($390.09). Thus, your risk in the trade is: $392.67 - $390.09 = $2.58, while the daily chart required $13.62 of risk.
  • To execute those trades on the regular, you need to fulfill day trading requirements, specified by the SEC: If you execute four or more day trades in a margin account, your minimum account holding has to be $25,000. Some smaller account holders get by, through splitting funds into multiple accounts (the day trading rule is measured per account).
  • For shorting stock, which should be part of your executable trade action, a margin account and minimum holdings of $25,000 are required by the SEC rules.
To sign up for our free trading tips, alerts, and webinars...click. 

CMG Daily NeverLossTrading Top-Line Chart on January 6, 2017 (signal on Jan. 5)
cmg-daily-signal
Now you scale down to a 20-minute chart and you execute your trade on the lower time-frame, accepting a lower risk.
Let us jointly see where the trade ended. In our case, we exited the position at bar number five of the same blue candle color sequence: At $399.80 and produce a gain of $7.13, at an initial risk of $2.58.
In retrospect, you were trading with a 2.8:1 reward/risk-ratio.
Where does this lead to, if you constantly be able to trade at high probability trade setups with a positive reward/risk ratio?
You are trading with an edge, because you let the chart tell, when to buy and sell!
Let us zoom into the trade on a 20-minute chart:
CMG 20-Minute NeverLossTrading Top-Line Chart on January 6, 2017
CMG 20-Min January 6, 2017.png
Trading like this without the NLT software on hand is kind of difficult: You see how the NLT-lines and entry indicators help a trader to specify the decisions right on the chart, with clear cut entries, exits, and stops.
We are offering multiple systems, take a look at our program offering…click.
The examples shared in this publication are from our elite program: NLT Top-Line. Allowing you a more budget entry into the world of high probability trading, we are currently offering a slightly scaled down version: NLT Top-Line Light (ask for the details).
Make a difference to your trading and experience in a live demonstration how our programs work: Call +1 866 455 4520 or contact@NeverLossTrading.com
To demonstrate that CMG is not a single occurrence, AMZN had a buy signal for January 6, 2017: Buy> $780.40. Trading this occurrence from a 20-minute chart gave you a low risk entry: $1.92 risk, for a reward of $15.10: Trading NLT Light Tower to NLT Light Tower (one of our strong algorithmic chart setups); giving you a potential reward to risk of 7.8:1.
Where this leads to, explains itself; in particular when you combine the happening with high probability setups: You are trading with the odds in your favor.
Take a look at the AMZN 20-Minute-Chart and look for the price-entry and exit line. We also highlighted candle-#5 as a potential exit, while you were able to trail the stop to the next NLT Light Tower and take the exit at the blue-dashed line: Closing of the second NLT Light Tower in the sequence (NLT Light Towers are highlighted by a cyan dot).
AMZN 20-Minute NeverLossTrading Top-Line Chart on January 6, 2017
amzn-20-minutes-january-20-2016
By teaching one-on-one, time and spaces are limited, so do not miss out:
Call +1 866 455 4520 or contact@NeverLossTrading.com
We are looking forward to hearing back from you.
Best regards,
Thomas