
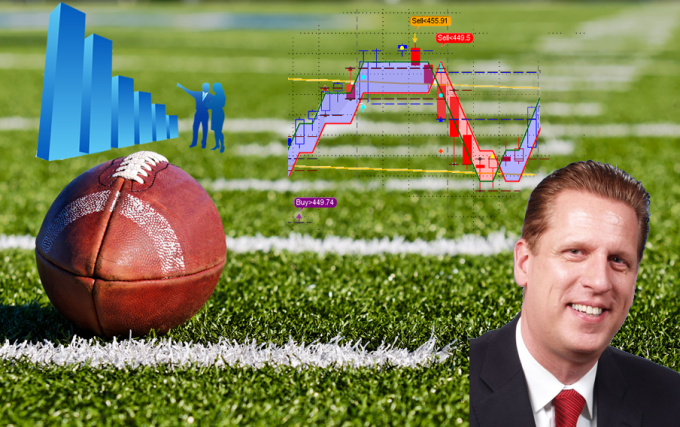
Are you trading at price turning points?
We provide you with systematic, software, strategies, a business plan (financial- and action plan), coaching, documentation; in recorded one-on-one training session, helping you in developing yourself into the trader you want to be.
Our trading systems provide you with systematic repetitive entries, exits, and stops; then you can act like a sport’s pro: lining up, getting to your position, catch, and touchdown.
What you want and need to be a successful trader has to be learned, practiced, and coached.
We are teaching one-on-one, showing you how to follow the activity of institutional investors with multiple systems for all asset classes: Stocks, Options, Futures, FOREX.
Let the chart tell when to buy or sell; however, you always remain the chief commander, who is in charge of the final decisions:
Computers are faster, humans are smarter.
In our mentorships you will learn how to combine both virtues into powerful acting.
Let us check for a few recent examples:
BK Daily NLT Top-Line Chart, 10-7-2016 to 11-25-2016

Table-1: BK October and November 2016 Trading Results
| Signal | Reach | Target | Result |
| Red Sell>39.79 | Target dot or 5-bars | Both targets reached | 1.3%-Return |
| Orange Buy>39.86 | 10-bars | Target reached | 9.6%-Return |
| Blue Buy>42.34 | Target dot or 5-bars | Both targets reached | 3.2%-Return |
| Blue Buy>44.04 | Target dot or 5-bars | Both targets reached | 7.7%-Return |
Add this up, compound your interest, and check and balance with your today’s results.
How do you know that this stock had such signal?
The NLT Top-Line user has two choices:
- Using the own market scanners, which are part of the NLT Top-Line Software.
- Subscribing to the NLT Stock Alerts: a daily market report with favorable signals.
Is the chart above an exception?
No: Institutional investors constantly move money in or out of an asset or asset class. Our programs, scanners, and indicators are programmed to detect institutional money moves in a pre-stage, allowing you to be part of the price move when it happens:
- With a pre-defined time in the trade.
- At a pre-defined exit- and stop level.
Surely, stops can be trailed if desired: You use the red line of the chart to do so.
All of this you will learn one-on-one at your best available time, with months of free alerts and coaching, giving you the feedback you need to start your career as a trader or investor.
If you want to read yourself into what is needed to the trader or investor you want to be, you will find an easy summary in our book: Your Trading Career as a Private Investor, available at Amazon.
Here another example, where you find key price turning points highlighted by the NLT Top-Line signals.
Take part of the touch downs and ask for a live demonstration:
Call +1 866 455 4520 or contact@NeverLossTrading.com
CMG, Daily NLT Top-Line Chart, 9-20-2016 to 11-25-2016
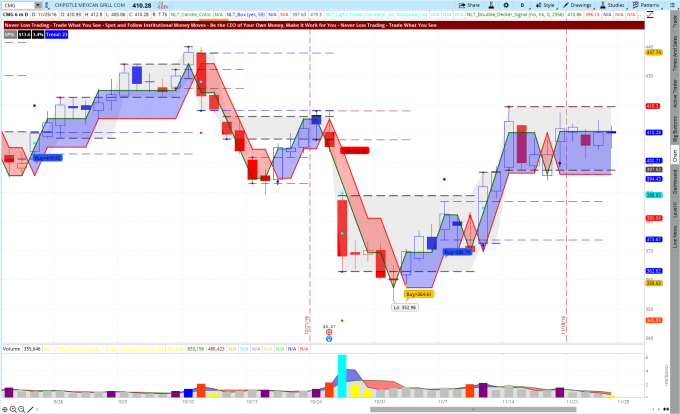
Does the system also work on lower time-frames?
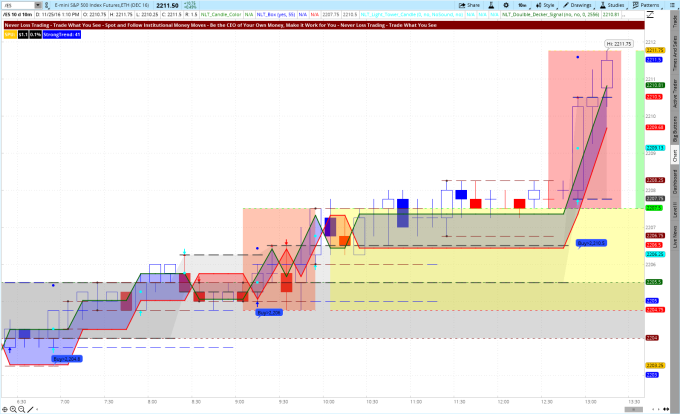
Absolutely: Let us display yesterday’s trading session: November 25, 2016 – Surely not an exciting day, a half-day session right after Thanksgiving.
However, there were three signals that called for a buy.
All of them got confirmed: The next candle ticked out the set price threshold. This allows you to operate with buy-stop or sell stop orders. Each of those trades ended to reach their target.
E-Mini S&P 500 Futures on a 10-Minute NLT Top-Line Chart
We offer multiple systems and you will find out in a personal session, which system or mentorship suites you best, please take a look at our offering…click.
Let us know what you are interested in and call +1 866 455 4520 or contact@NeverLossTrading.com for a personal demonstration.
By teaching one-on-one, spaces are limited, so do not miss out.
Good trading,
Thomas
