Spot and Trade Institutional Money Moves

Algorithmic Trading with Human Interaction for:

Day Traders, Swing Traders, Long-Term Investors

Friday, November 30, 2012

How To Identify Sideways Moving Markets In Advance


Looking at a chart, you always know in retrospect that prices moved sideways, but how to know in advance?

In the NeverLossTrading concept, we integrated a study, which measures changes in implied volatility and informs the trader by painting a "Purple Zone" on the chart,  indicating, that the price/volume development of a share has reached this critical stage of consolidation. Then, we either apply short term sideways strategies, or wait for the breakout signal, to trade along with the direction after the breakout.

In the “Purple Zone”, we find little directional movement with various counter price trend activities until a breakout to the up- or downside occurs. To support the visibility of such price development, we shade the price chart for the time-period purple and produce a very powerful indicator, signifying: 

-          Apply short term sideways strategies, with limited risk or do not to initiate trades when the Purple Zone continues, by not knowing when it ends and in which direction prices might breakout. 

-          Trend-trade when the Purple Zone is over, if the first candle outside the Purple Zone shows an arrow pointing to the trade direction:
o   Purple Arrow: To the upside
o   Purple Arrow: To the downside. 
GE Daily Chart


At times we get asked why the zone is purple? 

The answer is: It marks a time-zone of indecision where the market forces negotiate until an upside or downside price-move concludes the decision making process. The color purple is achieved by mixing red (down-color) and blue (up-color). 

For the beginning financial market investor, the best is not to trade in the “Purple Zone”, but right after, when a trend is established. 

More advanced traders gauge the price range in the zone and take trades already at the first break out. By being aware that even light-tower-candles that occur can quickly be reverted while the “Purple Zone Indicator” is present. 

If we are in a trade that enters a “Direction Change Zone”, we either exit the trade or adjust the range for the stop not to be taken out by radical price movements. If we are unwilling to accept additional risk and still want to stay in the trade, the stop line (red line) of the Double-Decker at entry into the “Purple Zone” builds the point where we put our stop. 

A directional arrow after the Purple Zone identifies a high probable trade entry.
If there is no arrow on the first candle after the Purple Zone, the study recommends not to enter into a directional trade. 

The best trade entry for a trend trade is two ticks above/below the trade proposal painted on the chart.  

The same functionality applies for Intra-Day-  and Swing-Trading Charts.  After our new software update, we are now allowing in the NLT-Purple-Zone-Indicator to put a computer generated price proposal at the end of the Purple Zone arrow:  

SPY Hourly Chart

The trade direction-pointing arrow after the Purple Zone now resides on the price level of the cloud and identifies the new price direction to trade.
The width of the cloud can be adjusted from the factory setting of 2 to a higher or lower level:
If the level is set to zero, the Purple Zone Cloud disappears.
If it is set to 1, it narrows the width of the cloud.
A setting above 2 widens the cloud setting.
Further: The alert sound and the end of Purple Zone alert can be set to individual preferences.
Additional Switch Functions: 

-          If you want the computer generated trade proposal, set the switch on “Yes”.
-          To receive a sound alert, when the End-of-Purple-Zone -Indicator is triggered, put the switch on “Yes”. 

The  “Purple Zone Indicator” is an integral part of our software package. See, how you can integrate it in your trading. We offer four mentorship programs, geared to the need of the individual Investor: 

  1. NLT Top-Line, for the Independent investor, where we install real-time analysis software.
  2. NLT HF-Stock-Trading: For frequent traders, able to trade the markets every day.
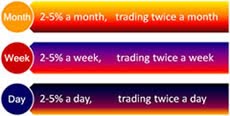
  3. NLT Wealth Building: If you are trading two times a week/month.
  4. NLT Income Generating: For day-trading futures and options.


Schedule for a private consultation: contact@NeverLossTrading.com

Tuesday, November 27, 2012

High Frequency Stock and Futures Trading (HFT)


Our latest edition to the NeverLossTrading concept family is the HF-Concept. It offers:

  • Frequent trades on key reference time- and tick charts.
  • Clearly defined entries and exits. 
  • Human interaction (not automated).

The indicator family applies measures and proposes trade entries based on:

  • Momentum changes: Short-term price movement, trend in the trend. Dark-Green-Signal.
  • Volume differential changes: Following institutional money flow: Light-Green-Signal. 
  • Trend positioning and price composition reversal potentials. Pink-Signal. 
  • Price Breakout after consolidation: Purple-Signal. 


Today, we tested the NLT HF-Trading-System based on the input of a Linkedin-Group, where we asked for securities with proposed time and tick relations to test our indicators on. The focus of the indicator-test is on the Momentum Change and Volume Differential, the other indicators we leave aside: Pink signals (reversal opportunities) do not show on the chart. 

AMZN (Amazon): 1-Hour chart


The hourly chart for AMZN provided highest probability trading:

  • 13 trades, 13 gains.
  • The average entry to exit price move calculated: $2. 
  • Applying the NLT Delta-Force option trading concept, this trade provided an average return on capital of 30% per trade, which is an outstanding result, quadrupling the risk capital in 5-days.

Russell 2000 Futures on a 233-Tick Chart

Actually, the Russell 2000 and trading tick-charts is not where we have the most expertise. By the request of a trader, we simulated the 233-tick chart and indeed it provided high probable entries and exits.
To not overcrowd the chart, we display the afternoon session of November 27, 2012.

  • The light-green and dark-green indicator provided 11 trades: 
  • Nine trades with an average gain of $60/contract =          $540
  • Two trades with an average loss of $90/contract =           $180
  • A net positive result of                                                     $360 in 2 hours.

We simulated a 333 tick chart and still had a positive outcome of 8 gains and 4 losses. 

Hence, the trader who proposed the 233-tick chart gave us a higher probability tick-reference to trade on. 

The chart below shows the morning session. In Purple framed zones, we do not trade.

If you want to learn how to trade like this: contact@NeverLossTrading.com

Thursday, November 22, 2012

1 New Volume Differential Indicator for Stock and Futures Trading


Institutions try to hide their market actions by using robotic traders, placing orders in small increments, however, by the sheer volume of their investments you can spot their actions on the volume graph our software puts on your screen. In our latest project, we developed an indicator, which takes the volume differential as basis for trade entry. 

The way our new indicator works: 

When the gradient (slope) of the Indicator changes direction, the high and low of the referring candle is marked and a directional trade proposal is generated: 

Buy-Target; and Sell-Target; signals occur, spelling out a minimum calculated price threshold. 

The trade entry will only occur, when the price threshold is surpassed by the candle following the candles associated with the volume gradient price move. 

The target for the trade is 1/2-SPU  (SPU is the calculated price-movement per observed time unit). 

To integrate power users in the development and test of our new indicator, we posted It at the Linkedin group: "Algorithmic Trading for Real Traders", and ran the indicator on SPY (ETF of the S&P 500 Index) between November 7th  to November 21st , 2012. A 1-hour chart was chosen as key reference time-frame for SPY.  

SPY 1-Hour Chart NLT Volume-Differential-Indicator (click the chart to magnify)
Summary:
The new NLT Volume Differential Indicator produced between November 7th and 21st

  • 10 trades with the expected gain of ½-SPU.
  • 1 failure.
  • 2 trades, which did not get initiated by not fulfilling the minimum threshold.

By the trading method, we teach to trade SPY, you will learn to pick specific options suited for day trading. The goal is to achieve an return of about 10 cents on a 50 cent investment per share controlled. 

When approved by positive forward and back testing, this indicator will be integrated into the NLF HF-Trading Concept. http://www.neverlosstrading.com/HF_Trading.html

Let us know your input or schedule for a private demonstration. 


Find a 25 minute introduction to NeverLossTrading at: 

Friday, November 16, 2012

Spot the Footprint of Money on the Stock Chart


Institutional investors dominate more than 85% of the financial markets. 

However and how hard they try to hide their orders, private investors can easily spot them: 

  • Algorithmic trading is a key word, which signifies the majority of today’s market interactions.

 How do we as private investors cope with this?

  • Easy: “However Institutions place their orders; the Differential of Volume (orders exchanged per time unit) shows their actions on our charts, for us to trade along with”. 

 Hence, we do not battle or worry that most institutions have superior trading technology; we take advantage of making their action visible on our charts. 

Attached a link to simple video, of successfully trading along with institutional price moves: 


The video shows how to trade Crude Oil futures on the two-minute chart, while the NeverLossTrading Indicators work on every time frame. Below a daily chart for MSFT.

This is what the chart shows and how we trade along with it:

  • The orange box frames the volume-change initiated price range. When the price breaks out of the box, this is the direction we trade. 
  • We color the candles by a specific algorithm and use them for trend trading: If the high/low of the second opposite colored candle is taken out by the following candle, it provides a trade entry or the trailing stop level on a longer trend trade. 
  • The lines on the chart show key price accumulation levels (support and resistance). 
  • The lower study shows the average and expected price move per time unit (here one day) and builds the first trading target. 
  • Stop-levels are either in the middle of the box or at outside the bottom or top of the box. 
  • The blue skyline looking bottom of the price chart shows the actual daily volume. 
  • We teach multiple trading strategies with options to harvest along the price movement of the observed stock and developed a market scanner, which give us daily stocks, setting up for a volume based price move.

Here another example: Trading AAPL (Apple Computer) with NLT Indicators

The shown concept explains the key principles of NeverLossTrading. In our mentorships, we align multiple indicators for high probability trading with stocks, commodities, treasuries, currencies and their derivatives. 

Check out our offering at http://NeverLossTrading.com

Schedule for a private demonstration: contact@NeverLossTrading.com
 
We are looking forward hearing from you. 

NeverLossTrading