Spot and Trade Institutional Money Moves

Algorithmic Trading with Human Interaction for:

Day Traders, Swing Traders, Long-Term Investors

Monday, October 31, 2016

Your Every Day Trading Election

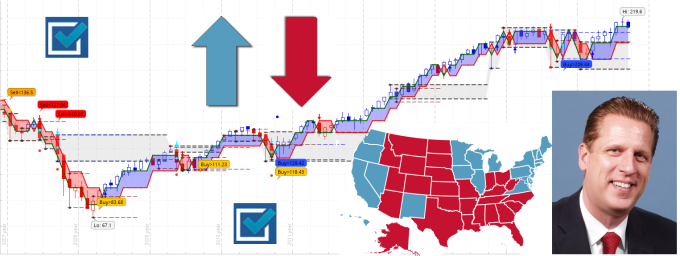
Soon, America is voting for a new president. Who is going to be the winner?
To predict the outcome, break down the swing states and add up the electoral votes of the others: Build and algorithm around the poles for the states that matter: then you have a good chance of hitting the right result; however, this is betting on a 50:50 chance.
When it comes to the financial markets, you trade within volatility and the odds of winning are not equally distributed; hence, you are in need for systematic approach that is helping you to find more good than bad trades.
prediciton-and-election
When you do not risk more than you cash-in and you produce more good than bad trades, you are in for making money trading or investing.
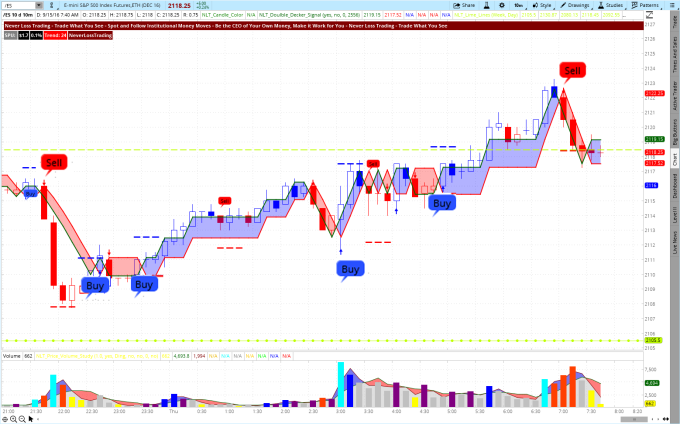
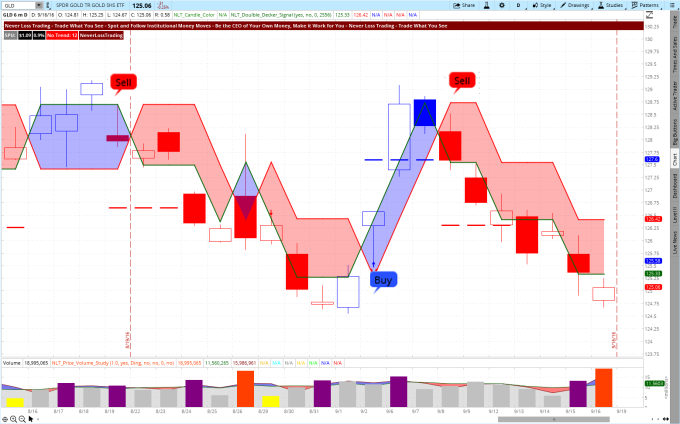
How do you know where prices will go?
You are predicting with algorithms that follow the natural model of the markets.
What is the natural model: Supply and demand decides for the price: Demand goes up, prices rise; supply increases, prices drop.
Easy, isn’t it?
However, if you want to learn how the markets really work, join our FREE feature presentation:
at the Traders World Online Expo #18….click.
If you want to experience how NeverLossTrading and TradeColors.com work live:
Call +1 866 455 4520 or contact@NeverLossTrading.com
We are teaching one-on-one, focusing on your wants and needs as a trader or investor: highly efficient, totally focused.
We are open for new students; spots are limited…check our program offering.
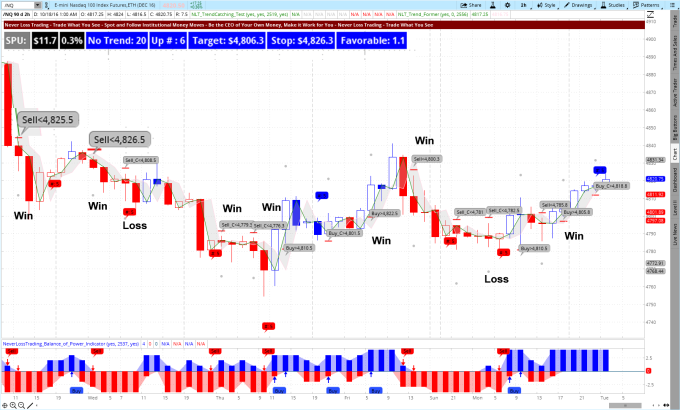
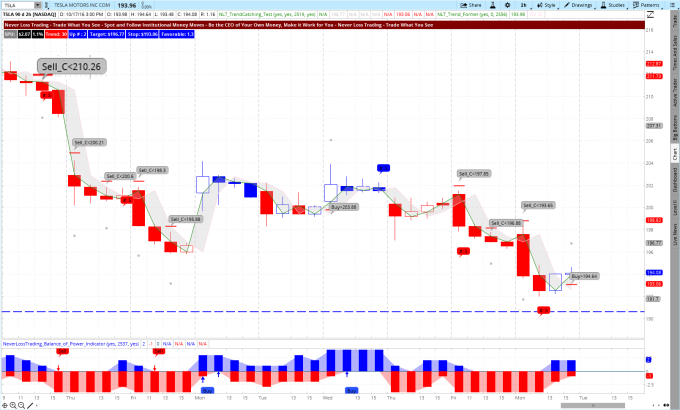
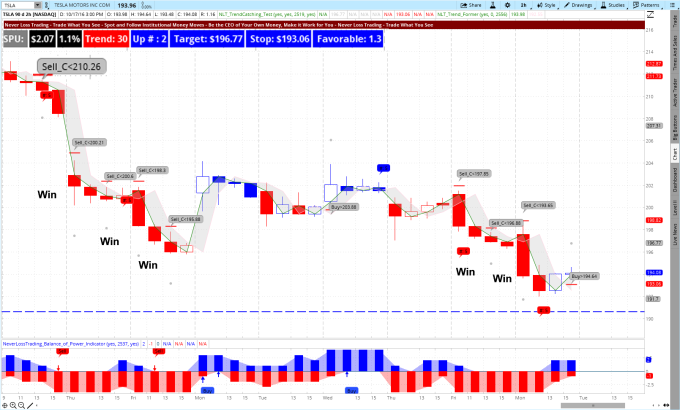
Challenge us if you want to be part of this: Call the symbols and times and count with us good and bad trades to strike a balance and decide if this is right for you.
If you are not already part of our Free Trading Tips, Reports, and Webinars…sing up.
We are looking forward building you up to the trader or investor you want to be,
Thomas

Tuesday, October 18, 2016

The Power of Trading the Right Hour

Based on history, the number twelve has a high importance in human life; however, in the last two centuries we started to focus on the decimal systems and consider that everything works 24/7.
Watch the video…click or read on:
clock-with-trendcatching-chart-and-tb
When you cut your trading day into two hour increments, you divide the day into 12 trading opportunities for six days of trading.
Why six trading days?
The futures and FOREX markets open Sunday and close Friday.
Let us show you a couple of examples how this looks on a chart and later explain why the 2-hour time frame is powerful for you (has to do with signal to noise).
NASDAQ E-Mini Futures on a 2-Hour NLT Trend Catching Chart
nasdaq-futures-trend-catching
The above chart shows 10-trading opportunities in four days, seven winners (70%) and three losses (30%) by just following the signal mechanically: Certainly high probability trading; however, we also teach in our mentorship how to appraise trades situations individually, risking more when the odds are in you favor and allow ourselves to not trade if this is not the case.
In the left upper corner of the chart you see SPU: our measure that defines bar by bar how far a price move most likely reaches after institutional engagement is found. The expected price move distance is marked by a gray dot on the chart.
Further you are getting an indication if you are in a trending environment: blue for up, red for down. To help you entering your bracket order, a target and stop point are expressed bar by bar, with an appraisal of the reward to risk ratio:
Our NeverLossTrading dashboard to simplify your actions.
The bottom study: NLT Balance of Power shows you if Buyers dominate (blue) or Sellers (red), spelling out additional trading opportunities with buy and sell bubbles, that are either confirming the upper chart signals or producing own directional price indications.
Instead of trying to catch the entire price move from the beginning to the end, the NLT Trend Catching system supports you by dissecting trends into price increments, so you can trade multiple times in a directional price move.
How does this work with stocks?
TSLA on a 2-Hour NLT Trend Catching Chart: October 5 – 17
tsla-trend-catchin-october-2016-1
On October 5th, late in the day, we receive a short signal and we are catching a very nice move to the downside, producing a $8 price move. Then we further participate on the second wave of the price breakdown with a signal on October 7th, 2016. In the days of October 10 – 13, we receive no signal confirmation and no trade, to then be active again on October 14th and 17th, to harvest on the breakdown. In total, we are producing five winners out of five potential trades in total a price move of about $18 in nine days:
A 9% return on cash, an 18% return on margin and humongous return on Option trading capital if you follow our specifically developed option trading program.
TSLA on a 2-Hour NLT Trend Catching Chart: October 5 – 17
tsla-trend-catchin-october-2016-2
 If you like to be part of this, ask for our Election Special on NLT Trend Catching.
Call +1 866 455 4520 or contact@NeverLossTrading.com
By teaching one-on-one, focusing on your specific wants and needs, spots are limited, so do not miss out.
Good trading,
Thomas

Thursday, October 6, 2016

Limit Your Risk and Achieve Steady Results in Trading

If trading was easy, nobody would ever go to work.
However, it can be learned when you are willing to follow clear cut success principles.
Read in the following how you can limit your risk and strive for steady results with an activity based trading system that helps you to spot and follow institutional money moves:
As a trader or investor, you are striving to achieve above market returns on your investments, else you could just hand over the responsibility and action to somebody else: Your broker e.g.
However, it looks like you decided to control your own financial destiny and we congratulate you for this decision:
If you don’t care about your own money, nobody else will.
With whatever instrument you choose to base your trading or investing decisions on, you are making an assumption for the potential outcome, while what you control the most, is the risk you are accepting per trade.
How to gauge the risk and thus achieve better results?
Assets have a natural volatility price development, which you better consider when trading directional. We help you as a trader to know where to act with your initial stop and how to potentially trail the stop on a price move: the red line on the chart signifies the stop level. It is on the bottom of the blue frame price development and on the top of a red framed price development.
NLT Income Generating Chart for /ES 10 Minutes on September 15, 2016
incomegenerator-es-september-15-pre-market
Directional entry points are highlighted through a Buy or Sell signal. By following our system, you only trade when the high of a buy signal or low of a sell signal is surpassed in the price development of the next candle. This way, you assure that other traders or investors follow through on the new price direction found.
The target for the trade is highlighted by a red line and thus allows you to predefine your exit; however, you can also trail your exit with the red line of the blue- or red frames of the price move.
If you followed the system in the chart above, you produced five winning trades in the observed overnight session for the E-Mini S&P 500 futures.
Trade What You See: Let the chart tell, when to buy or sell.
NLT Daily Wealth Building Chart for GLD, August 15 to September 16, 2016
gld-income-generting-daily-chart
The chart for GLD (Gold ETF) shows you three solid entries that came to target. At the buy signal, the price quickly jumped up and you will learn in our mentorship how to best act on such situation.
Imagine you learned how to trade those signals with stock options, limiting your risk in the trade and leveraging your potential outcome. In the highlighted trade situations, you were striving for an average of a 75% return on investment, investing less than 1% of the share price for trading options.
You learn all this in our mentorships:
Ask us for our election special for NLT Wealth Building and Income Generating,
By teaching one-on-one, capacities are limited, so do not miss out.
If you feel this is for you, ask for a live demonstration:
Call +1 866 455 4520 or contact@NeverLossTrading.com
In case you are not yet signed up for our FREE Trading Tips, Reports, and Webinars... click. 
We are looking forward to hearing back from you.