Summary: Price is the result of a change in supply or demand. The crowd follows the leaders and creates repeating price patterns you can spot and follow. We share some insight in this article that will change your approach to trading.
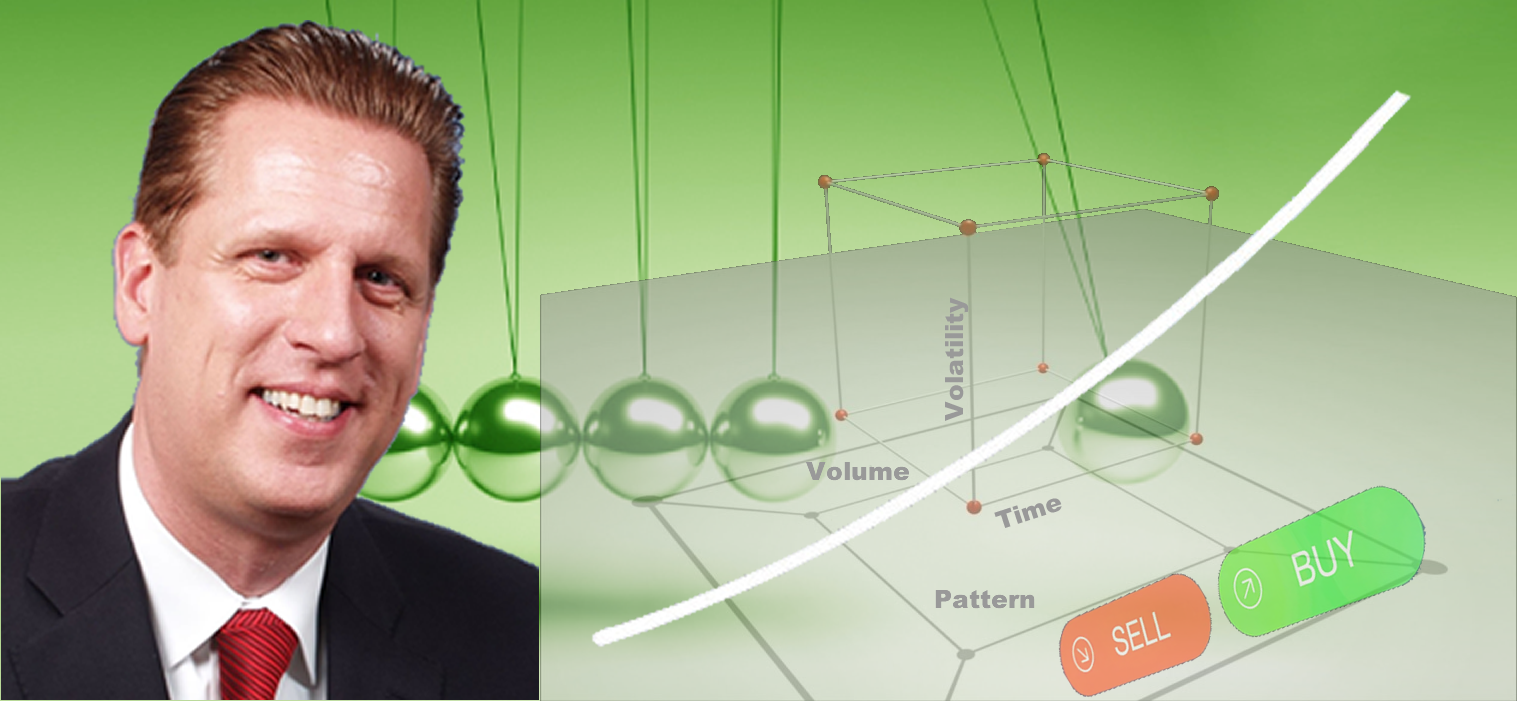
When the price is the result of the interaction between buyers and sellers, we have four dimensions of measuring the happening:
- Frequency of Change or Statistical Volatility
- Number of transactions or Volume
- Price Development over Time or Timeless
- Peaks and Valleys as Overall Patterns
The theory of Benoît Mandelbrot gave us a headway to consider trading decisions that are time-based and timeless (purely price-based). Let us share how we translated this different way of plotting a happening into finding trades at crucial price turning points and in continuation patterns.
Base Theory
A repeating calculation is performed based on the behavior of using the happening of now as starting values in a repeating, or iterating calculation. The result of each iteration is used as the starting values for the next. The values are checked during each iteration to see whether they have reached a critical “trade” condition, or “bailout”. If a trade condition is reached, the calculation is stopped, and a potential signal is drawn on the chart, spelling out the next potential value to be reached and the statistical volatility to get to the examined target value without getting stopped on a high likelihood.
Four dimensions are hard to draw, however, we hope we found a good graphical expression in the feature picture of this article.
Natural Model
Collective behavior creates cycles that repeat themselves; however, they are not repetitive in their frequency or rate of change, and this is where most mathematical models fail by assuming a constant phase of repetitiveness, while the re-shuffling phase in actuality is random; however, it is forecastable by using the theory explained above. Considering the history and going back to the school of Pythagoras (570 BC –490 BC) thoroughly: everything in nature is connected. The movement of one thing generates harmonic associations with all other things in the system. The key to revealing the truth behind these natural associations is observation and mathematics. The Natural associations of price change create patterns: “The pattern is said to emerge as a result of discontinuities in the perpetual processes of price expansion and contraction of the observed asset. According to this, human behavior is not random and creates predictable reactions in the whole market: collective human behavior forms a specific repeating pattern that unfolds through time or in the price action. Group behavior creates a distinct trading pattern, and by letting a computer algorithm with an AI component calculate where the pattern appears next, you can make high probability forecasts regarding when a price movement is starting and where it is heading.
To be able to let our models provide a highly accurate forecast, we consider the following:
- We only trade active markets and assets. An active market means a liquid market where the bid/ask spreads are tight, making entry and exit easy. In addition, it is more difficult to manipulate an active market, which means forecasting becomes more reliable. Hence we developed a solid set of assets we categorize for our subscribers in the area of Stocks and their options tradability, Futures, and FOREX.
- Trade along with rising and falling patterns, and we share those in our mentorships with you, helping you to experience the market from a totally new perspective.
- Trading at solid opportunities only, avoid highly frequent trading that lets you accept mediocre opportunities. In addition, a great number of trades increases transaction costs.
- Limit your risk by not allocating more than 5% of your trading capital to a single position.
- Hold your trades to target and do not second guess your system: hardcode entry, exit, and stop decisions.
- Journal your trades to create a scorecard, telling you what worked and what did not.
You will find more details in further articles we published on our blog. Following these principles, you will act as follows with NeverLossTrading:
- You only act on confirmed signals when other market participants confirm the direction spelled out by the system. For example, our systems spell out a critical buy- or sell price, and you enter a position when the price threshold is surpassed in the price movement of the next candle.
- At entry, the system defines a target price to close the transaction: Dot on the chart.
- The stop is also defined at entry and gives the price an adequate wiggle-room to proceed to target with a high likelihood: Red Crossbar or line on the chart.
First, let us choose a time-based example: Jeff is a stock trader who waits for the right moment and then acts. He understands that the current environment is best for shorter-term-oriented trades (holding for a couple of days). Jeff combines NLT Top-Line and HF signals, works from an IRA, and buys puts according to the NLT Delta Force Options Trading Concept when going short and goes long through buying stocks. He liked our recent article: “The Trader Who Waits,” and responded: In his last 12 trades, he won 10 (high probability). Jeff has been a NeverLossTrading client since 2014, he does his own market analysis with the help of the NLT Top Line Scanners and the NLT Watch List Indicators, and we are in frequent contact.
Here are three examples of trades he conducted, and you will understand why we say: Trade what you see, let the chart tell when to buy or sell:
Daily NLT Top-Line Chart for UNH
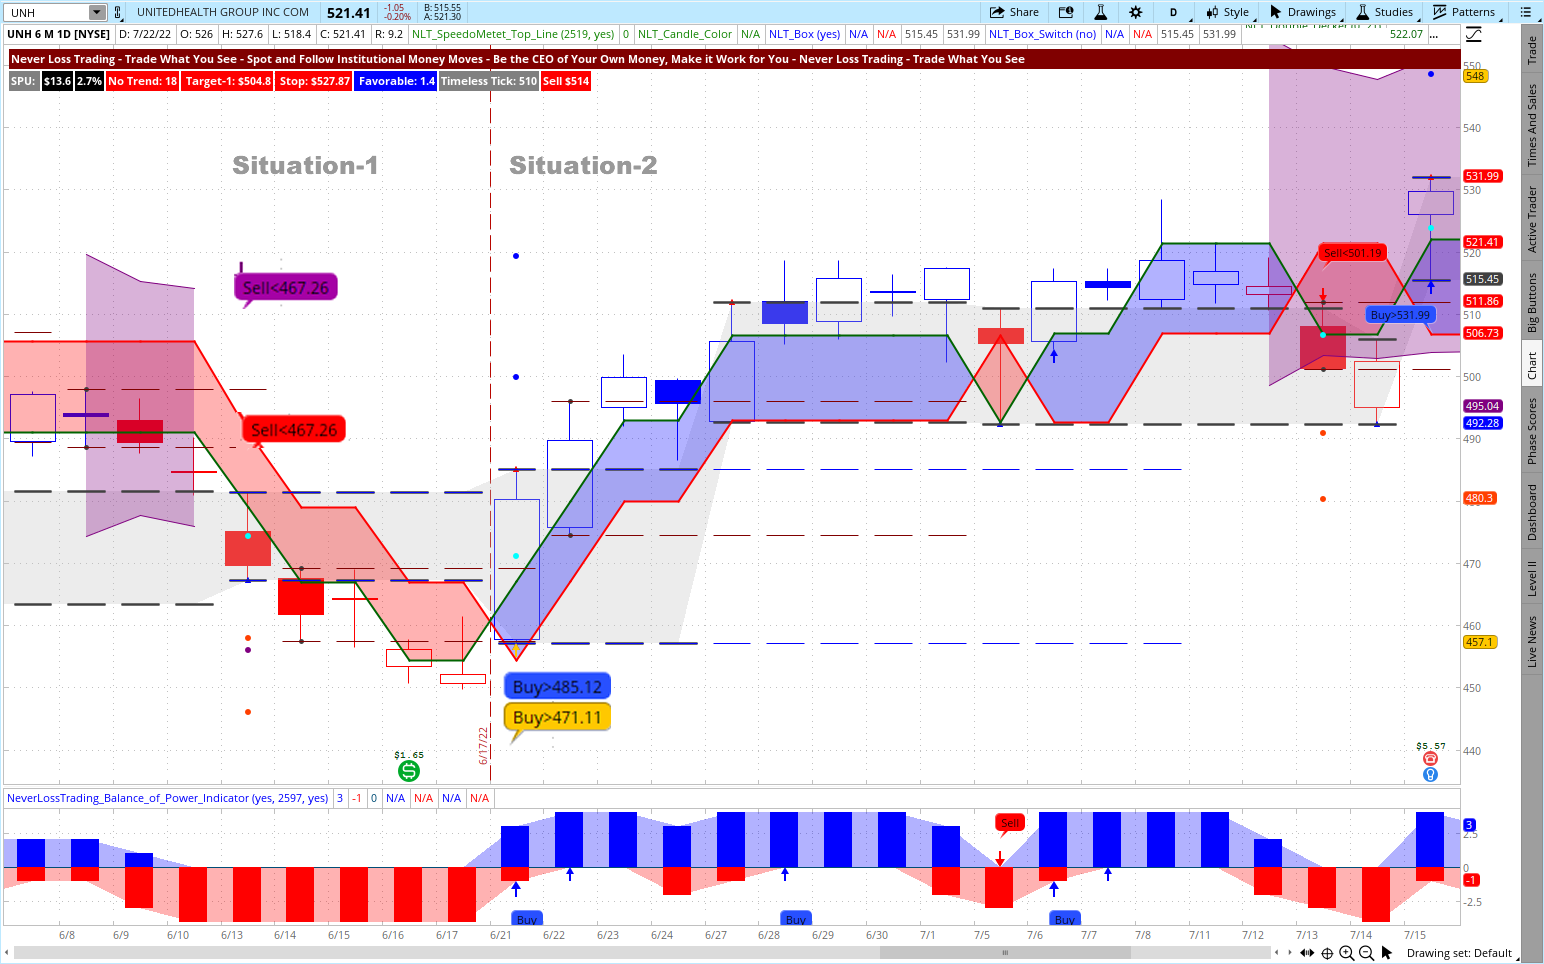
Situation-1: UNH combined two NLT Sell signals: Sell < $467.26. The purple signal identified a price move potential after a time of directional price ambiguity (NLT Purple Zone). The red signal is an NLT Power Tower signal. The power tower stands tall and points in a direction. The exit was at the purple dot on the chart. The signal combination came on June 13, 2022, and came to target on June 16, 2022.
Situation-2: On June 21, a strong signal combination announced a 2-SPU price move potential, and the trade came to target on June 28, 2022
Daily NLT Top-Line Chart for COST

Situation-1: On June 21, the COST chart shows an NLT Top-Line buy signal: Buy > $464.82, and the trade came to target on June 24, 2022.
Situation-2: On July 14, 2022, COST had an NLT Top-Line signal again: Buy > $513.27, and the trade came to target on July 18, 2022.
Daily NLT Top-Line Chart for MCK

On June 21, MCK combined two NLT Top-Line signals: blue and orange. The orange signal helps us find tops or bottoms and announces a 2-SPU price move potential carried out to target-2 on the chart and reached by June 27, 2022.
Jeff understands that individual stock price moves are either overall market correlated, like go with the S&P 500, or happen uncorrelated (unique stock price move). He prefers unique and uncorrelated stock price moves and finds the setups with the help of the NeverLossTrading Top-Line Scanners on his own created list of stocks that represent strong stocks in market sectors of demand.
Next, we pick a day trading example and a timeless chart where candles construct purely price-based. On the charts, we combine NLT Top-Line, NLT Trend Catching and NLT Timeless Indications, demonstrating how to find high probability setups by combining signal indications: multiple system indicators validate a high probability setup. We pick a swing trading chart first, where the average holding time of a position is about one to five days.
The timeless chart setup relates risk to reward in an acceptable ratio, producing arrangements complying with the system probability for a positive statistical expectation value.
We operate pure mechanical with buy-stop and sell-stop orders, where trades only get validated with the entry price threshold being surpassed in the next candle; stop, and exit is system-defined at entry. We take an entry signal when the following happens:
- The frame around the price movement changes from blue to red or red to blue.
- An NLT signal occurs at the crucial momentum change and spells out buy> or sell<, and the price movement of the next candle validates this by surpassing the set price threshold.
NLT Timeless Chart for /ES, July 13 to 19, 2022
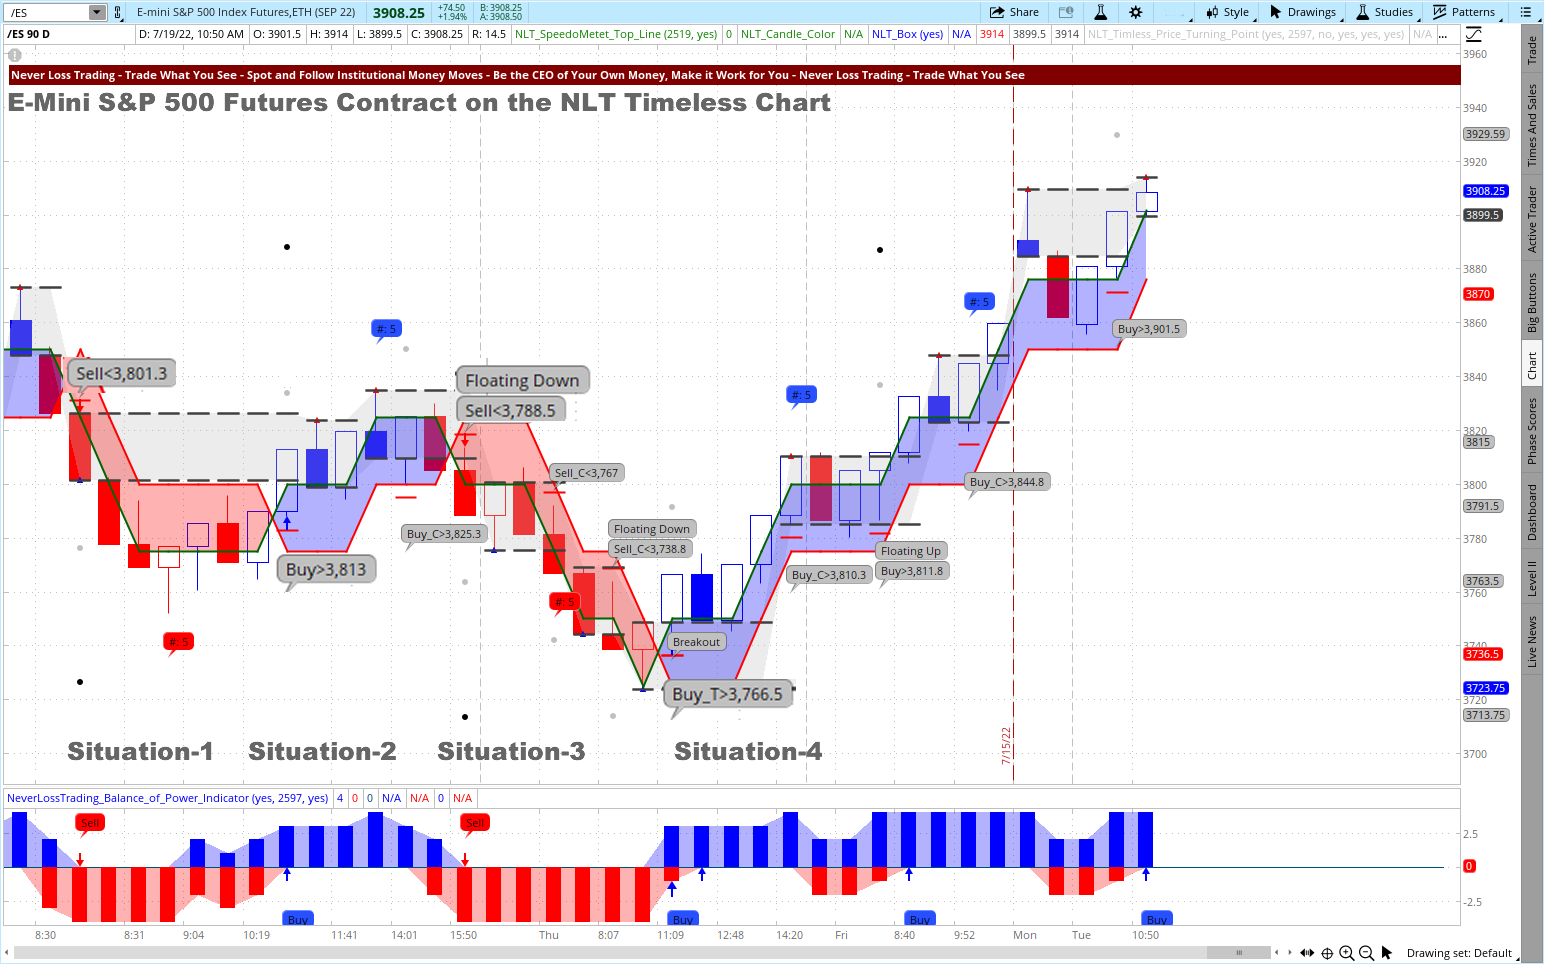
Each price situation on the chart is suitable for a 25-point price move or a value change of the underlying contract of $1,250.
The red crossbar on the signal specifies the stop level, and if you are trend trading instead of trading for a momentum price move, the red line of the frame around the price move (NLT Double Decker) specifies the trailing stop.
In the shared chart, all signals came to target; however, we assume a system probability at or above 65% to forecast the future price movements.
There are additional signals on the chart that either help to take more trades or add to the target, which we neglect in this example.
We apply purely mechanical rules while you learn how to qualify higher and lower probability setups in our mentorship.
Situation-1: Sell < $3801,30, July 13, at 8:30 a.m. The signal was validated in the price movement of the next candle, and the trade came to target the same day.
Situation-2: Buy > $3813, July 13, at 10.31 a.m.: A validated signal reached its target between 12:51 p.m. and 1:31 p.m.
Situation-3: Sell < $3788.50, July 13, at 3:50 p.m., validated at the opening candle at 6 p.m., and the trade came to target between 4:38 a.m. and 8 a.m.
Situation-4: Buy > $3766.50, July 14 at the 11: 08 a.m. candle, validated and came to target the same day.
There are additional signals and opportunities to catch trades along the tend move, which we are happy to share in a demonstration with you (ask for our summer special):
contact@NeverLossTrading.com, Subj.: Demo
In the next step, we pick a day trading example where we are trading for about seven points or a price change of the underlying contract of $350. Again, we take trades purely mechanical, while you will learn in our mentorships how to qualify situations and trade at higher rather than lower likelihood situations
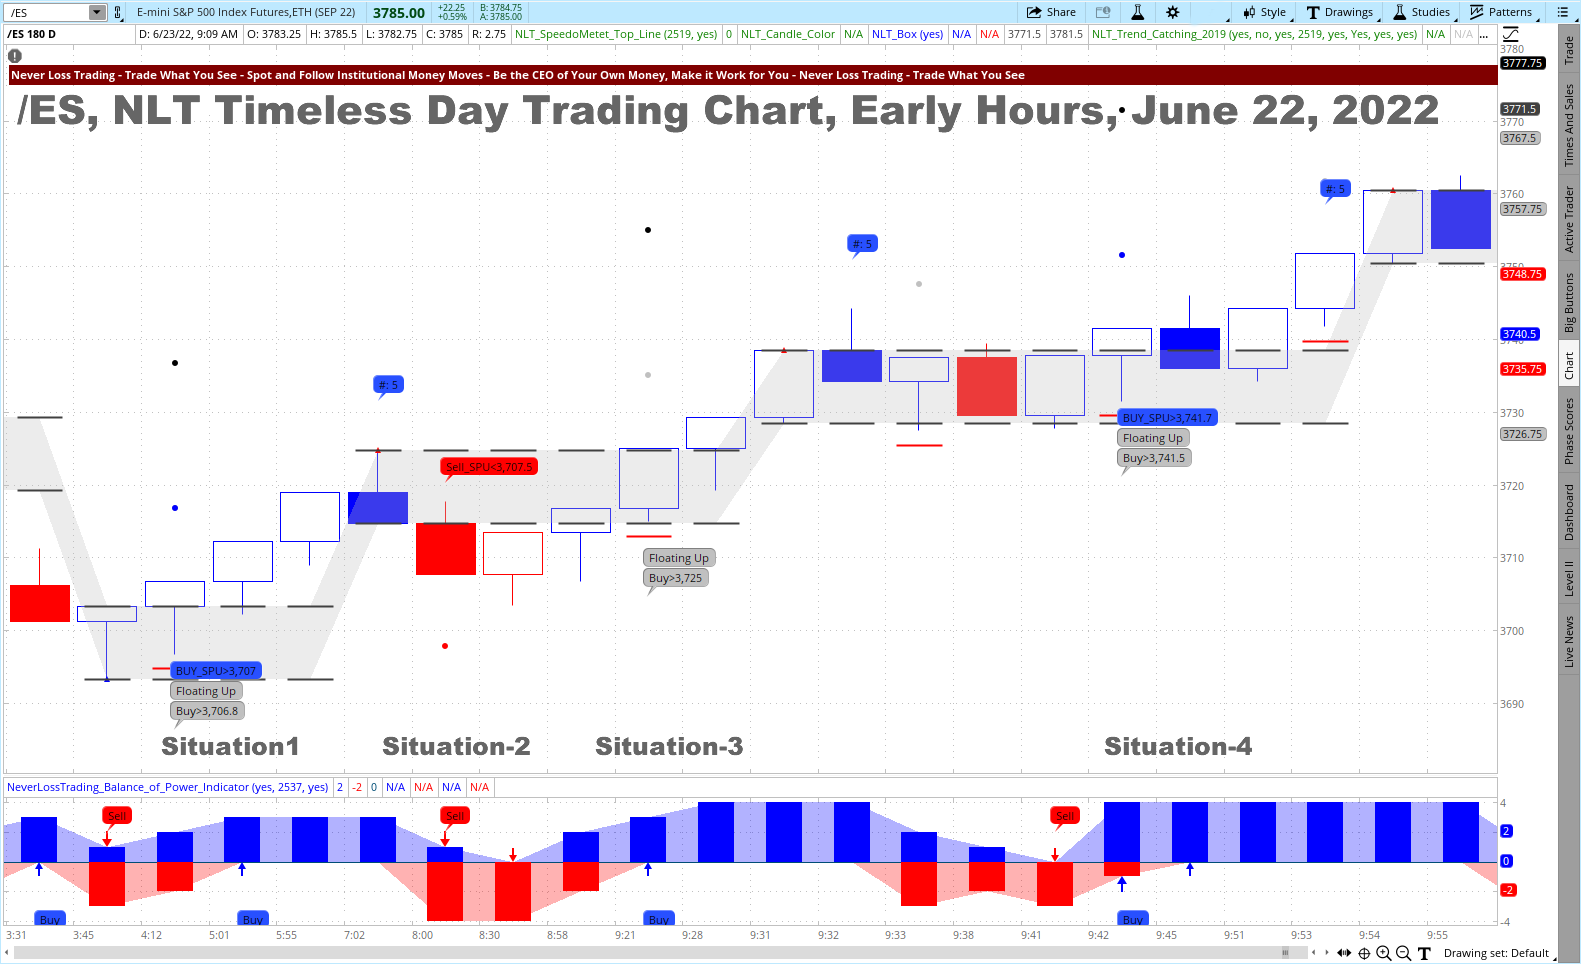
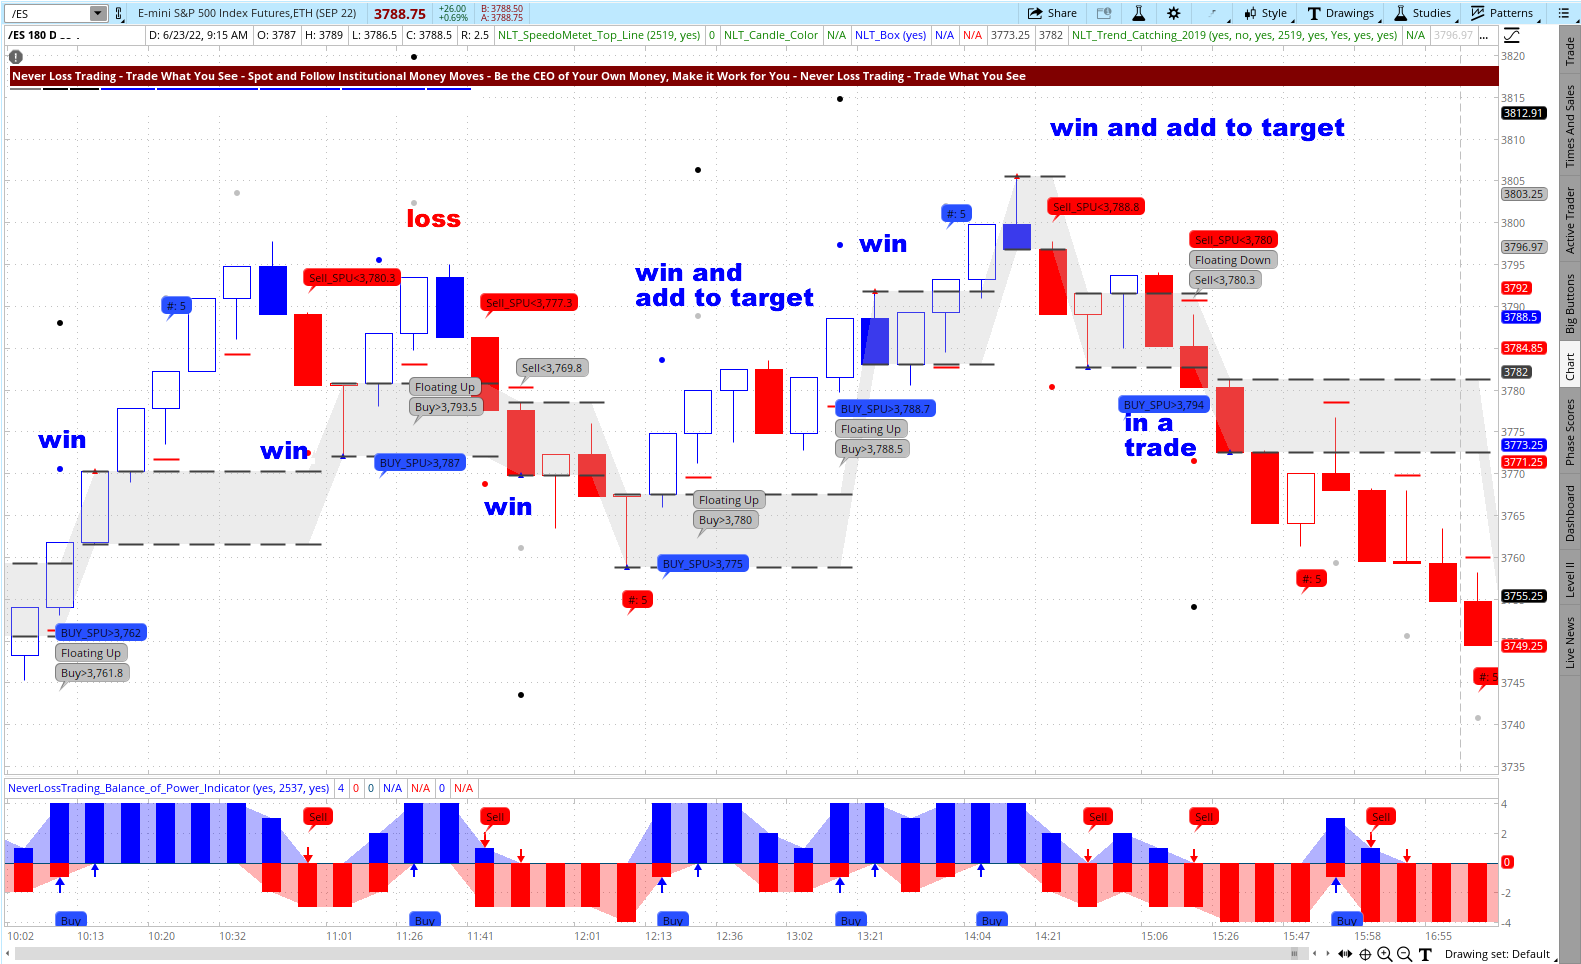
NLT Timeless Day Trading Chart for the /ES

Between 7 a.m. and 3 p.m. that day, nine potential trade situations were painted by the NLT Indicators on the chart: six winners and three losing trades: 67% probability.
Let us share an example of a day trader who combines systems and trades at crucial price turning points.
Steve focuses on trading the E-Mini S&P 500 Futures and the Crude Oil Futures Contract. His preferred trading time is 7 a.m. to noon. He was used to trading very short time-frames, acting on about eight to ten trade constellations per day, and was constantly monitoring and working with open positions. His success was random. We introduced him to the NLT Timeless Concept combined with NLT Trend Catching and NLT Top-Line to form his decisions. We kept his focus on trading those two futures contracts daily, where he had his experience (why bend an arm when the preferred asset to trade provides enough trading opportunities). Instead of monitoring each transaction, he now walks away and lets the trade come to target or, at times, stop (losing is part of winning). He, on average, conducts a maximum of two to four transactions per day and finishes his trading day around noon, winning 70% of his trades, journals, and controls. You find a specific article on measuring and controlling trading success on our blog.
His focus is on two signal combinations:
- NLT Buy, Sell with Floating, which reports when a price leaves a prior price containment area.
- NLT Buy_T, Sell_T, which indicates an early price turning point.
- He sets bracket orders two ticks above/below the set price threshold: Sell < $4203 will only lead to trade when the price reaches two ticks below; hence, he can operate with a sell-stop at $4202.50. If this price level is not reached in the price movement of the next candle, no trade will be initiated.
- A gray dot specifies the trade exit on the chart, the stop by a red crossbar. By using bracket orders, target and stop get established at order entry.
Our introductory offer to algorithmic trading is TradeColors.com. You trade when two same-color candles are painted on the chart, and the set price threshold is surpassed in the next candle on initiation moves, and sure there are also continuation patterns we follow.
TradeColors.com Day Trading Example

The chart shows 11 solid trading opportunities for trading the E-Mini S&P 500 Futures Contract on July 20, 2022, combining NLT Timeless and TradeColors.com.
When you like to start with TradeColors.com, ask for our summer special of adding NLT Timeless:
contact@NeverLossTrading.com, Subj.: TradeColors.com
We know and acknowledge that every trader is different. Hence, we tune our systems and teach to your specific wants and needs, supporting you to turn yourself into the trader or investor you want to be, teaching on-on-one at your best available days and times.
Let us share an overview of learning elements to take away from our training and coaching sessions, which vary based on the system you choose, from four to twenty hours of teaching.
Summary of learning elements:
- Acting with a system probability > 65%
- Mechanical rules for entry, exit, stop
- Trade at perfect moments only
- Consider overall factors, patterns
- Risk and reward in an acceptable balance
- Risk-averse trading
- Holding positions to target
- Do not add to losers
- Stick with a trading strategy. Follow a business plan – action plan and financial plan
- Trade for meaningful price moves
- Systematic trading
- Having a mentor to learn from
We also help you to journal your trades. Such a journal provides excellent feedback on how you are developing, and you find a perfect example in this article on our Blog: How to Control Your Trading Results
To succeed in trading, you best work with an experienced coach and learn much about trading. Our #1 competitive advantage is the support and customer service we offer. We work one-on-one with you to specify what we teach to your specific wants and needs; hence, if your knowledge base is not expanding rapidly, you are doing something wrong.
Ongoing education and mentoring are crucial to longevity in this business.
Veteran traders have been through more ups and downs than you can imagine. So whatever you’re going through, experienced pros have probably experienced it already.
If you are ready to learn, meet us in a one-on-one session where we find out which learning program suits you best:
contact@NeverLossTrading.com Subj: Demo.
We are ready to share our experiences and help you build your trading business. Trading is not a typical career, and you best learn from those who are long-term in this business to cope with the rollercoaster of the financial markets. We are here to help and provide feedback on what you might be doing right or wrong.
Strive for improved trading results, and we will find out which of our systems suits you best.
We are happy to hear back from you,
Thomas Barmann (inventor and founder of NeverLossTrading)
Disclaimer, Terms and Conditions, Privacy | Customer Support