
Stocks and other assets are changing hands daily, offering you the opportunity to participate at crucial price turning points.

The average holding period for stocks is constantly shrinking, based on data from the NYSE, and Europe is showing the same tendency.

However, for you as a private investor, this is good news: it offers more opportunities than threats; when you have the right mindset and a system that tells you where money flows: This allows you to beat the best fund managers.
Let us drill deeper by asking, who are the critical asset holders?
By category, we highlight the following key asset holders*:

*Data based on the research of Nobel Living, LLC
When considering that fund managers are operating by comparing their performance with the stock market indexes, you directly recognize who holds assets long-term and why.
On the other hand, Prop-Traders, act on a much shorter holding time and produce shorter-term exchanges of assets. They employ the best analysts and make the shift changes you can spot and follow as a retail trader when you have the proper instruments on hand. The fund managers follow prop-trader-initiated shift changes in the composition of an index. Hence, money flows in and out of assets daily and intraday, leaving a trace you can follow. Your significant advantage: you can open and close positions much faster than institutions can. By the magnitude of their holdings, they have to scale in and out, not radically changing the asset price.
Here is the price move model we follow, and it considers all we said above:
NeverLossTrading Price Move Model

Theory: Key asset holders will have a solid need to re-balance their inventories. Thus, at a particular price expansion, they will either float- or shorten supply, which will result in an opposite directional price move that will then take away from our profits. Knowing this, we pre-calculate how far the expected price move will reach, and there we take profit, assuming it will retrace or reverse after.
Hence, we let the market and institutions appraise the stocks price journey and latch on, entering and exiting positions faster than institutions can.
Our brand name derives from the concept of repairing a trade instead of accepting a stop loss; however, Never Stop Loss Trading was a bit lengthy.
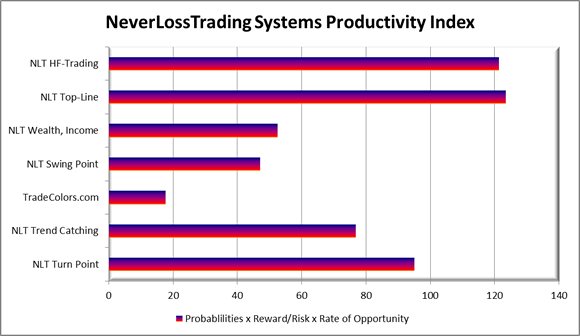
TradeColors.com is our introductory system to high probability trading. We always allow for upgrades; you only pay the difference if you start with TradeColors.com and upgrade after.
Many of our clients purchase more than one system: Our systems are productivity tools, and by combining them, you produce a higher participation rate and higher returns.
Our tool to calculate the expected price move is the SPU = Speed Unit, and it indicates how far a price move shall reach until it comes to an end.
With our systems, you can operate with conditional buy-stop and sell-stop OCO orders (one-cancels-the-other). Without the need to be in front of your computer for the orders to execute. You enter by price thresholds, ensuring that other market participants have the same directional assumption as you do and exit at the SPU target or adjust the trade at the stop.

By a change in the frequency and amplitude of the price movement over time, we specify indications to act on high probability price turning points, applying mechanical rules rather than leaving room for interpretation.
With the help of the NeverLossTrading indicators, we report changes in supply and demand and multiple levels, time-based and based on pre-defined price moves and report the happenings:
- On a monthly level,
- Weekly level,
- Daily,
- 4-Hour based,
We share the price thresholds: buy > or sell < through our alerts, or you can find them on your own with the help of system-related market scanners or watch list indicators.
We cover all asset classes: Stocks, Options, Futures, FOREX.
As a retail trader, you have multiple opportunities for:
- Day trading (opening and closing positions the same day)
- Swing trading (holding position for multiple days)
- Longer-term investing (holding positions for weeks and months)
You can act with a high probability price move model on key price turning points based on clearly defined risk-limiting strategies.
Never be late for a trade: NLT Alerts…click.
Our alerts spell out information on multi-levels, and we are happy to explain what they can do for you.
contact@NeverLossTrading.com Subj.: Alerts
Important will be that you can do a chart validation with the help of our systems.
Let us share some chart examples:
AAPL, Weekly NLT Trend Catching + Timeless Indicators

From left to right, you see the following:
- Buy > $132.55 with the word Floating above. This signal identifies a price breakout potential and is a new addition for subscribers to the NLT Timeless concept that also can be used on timeless charts, helping traders to find strong price move potentials. The trade came to target in two candles: gray dot on the chart.
- Buy C > $145.65, which is a continuation signal, identifying a potential re-entry into the developing price trend. By the AAPL earnings conference in the week of 7/26/2021, you had two choices: Either exiting the trade two days before the announcement (which is our typical behavior) or carrying the trade out based on: reconfirming signal, Buy > $149.44. We shared in a separate publication our rules of how we trade over earnings, and you can read the details on our blog.
- Sell T < $ 145.76 combined with a Floating Down signal are two new additions for NLT Timeless subscribers helping you to trade at key price turning points, here to the downside and the trade came to target in a matter of two candles.
We constantly develop our systems forward, which does not mean you need to upgrade. Still, you can add new opportunities to your existing charts and increase your accuracy and participation rate.
MCD, Daily Trend Catching Chart, June – Nov. 2021

From left to right, you see:
- Sell < $244.18 with a Floating Down indication. The direction was confirmed and came to target in the next candle.
- Sell T < $229.29. The signal was confirmed, and by our rules, we left the trade two days before the earnings announcement with a profit.
- Buy > $246.08 with a Floating Up indication, confirmed direction and target reached, two candles later.
- Buy C > $251.15. A trend continuation signal, reaching its target in two candles.
- Buy > $253.72. This signal was not confirmed in the price movement of the next candle, and no trade was conducted.
The chart shows, we follow clear-cut rules for entry, exit, risk/reward. The stop is indicated by a red crossbar, allowing you to condition buy-stop and sell-stop OCO (one cancels the other) orders, with no need for you to be in front of your computer at entry or exit.
Trading by one dimension works as follows:
- If the buy/sell threshold: Buy > or Sell < is fulfilled by 2% of an SPU leads to a trade entry
- Exit, when a 1-SPU price move is concluded (taken off the NLT Speedometer box on the top left of the NLT charts)
- Stop at the red crossbar on the trade initiation candle
- Buy-stop, sell stop orders with OCO bracket, executed from the active trader or trade ladder: 1-SPU-wide OCO order with adjusting the stop
- If you open and close more than three positions the same day in one week, pattern day trading with account holdings above $25,000 is required by SEC regulation
- Options trading the chart happening is taught on demand, and we specify with you: Strike price to choose, time to expiration, the maximum premium to pay and expected return at target
- Goal: More winning than losing trades and longer runs, so risk and reward are in a favorable balance
- Never enter a trade at the exit candle.
- Enter a trade two days before earnings and do not open a new position at the day after earnings.
- In case you trade this concept with an IRA, take long stock trading opportunities only and try to cover short opportunities through Put option trades (we teach you how in our mentorship programs).
- Mechanical rules will be shared when you sign up with the NeverLossTrading education program.
Those are not many to learn compared to traffic rules, and you sure know how to manage a vehicle in traffic.
After demonstrating some swing- and longer-term trading examples on stocks, let us lead to Futures trading.
If you are not considering futures trading by today, let us quickly give you in a short overview the advantages futures trading can provide you:

We hope this simple graphic explains why futures trading is essential as an investment vehicle. However, there is another dimension to it: You can protect your assets using futures contracts for overnight hedging, and we explain all this and more in our mentorships.
The E-Mini S&P 500 Contract is a forerunner of the S&P 500 index and trades around the clock six days a week. It is a leveraged product, and you only have to bring up a fraction of the margin to participate and trade the index. Let us show you a recent daily chart:
ES, NLT Daily Trend Catching Chart, Oct/Nov. 2021

From left to right:
- Sell < $4317.3, not confirmed in the price movement of the next candle, no trade.
- Floating Up, Buy > $4437.3, confirmed and came to target three candles after. By not entering at an exit candle, we neglect Buy C > $4517.5.
- Re-Entry at Floating Up, Buy C > $4543.3. Target reached three candles in the trade.
- Re-Entry at Floating Up, Buy C > $4603.5. Target reached after three candles in the trade.
- All other signals were not confirmed, and it is important to stay out of a trade when no direction price pressure carries the trade to target. Therefore, we aim to produce income or a return, not to trade the trade.
Combining NLT Timeless and Time-Based signals increases your participation rate and opportunity to invest for returns.
With the help of our systems, we help retail traders to decide at trade entry for the five significant challenges they face to prevent the common mistakes often made:
- Trade entry decisions (when to trade)
- Exit decisions (where to take profit)
- Stops (where to place them)
- Maximum time in a trade (specified by the signal)
- Risk to reward (only trade at favorable setups)

Challenge us for your year-end special and schedule your consulting hour:
contact@NeverLossTrading.com Subj.: Demo.
We are happy to hear back from you,
Thomas Barmann (inventor and founder of NeverLossTrading)
Disclaimer, Terms and Conditions, Privacy | Customer Support


