Spot and Trade Institutional Money Moves

Algorithmic Trading with Human Interaction for:

Day Traders, Swing Traders, Long-Term Investors

Saturday, March 26, 2022

Options Trading for Private Investors

We share a simple options trading strategy, helping you to position where big money invests short-term.

Options trading offers you three significant advantages:

–           You only invest a fraction of about 1% to 5% of the share price.

–           You operate with leverage when your trade works.

–           You can limit your maximum risk by choosing an adequate strategy

The big question is: how to find such options trading opportunities and capitalize on them?

NeverLossTrading Options Strategy

Successful options trading needs a solid knowledge basis; however, today, we provide a shortcut in peaking over the fence and copying what institutional investors do.

We let our scanners venture through stocks with liquid option chains daily, highlighting happenings according to our specifications.

Let us share an example: End of the day on March 11, we created the following report for March 14 (a Monday), highlighting two options trading opportunities:

  • BIDU
  • SBUX

Our NLT Options Alert is comprehensive, reporting the details of the trading day:

Highlighted Options for March 14, 2022 by NeverLossTrading

As you see, it has a lot of details, but let us magnify into the table:

Highlighted Options for march 14, 2022

For BIDU, three options trading opportunities are highlighted:

  • The March 18, 22, $125 Calls that were trading between $3.80 and $9.19, closing at $4.09
  • The March 18, 22, $130 Calls that traded between $2.18 and $9.50, closing at $2.45
  • The March 18, 22, 110 Puts that ranged between $0.52 and $4.10, closing at $4.09

When you see such indications, how to read and act on the happening?

A typical institutional trading strategy is selling naked Puts and buying Calls. The advantage of this strategy is that you are collecting premium and time decay works in your favor by selling Puts. On the other hand, when buying Calls, time decay negatively impacts you, but you want to achieve a leveraged income from solid directional price moves.

What did our indicators tell about the current price situation of BIDU?

The stock was in a downtrend; let’s check the TradeColors.com chart. Tradecolors.com is our introductory system to algorithmic trading with human interaction. Trade situations are specified by the first two same color candle combinations when the high of the second blue candle or the low of the second red candle is surpassed in the price movement of the next candle.

We let the chart tell when to buy or sell: Trade what you see!

BIDU on a Daily NLT TradeColors.com Chart
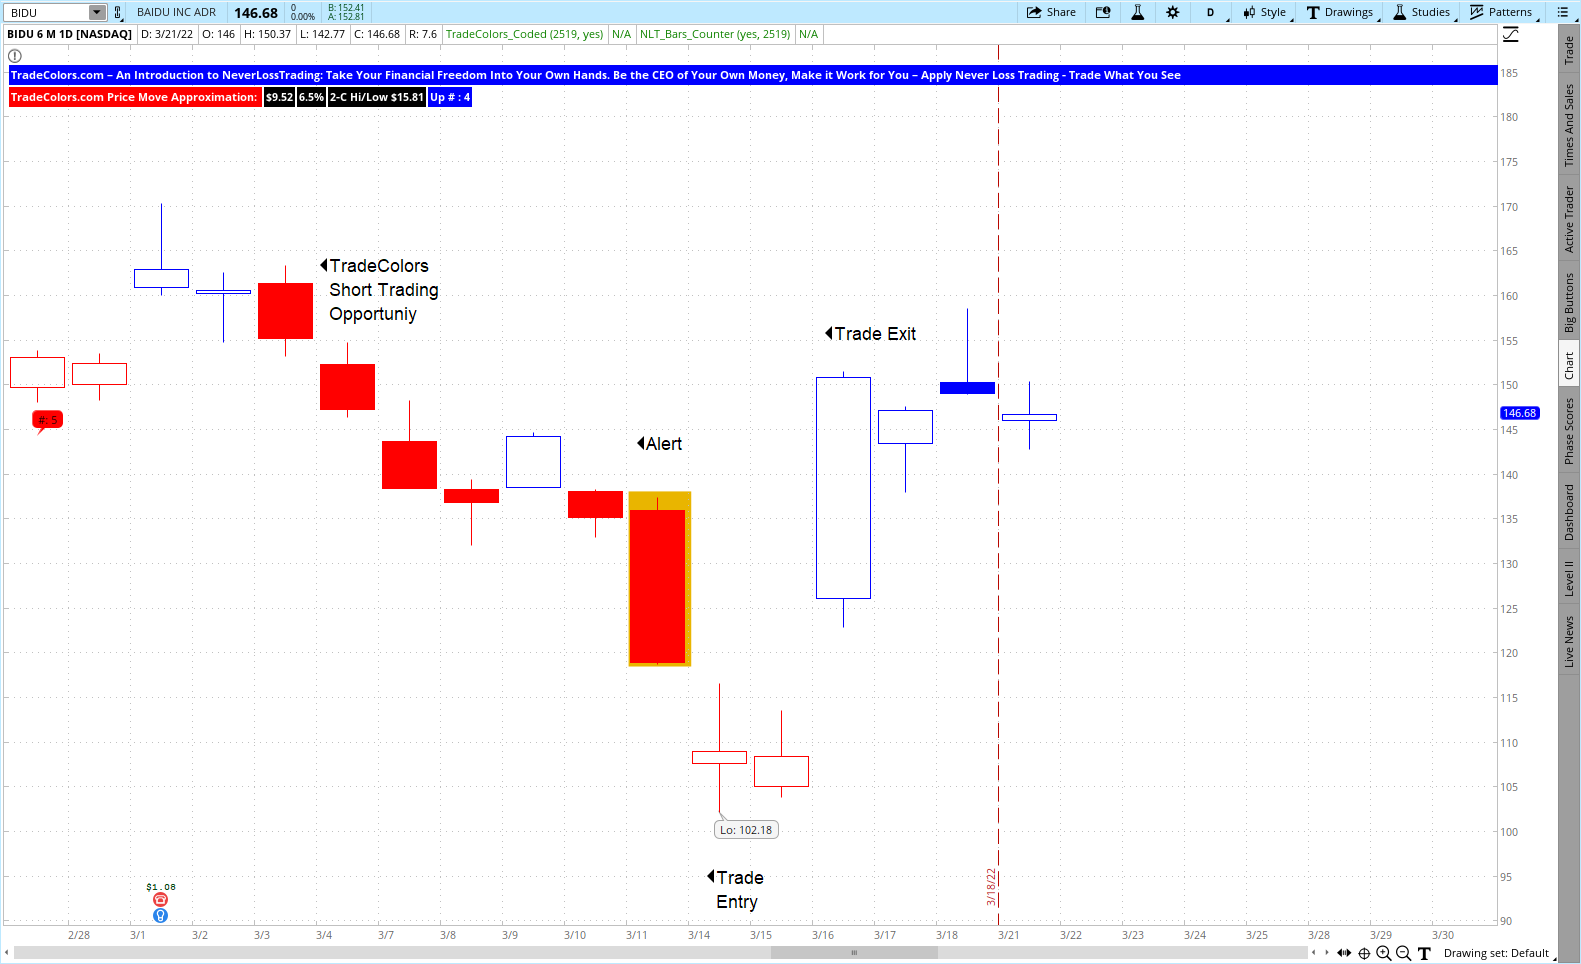
BIDU Highlighted NLT Trading Opportunity

The chart shows:

  • On 3/4/2022, the TradeColors.com indicator highlighted a short selling opportunity that came to target on 3/11/2022.
  • For March 14, 2022,  our alert showed an opportunity to copy the institutional investment of 11, 2022: buying $125 and $130 call options and selling them on March 16, 2022. The table below shows the calculated results for the Call options. We do not advise to participate in naked Put strategies; however, in the example, they expired worthless:
BIDU Options Trading Return

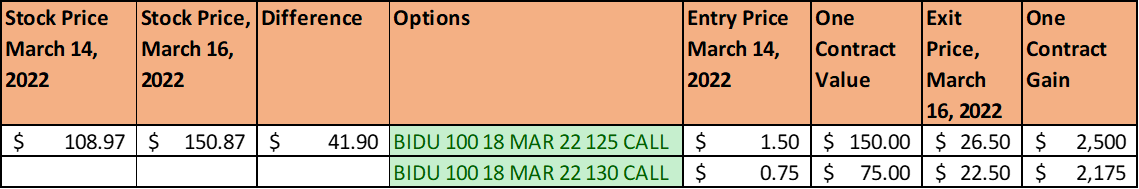
The example demonstrates the power of the leverage options trading can give you; however, you need to be aware of the opportunity. Short-term options are prone to time decay, and such, if you are wrong in your directional assumption, their value deteriorates quickly.

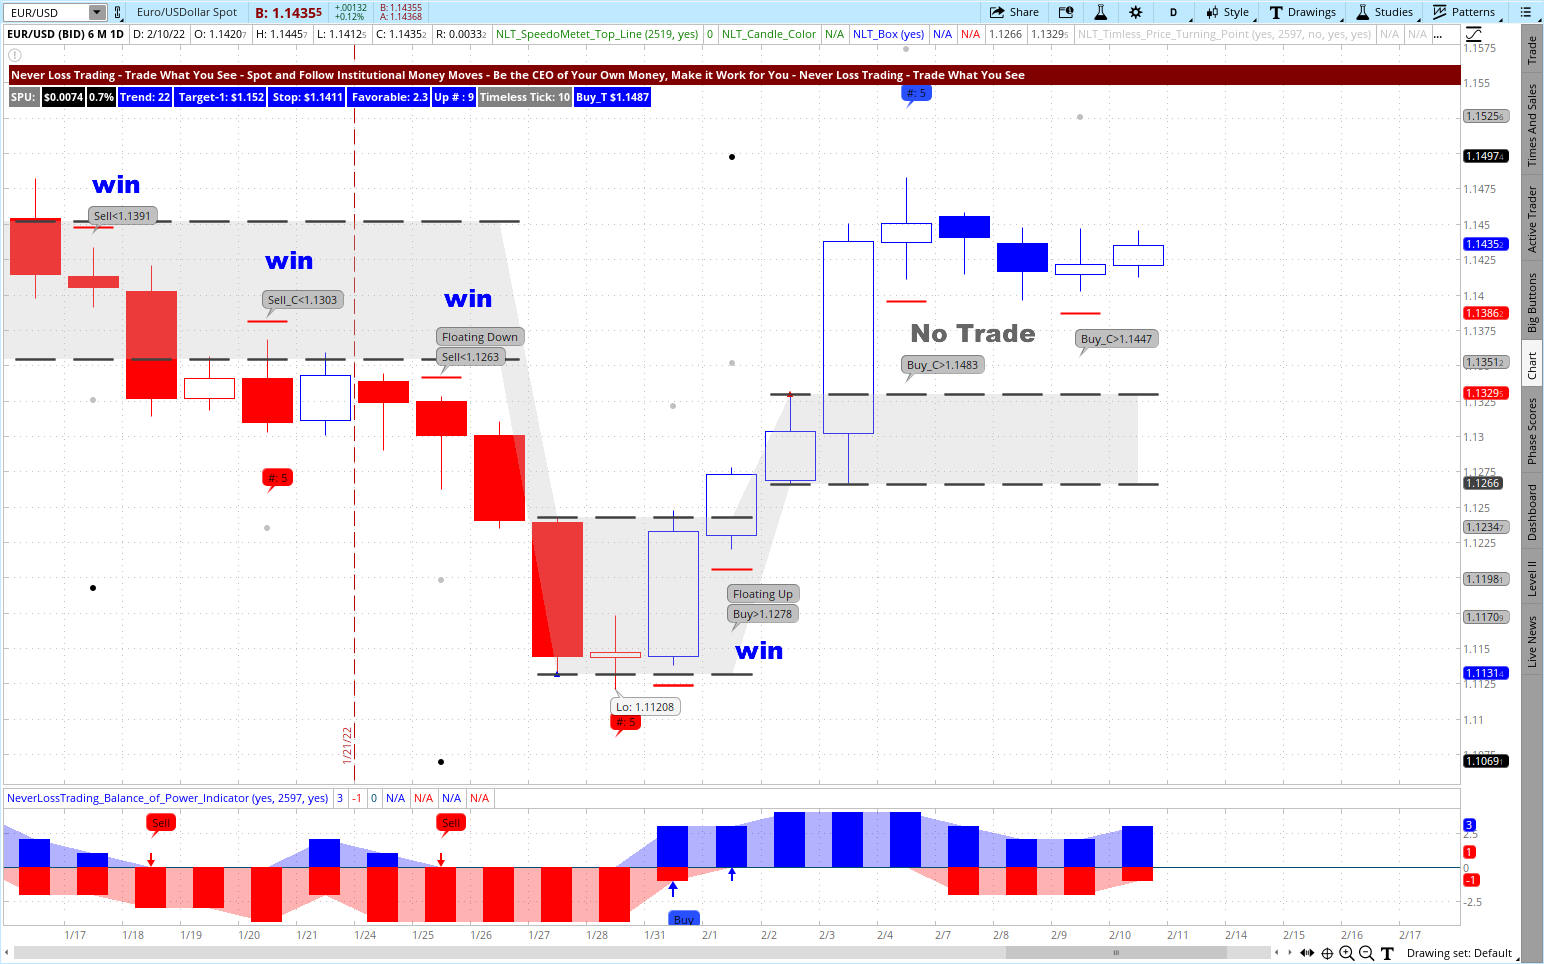
The second stock highlighted was SBUX (Daily Chart)

SBUX Highlighted Trading Opportunity by NeverLossTrading

Here is the impact the price development had on the Call options to buy:

SBUX Options Trading Return

A dream many options traders have; however, we want to make you aware that there is no risk-free trade, and on short-term options, theta or time decay can quickly take your money away. Hence, options trading needs a model or system that helps you to invest at crucial price turning points. The strategy of following institutional investments is just one way of trading along with price moves that you can learn in our mentorships.

Options traders have to find answers to multiple questions, reaching from a system-based price-move-indication to choosing the appropriate options trading strategy.

Importance of Option Trading Decisions

Dimensions of Options Trading Decisions

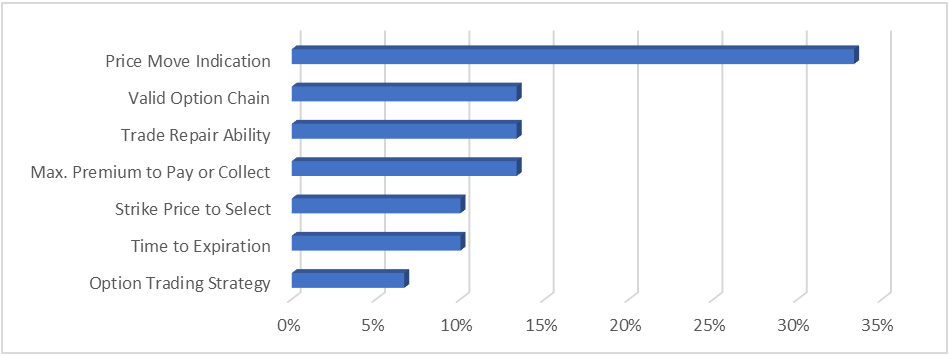
The overview shows multiple factors to consider and let us explain them:

  • Price move indication determines to 33% the outcome of your options trading endeavors; however, there are many other decisions to be made with a similar impact on your options trading success.
  • A valid options chain is an essential factor to consider and leads you to only focus on liquid options with tight bid/ask spreads.
  • Trade repairability is intertwined with a valid options chain and includes picking a trading strategy that allows for a repair when the trade develops in the opposite direction.
  • Our systems determine if the premium to pay or collect is in spec., and you trade with the odds in your favor. This way, you never pay too much or collect too little and trade with the odds in your favor.
  • There are many theories of which strike price or delta to pick. We developed our own mechanics and rules, helping you to participate with the highest leverage in anticipation of a minimum 1-SPU price move.
  • Our systems and strategies determine the maximum expected time in the trade to come to target, and in relation to this, you will always know which time to expiration to choose.
  • We mainly focus on buying Puts or Calls on the side of the options trading strategies; however, we work with debit or credit spreads when options are overpriced.

Summary of our Options Trading Imperatives

Option Trading ImperativeAnswer
Price Move IndicationNeverLossTrading System
Valid Option ChainStatistics of bid/ask spreads, daily volume, open interest
Trade Repair AbilityOur research and experience shared in our mentorships
Max Premium to Pay or Min Premium to CollectNLT SPU-Measure-Based decisions (Algorithm)
Time to ExpirationNLT Signal-Based
Option Trading StrategyChart-Based: Max. premium to invest or risk to accept
Summary of Options Trading Dimensions

Producing consistent income from trading and investing is a process. We provide systems, strategies, and a game plan, helping you develop yourself into the trader you want to be.

If you are up for learning this, let us get super interactive, and we will meet with you in a one-on-one meeting online to test how our systems can help you to answer the options imperatives.

Schedule your consulting hour:

Call +1 866 455 4520 or contact@NeverLossTrading.com Subj.: Consulting

We are looking forward to hearing back from you,

Thomas

www.NeverLossTrading.com

Disclaimer, Terms and ConditionsPrivacy | Customer Support  

Saturday, March 19, 2022

Be a 20 Minute Trader

Summary: Experience what is needed to be an efficient retail trader with the right competency and skill set to be consistently profitable. Yes, you need to read through more than 140 characters; please feel invited!

Can you be an efficient retail trader with twenty minutes of preparation a week?

The answer is yes, but there is a condition attached to this yes:

You have to be highly competent in the subject matter.

NeverLossTrading Competency Fields

Competency is generally understood as the knowledge, skills,  and learned abilities to perform a task successfully.

Hence, if you are a competent trader, following this path, 20-minutes a week will be sufficient, but here are some questions:

  • Can you dissect a price-move assumption based on weekly charts into underlying fractions and take part in those rather than shooting for the skies?
  • Do you follow a system that gives you ≥ 65% probability to specify when an asset is ready for a price move?
  • Does your system give you specific entries, exits, and stop levels, so your orders are auto-executed?
  • Are you operating with strategies that limit your risk and provide gains when prices move to the up or downside?
  • Did you familiarize yourself with the price patterns of the assets you trade?
  • Are you producing profits above the index development (a typical measurement for fund managers) if the market moves up or down?
  • More preparation is needed if you want to day- or swing trade multiple times a week, and we refer to this later.

What is involved in achieving trading and investing competency:

Elements of Trading and Investing Competency

Trading and Investing Competency Fields by NeverLossTrading

It would go too far, explaining all trading and investing competency elements, but if you are interested, we are happy to share another article about the subject matter with you:

contact@NeverLossTrading.comSubj. Competency

As humans, one of our psychological patterns is called the Dunning-Kruger effect. It tells us that we vastly rate our competence level much higher than it actually is in multiple competency fields.

In short: People’s incompetence prevents them from recognizing their ineptitude:

In competence tests, probands that lost four out of five competence challenges still rated their competency on the subject matter above 65% and rated the winners’ competency lower.

The question: How to get around it?

With an increased competency in subject matter, the level of confidence in the own ability and skill comes to a level where perceived and actual reality are more related.

Danning-Kruger Effect on Competency and Confidence

Dunning Kruger Effect

Nobody would ever return to work if trading or investing were easy, but they are learnable—however, competency must be built and obtained. So do not risk your money with high confidence and little competency.

The question is: Do you possess enough knowledge and skill to put what we shared here into action. Or do you instead want to take our offer for a complimentary session with an expert where we look where you stand and develop a concept to train and coach you with the help of our systems for making competent decisions?

We teach in a holistic approach the step in learning how to turn yourself into the trader and investor you want to be:

Experience in a live session what we can do for you:

+1 866 455 4520 or contact@NeverLossTrading.com

Schedule your consulting hour and consider learning all variables needed for trading and investing success.

Elements of the NeverLossTrading Mentorships

The frightening truth: 76% of private investors lose money!

We base this number on a study we conducted, and if you like to experience why: write us an email, and we will share the details: contact@NeverLossTrading.com Subj.: 76%. 

Who had assumed such a high rate of losing traders?

What are the reasons for this?

Retail traders with little competency overestimate their abilities.

How can you change this?

As you can imagine, there is no single and straightforward answer; however, success has a structure. Therefore, we dissected the critical elements of trading and investing success to add them to your knowledge and skillset.

Let us give you an example for a 20-Minute a week preparation in bullet points:

  • Weekly charts show a limited number of selected stocks: You need an opportunity finder to select stocks ready for a price move, either on your own developed or by a subscription to an Alert Service.  
  • Rather than planning for a multi-week development, your system dissects the planned price move into fractions or fractals: the NLT Timeless Concept does this – and you trade purely price-based, keeping risk and reward in an acceptable balance. This way, you trade a shorter-term price development rather than for a long-term happening.
  • You operate with strategies that combine stocks with options or trade the options to limit the risk of drawdowns.
  • Making money is your mandate, regardless of whether the markets move up or down.
  • If you want to day-trade or swing trade, you need more preparation and competency to make sound decisions. For example, if you are a decent chess player, playing a blitz game with only five minutes for the entire game will challenge your decision-making more than playing for unlimited time.

Stock Trading Example

We pick a stock widely held in many portfolios: MSFT. Then, instead of trading for a time-based happening, we translate the chart into consistent price increments with clearly defined entries, exits and stops.

MSFT on the NLT Timeless Chart, Feb. 2-11, 2022

MSFT on the NeverLossTrading Timeless Chart

Situation-1: Sell_T < $305.83 led to a trade to the downside.  The trade reached its target (gray dot on the chart) in the price development two candles after, and the trade was closed with a profit.

Situation-2: Buy_T > $307,94. The target for the trade sits behind a severe barrier, expressed in the dashed black line. Hence, we assume that the price will bounce back at this line and do not trade.

Situation-3: Sell < $299.45. This signal led to trade, which closed the next day at target (gray dot).

As you can see, there are rules to learn how to operate with the NeverLossTrading Trend Catching and Timeless signals.

We teach those in our mentorships, where we work with you on your specific wants and needs.

When we now compare a daily chart for the same time period, we see:

MSFT on the NLT Daily Chart, Jan. 28 to Feb.11, 2022

MSFT on a Daily NLT Trend Catching Chart

When applying the same rules, none of the spelled out buy or sell signals were confirmed in the price development of the next candle, and the daily MSFT chart offered no trading opportunity.

We hope you now see what NLT Timeless Trading as an addition to time-based trading can do for you.

Day trading is a reliable way of risk-limiting your trades at times with constant market shifts. To be fit for day trading, you need to train on acting in a fast environment. Your system and your decisions need to be more precise: This is trading in an environment like sports pro, and at first warm-up for the day and get ready to score:

  • Bring yesterday’s market action and the overnight happening in a correlation.
  • Note critical news events of the day not to be caught in volatility.
  • Prepare for acting on high probability setups by assuring which signals and patterns you had the highest success with. Hence, do not forget to journal past trades to confirm where you score the best (we provide such journals to our clients).
  • Tune your chosen trading instruments by establishing bracket orders.
  • Make sure you will hold your trades to target or accept the stop.
  • Affirm that you retire or scale down by reaching your max expected win or loss for the day.

We offer our subscribers a Telegram.net channel, where we inform on each trading day about critical happenings and our market read.

Let us share day trading examples with the NeverLossTrading Trend Catching and Timeless concept for the E-Mini S&P 500 Futures Contract. All candles are purely price-based constructions; time is not considered; however, there was enough time as you can spot to enter your buy-stop or sell-stop orders.

You sure have to prepare by learning the rules of the trade and how the chart is constructed. To demonstrate that this way of trading offers you enough time to get your orders in the market, we analyze each situation and express timestamps of each happening that led to a trade.

E-Mini S&P 500 Futures Contract, NLT Timeless Chart

E-Mini S&P 500 Futures Contract on the NLT Timeless Chart

Situation-1: Buy_T>$4649.8 is confirmed in the price movement in the next candle, and the trade came to target in one bar. You were 16 minutes in the trade. The exit was at the gray dot, and we neglected additional signals in the chosen or opposite direction.

Situation-2: Sell_C < $4512.8, initiated a trade in the next candle. The trade entry was at 13:35 and the exit at 15:35 for a value change of $1,000 per futures contract.

Situation-3: Two signals occurred in a short period. By the end-of-the-day signal: Sell_C < $4,484 was confirmed at market opening (18:00 EST) and came to target. Right after, an opposite-facing signal: Buy_T > $4,483.3 initiated a trade at 3:11 a.m. and came to target at the market opening, 9:30 a.m. EST.

Situation-4: Sell < $4,472.8 formulated an opportunity that was confirmed at 11:42 a.m. and came to target at 13:30 EST. The signal also composed a 3-SPU price distance, which we take to no more accept trades when this price level is reached, which was the fact at 13:45.

All trades were taken mechanically; however, in our mentorship, you will also learn considerations to pick higher over slightly lower probable happenings, helping you to turn yourself into the trader and investor you want to be:

Experience in a live session what we can do for you:

+1 866 455 4520 or contact@NeverLossTrading.com

Working one-on-one spots are extremely limited:

Do not miss out!

For more of our free publications and webinars…sign up here.

We are looking forward to hearing back from you.

www.NeverLossTrading.com

Disclaimer, Terms and ConditionsPrivacy, Contact

Thursday, March 10, 2022

Trading Volatility Daily

Summary: Trading with expanding and contracting volatility offers an excellent opportunity for retail traders to operate with small risk units and strive for exceptional returns.

Volatility is a measure of price change over time. We take multiple volatility-related stats to determine the speed of price changes and the influence on the value of related assets.

Read on and watch the video!

The current market situation shows increased volatility levels that express a higher risk for long-term portfolio holders: We teach how to hedge your holdings in our mentorships. On the other hand, volatility swings offer great short-term trading opportunities if you are ready to identify crucial price turning points for solid returns; read on and experience that every market situation provides opportunities for those skilled and educated to participate.

NeverLossTrading Volatility

A commonly known measure for volatility is the VIX Index, published by the CBOE. It measures the S&P 500 Index’s implied volatility based on options prices and judges the expectations for price fluctuations of the stock market. It is often called the “fear index”: at times of uncertainty, we have high VIX readings, suggesting that the stock market will be moving sharply either up or down, using percentage points. When the VIX prints at 30, It means that the market’s view on volatility is ±30% annualized, 68% of the time (standard deviation). The more expensive SPX options (insurances) become, the higher the VIX.

In general, the VIX is inversely related to the S&P 500 index: if the market goes down, the VIX goes up and vice versa.

Let us check a comparison of the VIX and the S&P 500 Index for the last three years:

S&P 500 Index and VIX Weekly, March 2019 to March 2022

VIX and S&P 500 Development

By its nature, the VIX shows exceptional strong rises and contractions after, offering short-term traders opportunities to trade along with those price movements. Price changes resulted from a shift in supply and demand, and we developed NeverLossTrading Algorithms to forecast Volatility changes with high predictability. When prices radically change and show extreme fluctuations, we use the NLT Timeless Concept to dissect daily or weekly price changes into smaller, acceptable risk units. We best explain by some recent examples.

With the help of our indicators, you will no more see random price movements but patterns to follow at crucial price turning points: trade what you see – let the chart tell when to buy or sell!

The VIX index is not tradable for you as a private investor; however, you have multiple ways to trade the Volatility index as a retail trader. Here are the two we prefer:

  • The Future: /VX requires about $10,000 of maintenance margin and a futures trading approval. If you want to follow the VIX development with this instrument, applicable price changes to trade for are about $1,000.
  • An Exchange Traded Note (ETN) like VXX with a minimum risk unit of about $30 and an expected return on cash of 3% – 6% per day. There are other ETNs or ETFs; however, we prefer VXX over other alternatives based on volume and composition (contango, backwardation).

With the help of our charts and indicators, we will show examples of how you can follow predictable price changes. Our goal is to participate in expanding and contracting VXX developments. VXX shares are mostly rated ETB (easy to borrow); however, for shorting VXX, there are three prerequisites to consider: You need a broker that has shares of VXX available to borrow, a margin account, and sufficient cash or security holdings. Another way to short VXX is to buy SVXY. This Exchange Traded Fund goes up when VXX goes down. Buying an inverse fund does not require a margin account so that you can make this trade in ordinary cash accounts or IRAs. Please also consider that opening and closing more than three positions in a week makes you a pattern day trader, and you are required to hold $25,000 in your account (SEC regulation).

SVXY and VXX in Inverse Relation

SVXY and VXX in Inverse Relation

The following chart gives you an overview of how our indicators spell out buying and selling opportunities. We will explain how to decide which indication to take and which not in the following. There are some rules to learn, and we will explain those further. By the much higher risk acceptance when trading the /VX future, we concentrate here on VXX charts in this publication.  

By trading intraday or holding for a maximum of two days, topics like contango or backwardation are not considered when acting with VXX.

VXX on the NLT Timeless Chart

VXX on the NeverLossTrading Timeless Chart

The chart shows volatility spikes and contraction after, allowing you to participate in the up da down moves of VXX.

Our indicators formulate price thresholds: Buy > and Sell <. This way, you can operate with buy-stop and sell-stop orders.

With our concept, we trade when VXX breaks out of the gray underlined boxes with an NLT Signal. And we disregard first opposite trades and favor seconds.

Some rules to learn, and we work with you in individual sessions and support you with specific documentation.

Let us go left to right and highlight potential trades and their outcome: A transaction comes to the target when the gray dot on the chart is reached, and we do not enter at the exit level. We cannot prevent an indicator from proposing buying or selling, but we teach you how to separate the good ones from those not in spec. Please watch the video for details!

VXX Day Trading on the NLT Timeless Chart (video)

VXX Trades Explained on the NLT Timeless Chart

Experience in a live session what we can do for you:

+1 866 455 4520 or contact@NeverLossTrading.com

Working one-on-one spots are extremely limited:

Do not miss out!

For more of our free publications and webinars…sign up here.

We are looking forward to hearing back from you.

www.NeverLossTrading.com

Disclaimer, Terms and ConditionsPrivacy

Saturday, March 5, 2022

Return on Risk in Trading

Summary: Successful traders bring risk and reward in a meaningful balance to produce long-term income from the financial market—experience how this can be done by reading on.

What is your return on risk (RoR)?

Yes, you read right, return on risk, not capital. However, let us compare the two formulas:

  • Return on Capital (ROC) = Profit / The Invested Capital
  • Return on Risk (RoR) = Expected Profit / Assumed maximum Risk

Do you see the big difference between the two?

Return on Risk by NeverLossTrading

ROC takes past data and compares the outcome of the business or trading endeavor and reports in Hindside how things were.

By calculating RoR, you forecast two dimensions:

  • A forecast of the expected profit means that you or your system must specify the desired outcome of each trade and its probability.  
  • Forecast the maximum expected risk to take to bring the trade to target without getting stopped.

Boiling it down: as a trader, you are a probability thinker, and you only put your money at risk when there is a high probable chance for it to produce the desired return. Still, this does not help you define how much risk you can accept and assume its probability.

We work with high probability algorithmic setups and aim for an attainment rate or probability of winning ≥ 65%.

So now, let us make a simple breakeven calculation of the maximum risk you can take in a trade when your expected outcome or profit is $1 at a 65% chance of winning.

Breakeven =Winning – Losing= 0
Breakeven =$1 * 0.65 – 0.35 * Max Risk= 0
Max Risk =$1 * 0.65 / 0.35= $1.86
Return on Risk Formula

What does $1.86 mean for you as a trader?

When you operate with a 65% winning system, your max risk to accept is 1.86-times the reward, but you only reach breakeven at this point.

We casually advise our clients to accept a maximum of 1.2  to 1.3-times risk per dollar expected reward. Hence, when you operate with a high probability system and dedicate yourself to following this rule, you have an edge as a retail trader to produce constant income from the financial markets.

The biggest problem is how to specify the dollar target of a trade?

A general maximum principle of achieving a maximum output for a minimum risk does not work in trading, as it does not work in economics either:

  • You calculate an economic maximum by taking a base resource and calculating the output you can achieve by evaluating alternatives.
  • A financial minimum specifies a given output and calculates the choice with the lowest resource usage.

For trading, this means:

  • Know and understand your system probability. Unfortunately, most retail traders work with systems or ideas far from high probability and celebrate their random wins.
  • Let your system define the expected output of the trade and check if the setup allows for operating with an adequate risk gauge to bring the trade to target.

Why is there a risk gauge?

Price change has a natural statistical distribution, and when you set too tight stops, you get stopped before bringing your trade to target.

In case of wide stops, like 2-times profit, you risk too much, and you will not make long-term money.

It sounds like you are between a rock and a hard place.

Yes, trading is not easy, but it is learnable.

Let your system and chart tell when to buy or sell and trade what you see, not what you assume.

The price change results from a shift in supply and demand. Thus, a system can measure those and extrapolate how far a price movement most likely expands: This is precisely what our indicators and algorithms calculate and share on the chart with you.

Yes, trading is a numbers game, and you better comply with what works more often to come to profitability. The driver of your P&L is trading with the odds in your favor: Here is the price move model we follow, and it considers all we said above:

NeverLossTrading Price Move Model

NeverLossTrading Price Move Model

Theory: Key asset holders will have a solid need to re-balance their inventories. Thus, at a particular price expansion, they will either float- or shorten supply, which will result in an opposite directional price move that will then take away from our profits. Knowing this, we pre-calculate how far the expected price move will reach, and there we take profit,  assuming it will retrace or reverse after.

Hence, we let the market and institutions appraise the asset price journey and latch on, entering and exiting positions faster than institutions can.

Our brand name derives from the concept of repairing a trade instead of accepting a stop loss; however, Never Stop Loss Trading was a bit lengthy.

TradeColors.com is our introductory system to high probability trading. We always allow for upgrades; you only pay the difference if you start with TradeColors.com and upgrade after.

Many of our clients purchase more than one system: Our systems are productivity tools, and by combining them, you produce a higher participation rate and higher returns.

NLT System Index Productivity Comparison
NeverLossTrading System Productivity Compared

Our tool to calculate the expected price move to target is the SPU = Speed Unit, and it indicates how far a price move shall reach until it comes to an end. 

With our systems, you can operate with conditional buy-stop and sell-stop OCO orders (one-cancels-the-other). Without the need to be in front of your computer for the orders to execute. You enter by price thresholds, ensuring that other market participants have the same directional assumption as you do and exit at the SPU target or adjust the trade at the stop.

NeverLossTrading SPU Move Indicator Explained

By a change in the frequency and amplitude of the price movement over time, we specify indications to act on high probability price turning points, applying mechanical rules rather than leaving room for interpretation.

We cover all asset classes: Stocks, Options, Futures, FOREX.

As a retail trader, you have multiple opportunities for:

  • Day trading (opening and closing positions the same day)
  • Swing trading (holding position for multiple days)
  • Longer-term investing (holding positions for weeks and months)

You can act with a high probability price move model on key price turning points based on clearly defined risk-limiting strategies.

With the help of our systems, we help retail traders to decide at trade entry for the  five significant challenges they face to prevent the common mistakes often made:  

  • Trade entry decisions (when to trade)
  • Exit decisions (where to take profit)
  • Stops (where to place them)
  • Maximum time in a trade (specified by the signal)
  • Risk to reward (only trade at favorable setups)
Decision Making Dimensions in Trading

Make a change to your trading results, and we will find out which of our systems suits you best.

contact@NeverLossTrading.com  Subj.: Demo.

We are happy to hear back from you.

Volatility in the financial markets is up, and time-based price moves bury a higher risk than before. So we developed the NeverLossTrading Timeless Concept, where we dissect hefty potential price moves into sub increments to reduce the risk unit per trade. Here are some examples of what our system can do for you as a day trader or swing trader.

  1.  Stock Examples

By the NLT Timeless Concept, instead of drawing price happening over time, we trade for price changes and with that prevent long candles with unfavorable risk-reward setups:

AAPL NLT Timeless Trend Catching Chart, Jan. 24, 2022

AAPL on the NeverLossTrading Timeless Chart

A price threshold is formulated for every trade situation: buy > and sell <. This way, you can operate with buy-stop and sell-stop orders and only enter a trade when the threshold is surpassed in the price movement of the next candle. When you add up winning and losing trades, you see an example of high probability trading where we strive for winning 65% and above.

The chart shows a pure mechanical appraisal where every situation is traded. In the mentorship, you will learn the rules of how to pick higher over the lower probable cases.

Let us now take a time-based example for swing trading: holding a position between one and ten days.

AAPL NLT Daily Trend Catching Chart, Jan./Feb., 2022

AAPL on the NeverLossTrading Trend Catching Chart

The chart shows multiple situations from January 4 to February 9, 2022, where it reads no trade: A signal spelled out a trading opportunity; however, the direction was not confirmed in the price movement of the next candle and such, no trade got accepted.

If you trade from an IRA, you would not be able to follow the short signals on the chart (SEC regulations do not allow short selling in IRAs). However, we teach appropriate Options trading strategies that you can profit from when stock prices fall.

  •  Futures Trading

The E-Mini S&P 500 Futures contract is an instrument many retail and professional traders operate with. Hence, let us pick a day trading situation and a longer-term trade setup:

NLT Timeless Trend Catching Chart for the E-Mini S&P 500

E-Mini S&P 500 Futures Contract on the NLT Timeless Day Trading Chart

The chart shows multiple buy or sell opportunities:

  • Each opportunity formulates as a buy > or sell < a system-defined price threshold, allowing you to enter the trade direction only when the direction is confirmed.
  • Each price change ends at the target (dot on the chart) or the red cross line, indicating where to stop.
  • The system probability is ≥ 65%. The difference of entry to stop is about 1.2-times the difference of entry to the target. In the chosen example, entry to target was $350 and such the risk was $420. Adding up three trades: two winners ($700) and one losing trade ($420), gives you a positive expectation of $280 per contract on a set of three trades.

Daily NLT Trend Catching Chart for E-Mini S&P 500

E-Mini S&P 500 Futures Contract on the NeverLossTrading Tend Catching Chart

From left to right, you see:

  • A trade to the downside, breaking the price containment NLT Box and coming to target: gray dot.
  • Two trades with “No Trade” indication: on the first trade, the target was cut short by a box line – no trade. The second signal was not confirmed.
  • What follows are two winning trades that came to target.
  • Then two “No Trades” where the threshold did not get surpassed in the next candle.
  • A winning trade on Buy_T> $4,426 that came to target three candles after entry.
  • An open trade that did not reach its target or stop. We set the stop by the red crossbar on the chart.
  • FOREX

The most favored FOREX pair is the EUR/USD. There are multiple ways to participate in the price development, and we share a day trading and swing trading example:

Timeless NLT Day Trading Chart for EUR/USD

EUR/USD on the NeverLossTrading Timeless Chart

From left to right:

  • No Trade, by NLT Box Line cutting the price move to target short
  • Wining long trade to target
  • Winning short trade, followed by another winning short trade
  • A losing short trade
  • Two winning long trades.

Daily NLT Trend Catching Chart for EUR/USD

EUR/USD on the NeverLossTrading Trend Catching Chart

When we sparked your interest and you want to come on board with our systems and strategies, we invite you to a personal session to see how our systems work life.

contact@NeverLossTrading.com  Subj.: Demo.

We are more than 10-years in the trading education business, teaching one-on-one at your best available days and times, and are ready to share our experiences of helping private investors to build their trading business. Trading is not a typical career, and you best learn from those who are long-term in this business to cope with the rollercoaster of the financial markets. We are here to help and provide feedback on what you might be doing right or wrong.

Make a change to your trading results, and we will find out which of our systems suits you best.

Stay informed and subscribe to our free market updates.

We are happy to hear back from you,

Thomas Barmann (inventor and founder of NeverLossTrading)

www.NeverLossTrading.com

Disclaimer, Terms and ConditionsPrivacy | Customer Support