Spot and Trade Institutional Money Moves

Algorithmic Trading with Human Interaction for:

Day Traders, Swing Traders, Long-Term Investors

Saturday, February 28, 2015

Turn Yourself into the Trader You want to be: FREE Multi-Speaker Event

MarketFest

You’re invited to join me at MarketFest on Wednesday, March 4, starting at 9:00 AM Eastern time (6AM Pacific).

What is MarketFest?

It's an all-day, multi-speaker event hosted by WINvesting and featuring 5 top trading experts sharing our most powerful strategies for succeeding in today’s market.
And the good news is it’s absolutely FREE!

All you need is a computer and Internet access to attend.  Space is limited, though, so register now:

Click Here to Register for MarketFest
Check out this list of world-class expert traders who will be presenting:

==
Thomas Barmann (yours truly!)
NeverLossTrading


Activity Based Trading


In this presentation, you will learn how to spot and trade along with directional price moves, with the help of activity based trading models; focusing on early entries, price continuation pattern, reversals, and short-term price moves. Trade with the institutional money flow, but with defined entries and exits, and ONLY when the odds are in your favor.
==
Simon Jousef
Global Trade Room

How To Trade With Ridiculously Small Stops
Can you trade with ridiculously small stops? We call them SMART stops.  How can a trader be successful without knowing the exact levels of stops and targets?  Price can be predicted -- no randomness is allowed if you choose to learn how to control the trade.

==
Joshua Martinez
Market Traders Institute

The London Breakout Strategy
Understand why the open of the European session is prime for potential trades.  Learn to identify trades using counter-trendline breaks.  Watch as Joshua explains how he identifies potential daily highs and lows forming.
==
John Ondercin
Invest To Success

How The Pros Dominate The Oil Market The Level 2 Way
The "market makers” are always playing games, but there’s a little known tool used to decipher what their true intentions are when they move price in a given direction.  It’s called the “Level 2 Screen”.  The Level 2 Screen lets you see what’s REALLY going on behind the scenes, and shows you how to play the game to win.  In this session, John Ondercin reveals some very effective trades you can start taking IMMEDIATELY using the Level 2 Screen as your guide.  (As always, we recommend you take all trades in simulation until your professional financial advisor recommends going live.)  Your eyes will be opened wide to how the market makers are trying to manipulate you, and how you can defeat them at their own game.
==
Evan Lazarus 
T3 Live

5 Rules Every Trader Must Know
Evan Lazarus shares the critical 5 things that made him a successful trader and educator, and he'll show you how to apply them to your trading.  Learn why shorting (one of his specialties) is easier than most people think.  Evan will also discuss what he sees happening in the markets and possibly even go over a trade set-up or two.
-----
Click Here to Register for MarketFest
This is a fantastic opportunity to learn from the best of the best, and to get personal attention from each speaker in the exclusive Q&A sessions after each presentation.
Click the registration link to see more information on each speaker, along with a complete schedule for the day.
The event starts at 9:00 AM on Wednesday, March 4 and goes to 4:45 PM (all times Eastern).  That’s a lot of high-quality, actionable training you can start using IMMEDIATELY in the market to improve your results.
I look forward to seeing you there!
Space is Limited -- Register Now

Sincerely, 

Thomas 


P.S.  When you sign up, you'll also get access to the archives of the previous five MarketFest events -- that's over 25 HOURS of training on multiple strategies that have been proven in today's market.  You won't find a unique lineup of top quality speakers like this anywhere else.  Don't miss this special event on Wednesday, March 4, starting at 9:00 AM Eastern (6AM Pacific). 


Click Here to Register for MarketFest

Thursday, February 19, 2015

Trade with Institutional Money Moves

The world financial markets are dominated by institutional investors; however, more and more private investors enter with the aim to make an income by applying conventional technical analysis, which tends to teach you how to buy or sell based on past price action oriented mathematical models: Moving averages or reversal to the mean concepts, using indicators and oscillators that always lag behind the real price action, which means:
You are trading with a high risk of buying and selling at the worst point of the price move.
No wonder that the fallout rate of new traders is so high and many who trade for years still never make any money.
How can it be done right?
By portraying market actions triggered by institutional investors on your trade screen: To do so, you are in need of an activity based trading system, which helps you to spot and follow institutional price action when it happens.
Prop Traders are the biggest force in the markets: Institutional investors, trading their own money, trying to profit from their information production, buying what they feel is underpriced and selling overpriced assets. Fundamental information on multiple levels is gathered and put together to make those decisions. One way or the other, Prop Traders market actions will be recognized and the crowd, in our case: Fund managers (mutual funds, hedge funds, pension funds, exchange traded funds...) and low risk investors (banks, insurances) follow the leaders.
Instant, activity-based alerts are needed and you can be part of this!
NeverLossTrading developed multiple systems, all taught individually (suited to your wants and needs) that help you to spot and follow those price moves. See the following chart examples:
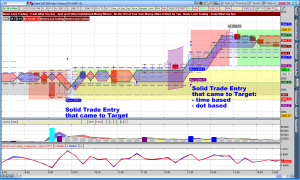
Chart-1: Emini S&P 500 Futures Example, traded on a 10-Minute NLT Top-Line Chart
NeverLossTrading Top Line 10 Minute February 2015
The above chart shows you multiple indicators corresponding with you, showing your clearly defined entries, exits, stops as well as key support and resistance levels: Very essential and needed for profitable day trading.
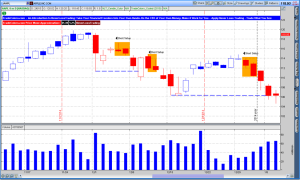
Our entry level system is called TradeColors.com and it lets you act on confirmed price moves after institutional engagement. A two candle trade setup helps you to trade along with institutional price moves:
Chart-1: AAPL on the TradeColors.com chart, showing short setups
 AAPL Trade Colors Example
What the chart is telling you:
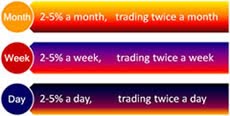
Trade with the highlighted price moves and focus on trading for short price increments and compound interest, rather than assuming that a price move develops into a long-term trend. In the matter of 20 trading days, you were able to realize three trading opportunities, each giving you about a 1.8% return: Equaling about a 5.4% return per month. With 12 investment cycles and compounding interest, this is adding up to an 88% return per year, while you always trade with a defined risk (stop) and a specified target.
To participate in all market moves, you need to have short selling strategies in your trading repertoire that allow you, even when you trade out of an IRA or account below $25,000 (SEC regulation) to participate in downside price moves. We teach those strategies in our individual sessions and support you by hundreds of pages of clear cut documentation.
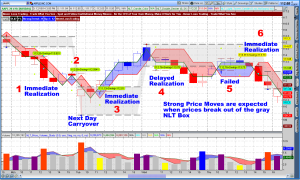
Liquidity Providers: Market Makers, ECN’s, and Wholesalers are another important market force and you can spot and portrait their market action on the chart, by them being under the constant aim to adjust their inventory positions. In an efficient market they can only do that if they are able to worsen the position of other market participants. We just concluded a long-term project and built the NeverLossTrading Swing Point Concept, which lets you spot and follow liquidity provider market actions:
Chart-3: AAPL 1-Hour NLT Swing Point Chart
Swing Point Chart AAPL 1 Hour (2)
The strength of this concept is that it helps you to find chart situations with a higher expected reward than risk on a high probability price-move-setup.
All NeverLossTrading systems are modular and adaptive to each other. Many of our clients decided to trade with more than one NLT system to increase their participation rate and trade accuracy:
Making money trading is all about probabilities, earns and turns.  
To experience how you can spot and follow institutional money moves:
Schedule your personal consulting hour:
Call +1 866 455 4520 or contact@NeverLossTrading.com
We are looking forward to an exciting interactive session where you call the symbols and we show you how high probability trade setups can help you to turn into the trader you want to be.  
If you are not yet part of our trading tips and free webinars, please sign up here and we keep you up-to-date….sign up here.
Good trading,
Thomas

Monday, February 9, 2015

A Simple Way to Know Where Prices Will Go

Price has a memory: A price point once reached is used by institutional investors as profit taking or investing point.
Knowing this, watch in particular for candles with very long wigs: Mark the high or low price point of the wig and be surprised:
Our base trading concept is called TradeColors.com; in a four hour Mentorship, you learn to follow price continuation patterns, triggered by market followers: Fund managers (mutual funds, hedge funds, pension funds, ETF’s) and low risk investors (banks and insurances).
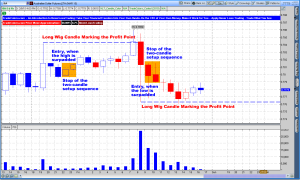
Let us take a look on a day trading chart:
  • Trade Entry after the high, low of a tow or more same candle color sequence is surpassed (highlighted in orange).
  • Target: Top or bottom of the long wig candle. 
  • Stop: Below the first candle of the trade initiation sequence.
Australian Dollar Futures 1-Hour Chart
Australian Dollar 1-Hour Long Wig Candle Trade
The Australian Dollar chart shows how this trade setup lead to two wonderful trades just in the last trading day:
  • Trade-1: Long with a $280 income perspective and a risk of $170 per contract.
  • Trade-2: Short with a $260 income perspective and a risk of $280 per contract.
You sure like the first trade setup with a higher expected return than risk, but how about the second, where the risk is higher than the expected return?
The probability for success of this trade setup is about 70%. If you put the reward and risk in relation to the probabilities of winning or losing and your return on risk is higher than 50%, you found a solid trade:
Validation: ($260 x 0.7 - $280 x 0.3)/ ($280*0.3) = 116%; and thus represents a very solid trade setup.
Learn to be a high probability trader: Call +1 866 455 4520 or contract@NeverLossTrading.com
Check or sign up for the TradeColors.com mentorship at our web site…click
Does this work for Swing Trading too?
Indeed: Check the daily AAPL Chart and see the precision of the two candle color short setups
AAPL Trade Colors Example
But if your type account does not allow for shorting stocks?
Then you learn to trade options to produce short setups in any account.
Learn to be a high probability trader: Call +1 866 455 4520 or contract@NeverLossTrading.com
Check or sign up for the TradeColors.com mentorship at our web site…click
Good trading,
Thomas

Tuesday, February 3, 2015

How was your trading in 2014?

In 2015, change is automatic, progress is not.

At this point in time, the New Year’s Resolutions are over.

A resolution means to resolve something.

Did you resolve, getting with your trading where you want to be?

Risk is the key determining factor in your trading:

Join our presentation at OnlineTraderCentral.com: Thursday, February 5, 2015, 4:30 p.m. EST.

Register here: http://www.onlinetradercentral.com/presenter_D7XHQQ.asp  and learn more about:
  •           How much risk to accept per trade
  •          Meaningful risk, giving the price enough wiggle room to come to target
  •         Position size in relation to the risk you take and the reward you plan to achieve

Your Trading System is supposed to help you defining those answers; however, most trading systems are purely mathematical based:
  •          Moving Average Based Systems: MACD, RSI, Bollinger Bands… Trade entry decisions are made based on average past price performance.
  •          Pattern Based Systems: Elliott Wave, Cup and Handle, Head and Shoulders… Trade entry decisions are made based on an expected price continuation pattern.

By not following real-time market transactions, those indicators lag and have a lower probability to bring you where you want to be: 

Hence, you are trading with an increased risk.

Learn how to use an activity based trading system: NeverLossTrading, which helps you to spot and trade along with institutional money moves.

Experience more details at our upcoming presentation at OnlineTraderCentral.com:

Thursday, February 5, 2015, 4:30 p.m. EST.


If your time does not allow, we are happy to give you a personal demonstration:

Call: +1 866 455 4520 or contact@NeverLossTrading.com to schedule a personal consulting session.

We are looking forward being with you and helping you to turn into the trader you want to be.

Thomas