Successful traders have a system, which is portraying key price turning points that have a high probability to conclude in the desired direction and are repetitive. In addition, such setups need to have clearly defined entries (spelled out price thresholds), exits (dots) and stop levels (red lines on the chart).
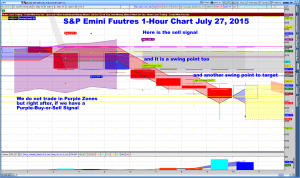
Emini S&P Futures Trade on the 1-Hour Chart, July 27, 2015
This morning, the S&P 500 Emini Futures started the European session in a Purple Zone, signifying ambiguity: Institutional investors are not clear about the trade direction. As a result, we stay out of trades, even so signals might occur; until the Purple Zone ends in a directional price move signal:
The Purple Sell> $2068.75 occurred in the 6 a.m. candle and got confirmed in the 7 a.m. candle, leading to a short trade, producing a 3-point gain.
Simultaneous, an NLT Swing Point signal was painted, pointing in the same direction (double confirmation).
The minimum target for this trade was $2065.50 and it was reached in the 7 a.m. candle.
At the 8 a.m. candle another Swing point signal that was confirmed and came to target at $2060.75, giving you a 3.5-gain.
At times we get asked, why we offer multiple systems: To increase your participation rate.
What you see is activity based trading chart, following institutional money moves.
We teach you how you can spot and follow those trades on your own charts:
All mentorships are individually taught and focused on turning you into the trader you want to be.
To experience how NeverLossTrading works live, do not hesitate to schedule your personal consulting hour:
To experience how NeverLossTrading works live, do not hesitate to schedule your personal consulting hour:
Call: +1 866 455 4520 or contact@NeverLossTrading.com
We are looking forward to hearing back from you:
Thomas
| NeverLossTrading A division of Nobel Living, LLC 401 E. Las Olas Blvd. - Suite 1400 Fort Lauderdale, FL 33301 |


No comments:
Post a Comment