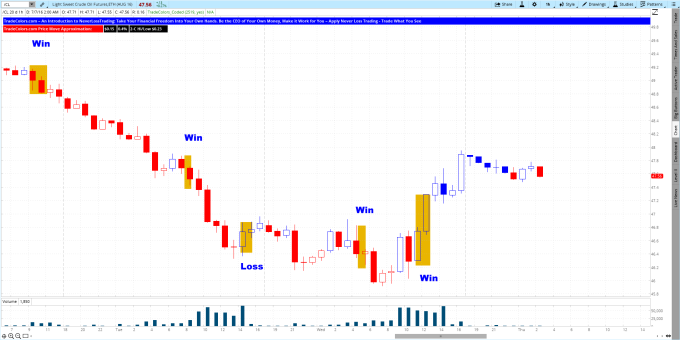
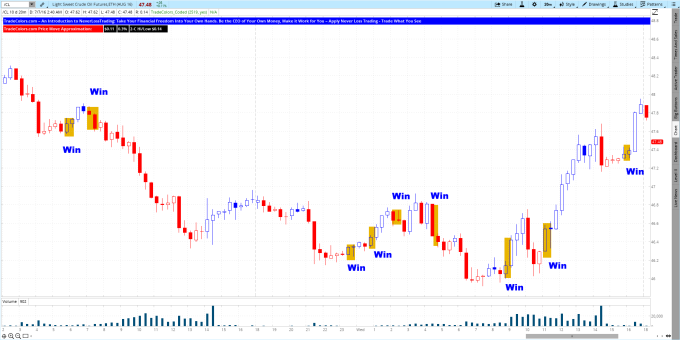
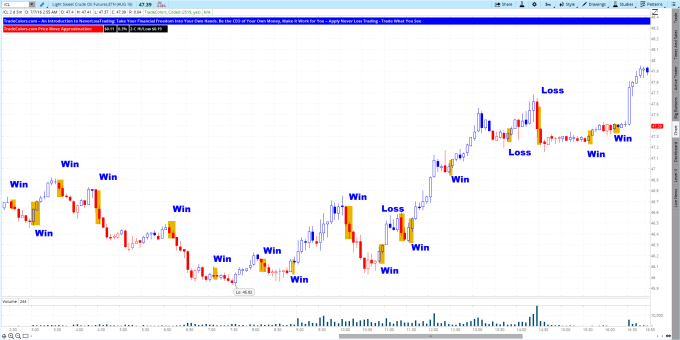
This morning, we had a request from a potential client, who wanted to see trade situations in the last couple of days on TradeColors.com for Crude Oil Futures, on client preferred time frames: 1-hour, 20-minutes, and 5-minutes.
Hence, we put together a series of charts, highlighted algorithmic based trade setups with orange rectangles and the results were pretty impressive for our basic system and this might make a difference for you:
Crude Oil Futures, 1-Hour Chart, July 4 – 7, 2016

Trade Entry is when the low of a new two-red-candle sequence is taken out by the next candle or when the high of a new blue candle sequence is taken out by the next candle.
This way you can operate with sell- or buy-stops and your order will only be filled if the price direction assumed is confirmed.
Orange rectangles specify new two-candle-setups
Bar-by-bar the system calculates the minimum expected price expansion of a trade at entry and you have two choices:
- Momentum trade: you exit at when the specified price expansion is reached.
- Trend trade: you trail your stop.
The highlighted chart situations refer to the momentum trade where we enter for a pre-specified price move and exit at target. Highlighted are only directional confirmed setups.
All details will be taught in individual training sessions, each is recorded.
In addition there is an 80 page document explaining the details of the system and individual trade situations.
Crude Oil Futures 20-Minute Chart, July 5 and July 6, 2016

Crude Oil Futures 5-Minutes, July 6, 2016

If you feel this could be a start for you into the world of high probability trading, call us at 866 455 4520 or contact@NeverLossTrading.com for a live demonstration.
We are looking forward to hearing back from you


No comments:
Post a Comment