Spot and Trade Institutional Money Moves

Algorithmic Trading with Human Interaction for:

Day Traders, Swing Traders, Long-Term Investors

Showing posts with label Institutional Money Moves. Show all posts

Wednesday, March 24, 2021

Measure and Follow Money Flow

 The basis of NeverLossTrading is to measure and follow money flow: a powerful approach for high probability trading and investing.

Where is the edge:

As a private investor, you are faster in out of positions than institutions can do.


We use complicated algorithmic models to indicate when to expect directional price moves and how far they shall reach. But you do not need to be concerned about the math; our systems put clearly defined entry, exit, stop-conditions on the chart for you: easy to read and follow. Here a day trading example:

NLT Timeless E-Mini S&P 500 Futures, March 23, 2021


The NLT Timeless approach takes time out of the cohesion and concentrates on the price change as the triggering element to trade:

What you see on the chart:

1.  Sell Signal: Sell < $3,922.8, and in the price movement of the next candle, the set price threshold for a sell-stop order was surpassed and triggered a short trade.

2.  Target-1: Gray dot on the chart, standing for the short-term trading goal. Here about 8-points or a value change of the underlying futures contract of $400.

3.  Target-2: Further out target, we trail for with the red line of the NLT Double Decker, framing the price move in red.

4.  NLT Lime Line: A price gravitation line. Ther, we assume price accumulation but also a pressure for prices to get to this level. In our case, the NLT Lime-Line and target-2 coincide and allowed for a 22-point price change or a value change of the underlying futures contract of $1,100.

5.  The chart shows muliple price continuation signals on the way down, which we appreciate but disregard while we are in a trade.

The system sure works for other assets too, and if you are interested to learn more: contact@NeverLossTrading.com, Subj. TimeLess

Institutional investments dominate more than 85% of the financial markets. Price is the result of a change in supply and demand. It is good to know where the institutional money goes; such, our indicators mapped out the sectors with extraordinary attention during the trading day of March 23, 2021. The NeverLossTrading indicators highlighted sectors NLT Power Tower setups (exceptional happenings): indicating selling pressure in the sectors of Biotech and Gold Miners.


Today, March 24, 2021, at 8:30 a.m. ET, Durable Goods orders will give an indication for the industry sector development, which had selling pressure yesterday. At 10 a.m. ET, Federal Reserve Chair Jerome Powell testifies before Congress, providing a broad overview of the economy and monetary policy. Powell's prepared remarks are published ahead of the appearance on Capitol Hill. We report more details on our NLT Alerts, where we list stocks and funds with a price move indication.

Follow our market indications on Instagram: https://www.instagram.com/neverlosstrading/

We focus on teaching systems and strategies to operate in the financials market one-on-one, at your best available days and times.

Let us be your guide to a consistent trader and investor and schedule a free consulting session, where you can see live what our systems can do for you:

contact@NeverLossTrading.com Subj: Consulting Hour

Working one-on-one spots are extremely limited: Do not miss out!

For more of our free publications and webinars…sign up here.

We are looking forward to hearing back from you.

www.NeverLossTrading.com

Disclaimer, Terms and Conditions, Privacy | Customer Support


Wednesday, January 27, 2021

Trading and Investing Imperatives


Summary: We explain what is needed to be a consistent trader or investor and formulate the action steps to chose and follow. Read on and watch the video.

We distinguish trading or investing by the time of holding a position:

-      Trading: shorter-term like day trading (opening and closing positions the same day or Swing-Trading (holding position for a couple of days)>

-      Investing: holding positions for multiple days, weeks, months.

About 80 million people have IRA or 401 (k) accounts in the US, mostly focused buy-and-hold. About 25 million margin accounts are held, with about five million frequent traders trying to control their financial destiny and do not leave it up to a money manager.

Unfortunately, only a small percentage of the traders/investors understand trading imperatives and why they are essential for long-term success.


At a 50:50 chance, 76% of the private investors lose money, even by copying the most successful traders' entries.

If you want to receive the background on 76% of retail traders lose money: contact@NeverLossTrading.com Subj.: 76%


What is missing?

An easy explanation:

When you know or can copy successful entry strategies: Stop, and positive exit are still unknown variables that need to be controlled to achieve trading and investing success.

Let us talk about stops first:

·       Tight stops lead to always being stopped, and then trades commences in the desired direction, and you are not part of it.

·       Wide stops: then risk and reward get out of balance, and you lose more than you win, and such, trading has a negative outlook.

This is where you need a system that tells you how far a price move most-probably will last and where to place your stop for bringing your trade to target without being stopped on the way.

In essence: Perfect entry conditions, like in stock tips, still will not make you a profitable trader.

Bringing the critical variables together: Mechanical, clearly defined rules are needed from your system to make you a profitable trader or investor:

-      System defined entry

-      System defined exit

-      System defined stop

Important: Rules are of need, regardless of the time you intend to hold a position.

Let us talk about average attainments of money managers and private investors in IRA and 401(k) accounts, where most leave their financial future up to money managers:

95% barely make it to produce results as the index: S&P 500, DOW, NASDAQ, Russell, others:

Fidelity Software and IT Fund compared to S&P 500


The chart shows a six-month comparison, and the Fidelity Fund performed negative 3.1% below the overall market. However, for technology, we should compare against a technology index and do so:

Fidelity Software & IT Fund compared to XLK (SPDR ETF)


Compared to XLK, the SPDR Technology ETF, Fidelity had a negative 9.2% development.

If you do not care about your money, nobody else will!

The key to successful longer-term investing is operating with a system to tell when to buy or sell:

Swing Trading Example: AAPL Daily Chart


On January 20, 2021, the NLT Top-Line indicator and scanner reported an opportunity:

·       Buy if the price development of the next candle > $132.49

·       The price threshold was surpassed on January 21, 2021

·       The second dot on the chart indicated the exit or target: 138.47 (4.5% return on cash, 9% on margin in one day)

·       This target was reached on January 21, and the trade either was closed or trailed with the red stop-line on the chart, and you would still be in it.

Swing Trading Example: JPM Daily Chart


On January 6, 2021, the NLT Top-Line indicator and scanner reported an opportunity:

·       Buy if the price development of the next candle > $132.77

·       The price threshold was surpassed on January 7, 2021

·       The second dot on the chart indicated the exit or target: $140.13 (5.5% return on cash, 11% on margin in 5 days)

·       This target was reached on January 12, and the trade either was closed

·       On January 15, 2020, the alarm bells were ringing on JPM, indicating that the stock has a high tendency for falling prices, and it happened when the system spelled out price threshold was surpassed to the downside

This shall show you how we systematically find and execute investment opportunities with quality stocks that allow risk limited trading strategies, executable from any account.

Day trading in itself is another limited risk strategy by preventing the risk of overnight gaps. Here is a recent example:

E-Mini S&P 500 Trading Chart, January 25, 2021


The chart shows eight trade situations, where seven were winners. To get all the details involved, please watch the video.

When you work with us, we offer you two configurations of NLT Top-Line with either 10 or 20 hours of training.

Trust me; you want the training; it will be eye-opening!

You learn how to operate with mechanical trading decisions in all of your accounts, covering the topics laid out in the following chart:  


NLT Learning Program Overview


Let us be your guide to a consistent trader and investor and schedule a free consulting session, where you can see live what our systems can do for you:

contact@NeverLossTrading.com Subj: Consulting Hour

Working one-on-one spots are extremely limited: Do not miss out!

For more of our free publications and webinars…sign up here.

We are looking forward to hearing back from you.

www.NeverLossTrading.com

Disclaimer, Terms and Conditions, Privacy | Customer Support

Friday, August 21, 2020

Trading for Predefined Price Moves

 As a trader or investor, you want your actions not to be predictable. 


Right from our research desk, we show you an example of how to trade for system-defined price moves: 

  • Limiting risks
  • Operating with upside opportunities
  • Trading along developing trends and key price turning points

Experience in less than five minutes how this can change your trading: 

Watch our short video…click. 

This image has an empty alt attribute; its file name is intro-volatility-and-market-timing.png

We hope this catches your interest. 


If yes: Let us get super interactive, and we meet with you in a one-on-one meeting online to test how it runs live. We want to have a content filled conversation with you.


No, there is no charge, I just want to make sure it's GOOD ...and the only way that can happen is if you get personal attention. That's why I only want twenty individual conversations max.

Schedule your consulting hour:

Call +1 866 455 4520 or contact@NeverLossTrading.com 

We are looking forward to hearing back from you.

Sign up for our free trading tips, webinars, and reports...click.

Disclaimer, Terms and Conditions, Privacy | Customer Support

Friday, February 24, 2017

Which are the Best Stocks to Trade?

A big question-mark: 
question-markt
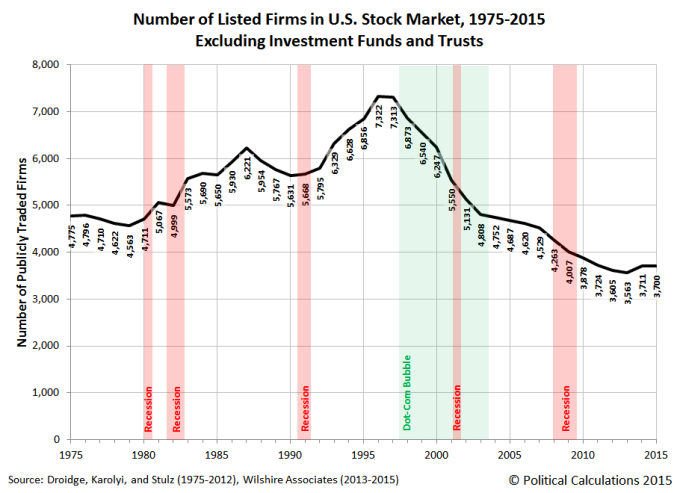
The US Stock exchanges lists about 3700 different stocks traded in the US, excluding Investment funds and trusts.
If you are not yet signed up to our FREE Trading Tips, Webinars, Reports…sign up here.
stocks-trades-at-us-exchanges
But which are the best stocks to trade?  
  • Stocks with a sound volume.
  • Most important: Stocks with an indication for a directional price move.
  • And, stocks with a solid option chain, option volume and open interest.
Unfortunately, most retail traders do not follow those principle, they trade:
  • Stock that are recommended.
  • The same set of assets over and over, even so they might not move.
  • Without having a repair strategy at entry, in case the trade goes wrong.
If you like what you see and you are ready to see how our systems perform live:
Call +1 866 455 4520 or contact@NeverLossTrading.com
If you are not yet signed up to our FREE Trading Tips, Webinars, Reports…sign up here.
By training and coaching one-on-one, spots are extremely limited, so do not miss out.
Good trading,

Tuesday, December 27, 2016

Inertia in Trading

Newton's first law of motion - sometimes referred to as the law of inertia: An object at rest stays at rest and an object in motion stays in motion with the same speed and in the same direction unless acted upon by an unbalanced force.
nerwtons-las-graphic
Unfortunately, Newton’s law of inertia accounts for many traders and investors, who never progress to the next level; boxed into their own paradigms:
  • I only trade /ES Futures and SPY.
  • I am trading from a 1-minute chart.
  • I am only participating in upside opportunities by trading from an IRA.
  • I am not profitable, but I only trade 3:1 opportunities.
Unfortunately, it is our human nature to repeat behavior patterns; even so they did not lead to the desired results.
When at times, we are telling new students that one definition of insanity is:
“Doing the same over and over and expecting different results”.
When this is said, everybody has a good time and smiles, until realization kicks in:
  • Who is telling you that you can only trade /ES and SPY: Do those prices even move?
  • Why to consider a 1-minute time frame: You are trading in the middle of volatility, with the odds in your disfavor?
  • You can trade both strategies, long or short from any account; you just need to know the applicable trading strategies?
  • How do you know in advance a 3:1 opportunity arises; however, if this worked for you, why do we have a reason to talk?
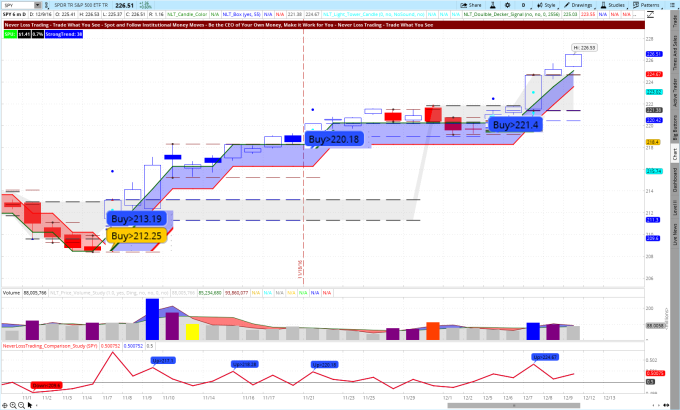
Did your system invite you recently to the following long opportunities?
SPY Daily NLT Top-Line Chart, November 1 – December 9, 2016
spy-november-1-to-december-9-nlt-top-line
In our mentorships, we teach you the details of how to enter with multiple trading strategies when the spelled out price threshold: Buy > $221.40 for example is surpassed in the candle following the signal candle. Why is that important?
You want to trade confirmed directions, where institutional leaders initiated a move and the market follows. This way you can work with buy-stop and sell-stop orders, allowing you to pre-program your orders without the need for sitting in front of your computer at trade entry and exit.
Take a look at the NeverLossTrading Price Move Model:
Price Move Expectation
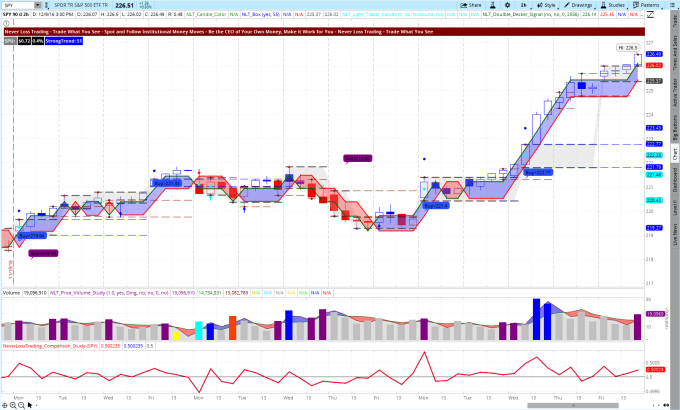
How does it look at lower time frames?
SPY 2-Hour NLT Top-Line Chart, November 18 – December 9, 2016
spy-2-hour-chart-november-18-to-december-9-2016
The 2-hour chart displayed five confirmed directional opportunities, four of those lead to the desired result and one to a stop: An 80% attainment rate.
Consider putting an end to your trading inertia:
  • Only those traders that are up for a change have a chance to make money.
  • You need to trade with clear cut rules at system specified entries, exits, and stop or adjustment levels.
  • Understand when and how to appraise the odds of every trade situation and only risk your money when the odds are in your favor.
  • Have a system, follow the system, and act upon multiple time-frames, multiple trading instruments and multiple trading strategies.
We are in the trading education business since 2008. With us, you have the pleasure to learn at your preferred days and times. Check our offering…click.
Find a system that suites your wants and needs and we are happy to organize a personal demonstration:
Call +1 866 455 4520 or contact@NeverLossTrading.com
Teaching one-on-one, spots are extremely limited, so do not miss out.
We are looking forward to hearing back from you,
Thomas

Friday, December 16, 2016

Give Yourself a Trading or Investing Gift

If you trade or invest how you’ve always done, you will get what you’ve always gotten.
Alter this quote a little and it applies to most things in life.
Give yourself the gift of personal growth and transformation, so you can create real, lasting change in yourself and for others through your trading and investing activities.
gift-advertisement
When your current trading or investing scheme does not get you where you want to be, why do you expect a different result without making a change?
Why does it not work for you?
Most likely, you are using a system that is not reflecting the actual happening of the markets (institutional money moves); by applying a mathematical model that does not filter signal from noise:
  • We define a signal as a pre-stage or continuation stage of a directional price move.
  • Noise is a random happening that does not qualify for a significant predictability to a directional price move.
  • We define signal-significance for those with an average predictability above 63%.
  • Same type signals have to repeat themselves on multiple time frames, tick frames, ranges, for all assets; while you need to consider meaningfulness to trade outside the noise level.
Signal and Noise: Do you Trade at Significant Price Turning Points?
signal-and-noise-example-overlay-with-tsla-weekly
Based on our statistics, standard indicators: Moving Averages, Bollinger Bands, MACD, Candle Patterns, and others, lead to a positive expectation, however at an average 53-55% predictability; thus, below our desired level of significance. Click here to experience what a change to a higher probability trading system can do for you.
However, the level of predictability alone will not get you to where you want to be:
  • You need to know how to find assets with a price move.
  • Money management is essential to prevent drawdowns.
  • Risk management is an imperative to evaluate every situation to decide if the odds are in your favor and what size position you take per trade setup.
  • Do you review what worked and what did not and how to make changes?
  • Are you following a business plan for trading success (financial plan and action plan), so you always know what to do, when, and how?
In our mentorships, we extend this list of principle actions for retail traders and give you the tools on hand, needed for your trading or investing in the financial markets; sharing more than 30 years of experience, manifested in clear cut algorithmic trading rules, with defined: entries, exits, and stops or adjustment levels.
Let me give you some examples:
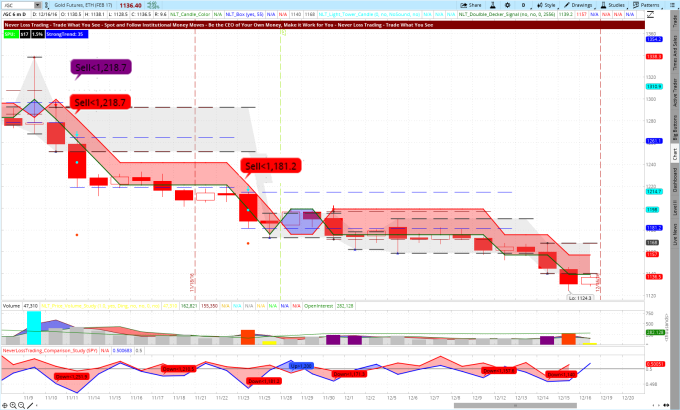
Gold Futures, Daily NLT Top-Line Chart for November 8 to December 16, 2016
golld-nlt-top-line-november-8-to-december-16-2016
The above chart shows you two clearly defined entries: Sell <$1,218.70 and Sell <$1,181.20, allowing you to operate with sell-stop orders, which only got you in the trade when the set price threshold. The red dot on the chart identifies the price level for the first exit and by our algorithm, we assume to get there in the next one to ten bars. Both trades lead to winners and you will learn all the rules and decision making base to operate with our indicators and charts during our mentorship, which always includes a coaching session with feedback on real time trades.
If you wanted to trail your stop on the above chart, you do this with the red line, which sits on top of the red momentum based frame and is called the NeverLossTrading Double Decker Study.
Does that also work on lower time frames?
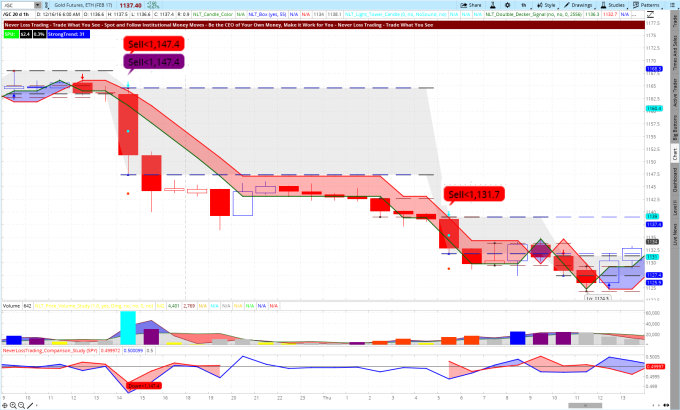
Gold Futures, 1-Hour NLT Top-Line Chart, December 14-15, 2016
gold-futures-1-hour-nlt-top-line-chart-december-14-and-15-2016
Again, the chart called two trades that both came to target. However on the first signal: Sell <1147 .40="" a="" allowing="" and="" bar="" between="" bigger="" candle="" chart.="" cyan="" dot="" ends="" for="" happenings:="" in="" light="" line="" most="" moves="" nlt="" occasion="" on="" p="" price="" probably="" red="" see="" starts="" stop="" such="" the="" to="" tower="" trade="" trailing="" two="" volume="" we="" what="" with="" you="" your="">
If you rather want to participate in the price move with options or ETF’s, you can learn those strategies in all details during the mentorship program.
For every trader or investor, it’s easy to get caught up in our own minds, or worse, taking bad advice from an inferior system; paying the markets without gaining knowledge or skill.
Think this over as you head into 2017, and if you are ready for a change, check our offering...click, and let us know which system might fit your wants and needs and we are happy to give you a personal, live demonstration:
Call +1 866 455 4520 or contact@NeverLossTrading.com
By teaching and coaching one-on-one, spots are extremely limited, so do not miss out.
We are looking forward to hearing back from you,
Thomas

Sunday, December 4, 2016

High Probability Trading and Investing

“It's tough to make predictions, especially about the future.”
This quote, given by the famous baseball player Yogi Berra already summarizes the problem trader’s constantly face: Finding repetitive situations, where the future price move of an asset can be predicted with high probability.
Trading systems shall provide you with a structured approach to tell which situation to consider and which not: where to place your entry, exit, and stop or adjustment level.
But what is high probability compared to the opposite: low probability?
Our definition is easy: A system that gives you trade setups, verified by past performance, where you have a >63% probability to predict the future price happening is high predictability and everything else is low probability.
Let us give you some examples:
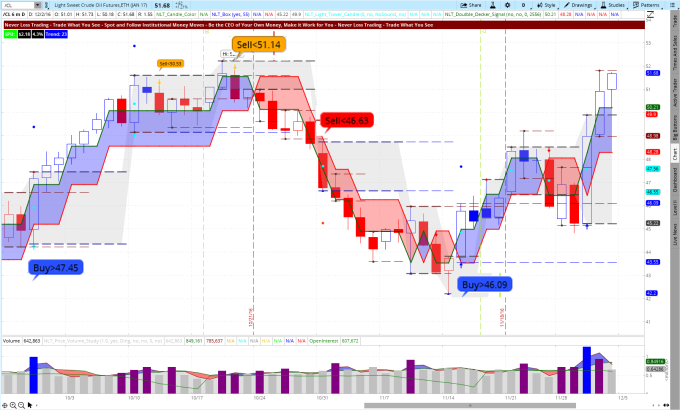
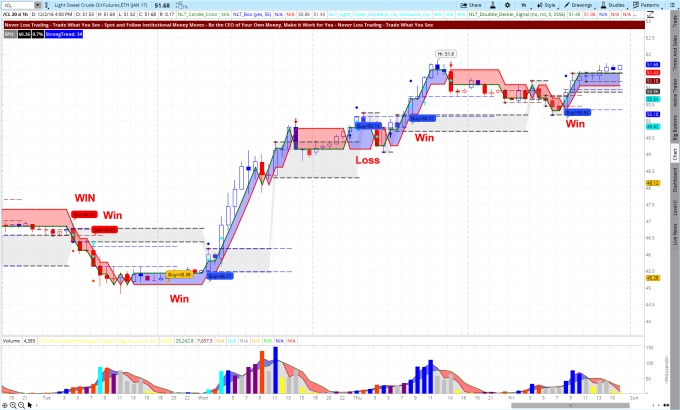
NeverLossTrading Top-Line Chart for Crude Oil: September 26 – December 2, 2016
crude-oil-nllt-top-line-september-29-to-december-2-2016
The NeverLossTrading Top-Line chart shows you five potential trade situations that all have an easy condition to specify your trade entry:
The spelled out price threshold: Buy>$47.45Sell<$46.63 has to be surpassed in the next candle. Only when this is given, you accept the trade; allowing you as a trader to work with buy-stop or sell stop orders. This way, you do not even have to be in front of your screen: you can preprogram your trades to this condition and have them auto-filled.
When you check the above chart, following this principle mechanically, lead to four winning trades (magnified) and one losing trade (first orange signal from the left): winning four out of five, gave our system in the observed time frame an 80% predictability and thus, high probability!
When you consider the following simple exit rules: At red and blue signals, consider that a price move that starts in a NLT Light Tower (candles with a cyan color dot), likes to end in a NLT Light Tower. In addition: you are in average, five bars in a directional trade on those signals. Putting this together, is giving you an easy game plan to follow. On orange signals, we even like to trade for 10-bars.
But what to do if your risk tolerance does not allow you to trade daily crude oil charts?
We teach you how to trade derivatives, scaling your risk levels in $50 or $100 increments.
Does that also work on lower time frames?
Absolutely, we us fractal based mathematical models, focused on spotting and following institutional money moves and this way giving you repetitive happenings: let us put a proof to it!
 NLT 1-Hour Top-Line Chart for Crude Oil, November 29 to December 2, 2016
crude-oil-nlt-top-line-1-hour-chart
The chart shows you six trade situations that were validated by the next candle ticking out the set price threshold, leading to five winners and one loser: 83% probability for success in the observed time frame.
We teach our systems one-on-one, focusing on your specific wants and needs: NLT Top-Line is our top of the line; however we also offer entry level systems and allow traders to upgrade later, discounting the tuition payment from the price of the upgrade.
Take a look at our offering…click and let us know which system you want us to give you a personal demonstration on.
Call +1 866 455 4520 or contact@NeverLossTrading.com
By teaching one-on-one, spots are extremely limited, so do not miss out!
We are looking forward to hearing back from you,
Thomas

Saturday, November 26, 2016

Trade Touchdowns at Price Turning Points

Are you trading at price turning points?
We provide you with systematic, software, strategies, a business plan (financial- and action plan), coaching, documentation; in recorded one-on-one training session, helping you in developing yourself into the trader you want to be.  
Our trading systems provide you with systematic repetitive entries, exits, and stops; then you can act like a sport’s pro: lining up, getting to your position, catch, and touchdown.
touchdown-by-neverlosstrading
What you want and need to be a successful trader has to be learned, practiced, and coached.
We are teaching one-on-one, showing you how to follow the activity of institutional investors with multiple systems for all asset classes: Stocks, Options, Futures, FOREX.
Let the chart tell when to buy or sell; however, you always remain the chief commander, who is in charge of the final decisions:
Computers are faster, humans are smarter.
In our mentorships you will learn how to combine both virtues into powerful acting.
Let us check for a few recent examples:
BK Daily NLT Top-Line Chart, 10-7-2016 to 11-25-2016
bk-nlt-top-line-example-november-2016
Table-1: BK October and November 2016 Trading Results
SignalReachTargetResult
Red Sell>39.79Target dot or 5-barsBoth targets reached1.3%-Return
Orange Buy>39.8610-barsTarget reached9.6%-Return
Blue Buy>42.34Target dot or 5-barsBoth targets reached3.2%-Return
Blue Buy>44.04Target dot or 5-barsBoth targets reached7.7%-Return
Add this up, compound your interest, and check and balance with your today’s results.
How do you know that this stock had such signal?
The NLT Top-Line user has two choices:
Is the chart above an exception?
No: Institutional investors constantly move money in or out of an asset or asset class. Our programs, scanners, and indicators are programmed to detect institutional money moves in a pre-stage, allowing you to be part of the price move when it happens:
  • With a pre-defined time in the trade.
  • At a pre-defined exit- and stop level.
Surely, stops can be trailed if desired: You use the red line of the chart to do so.
All of this you will learn one-on-one at your best available time, with months of free alerts and coaching, giving you the feedback you need to start your career as a trader or investor.
If you want to read yourself into what is needed to the trader or investor you want to be, you will find an easy summary in our book: Your Trading Career as a Private Investor, available at Amazon.
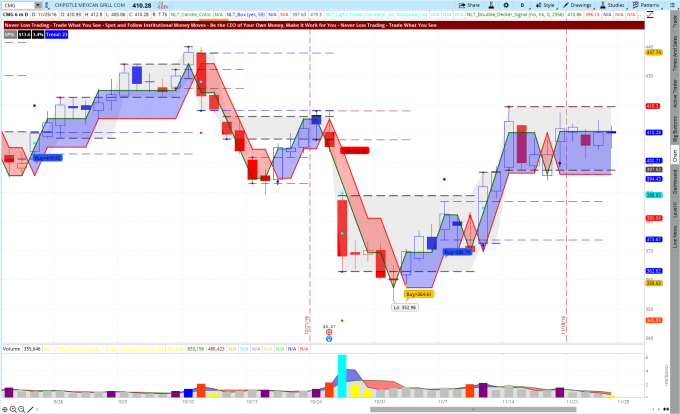
Here another example, where you find key price turning points highlighted by the NLT Top-Line signals.
Take part of the touch downs and ask for a live demonstration:
Call +1 866 455 4520 or contact@NeverLossTrading.com
CMG, Daily NLT Top-Line Chart, 9-20-2016 to 11-25-2016
cmg-on-the-nlt-top-line-chart-november-2016
Does the system also work on lower time-frames?
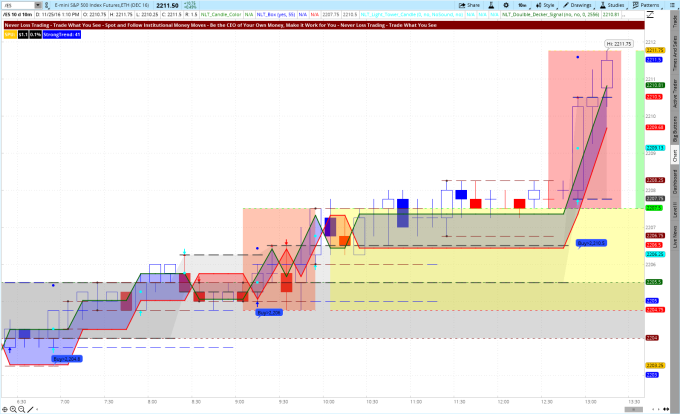
Absolutely: Let us display yesterday’s trading session: November 25, 2016 – Surely not an exciting day, a half-day session right after Thanksgiving.
However, there were three signals that called for a buy.
All of them got confirmed: The next candle ticked out the set price threshold. This allows you to operate with buy-stop or sell stop orders. Each of those trades ended to reach their target.
E-Mini S&P 500 Futures on a 10-Minute NLT Top-Line Chart
November 25, ES NLT Top-Line Chart.png
We offer multiple systems and you will find out in a personal session, which system or mentorship suites you best, please take a look at our offering…click.
Let us know what you are interested in and call +1 866 455 4520 or contact@NeverLossTrading.com for a personal demonstration.
By teaching one-on-one, spaces are limited, so do not miss out.  
Good trading,
Thomas