By our research, NLT weekly chart signals translate with a very high congruency into 4-hour trading opportunities. We do that as follows:
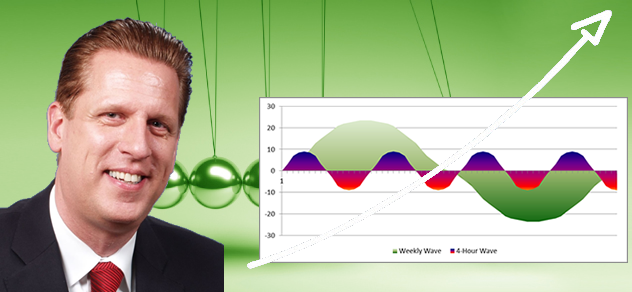
Weekly signals go on the four-hour watch list and are traded independent when an NLT signal occurs and is confirmed. See the wave coupling chart on the intro picture. With the NLT systems, you obtain a scanner alerting you and you also learn how to set chart alerts that go to text or email.

With the NLT trading method, you only trade when other market participants confirm the indicated trading direction.
Last week, we informed our students and subscribers that based on the current earnings declaration period, we rather prefer short-term to longer-term stock engagements and thus, put the following signals on our 4-hour watch list:
Trading Results 4-Hour Chart for Weekly NLT Trend Catching Signals
In case this table is hard to read, we had the following signals and attainment:
Let us give you an the chart demonstrations for NLT Trend Catching
Chart-1: FB 4-Hour Chart – one winning trade

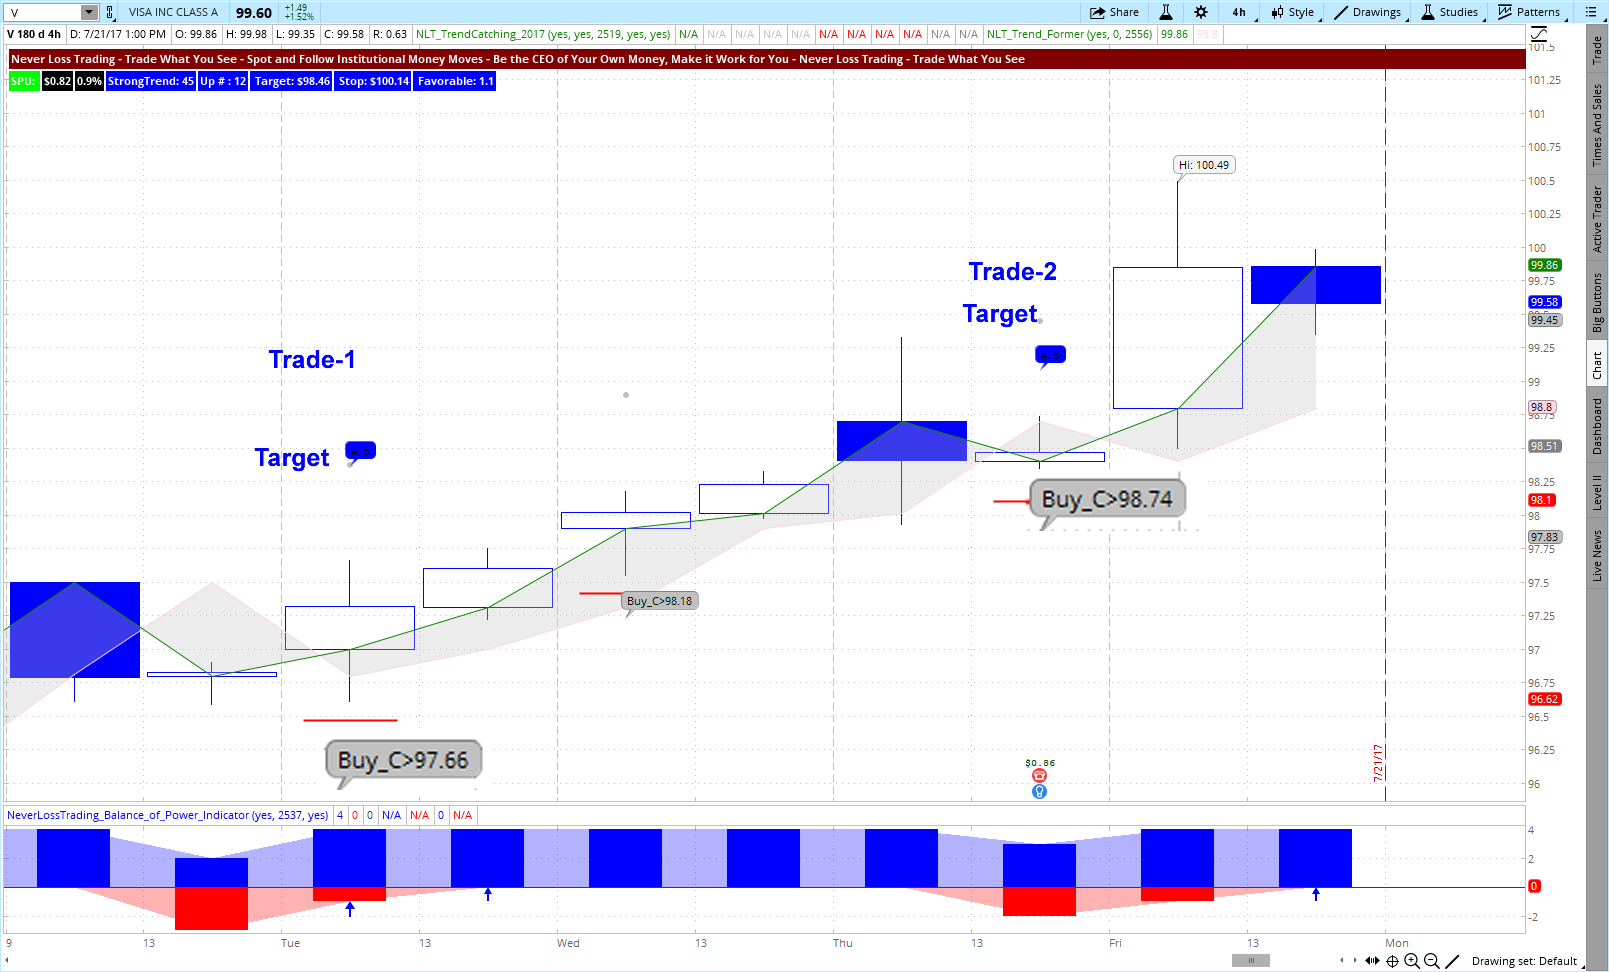
Chart-2: V 4-Hour Chart – two winning trades

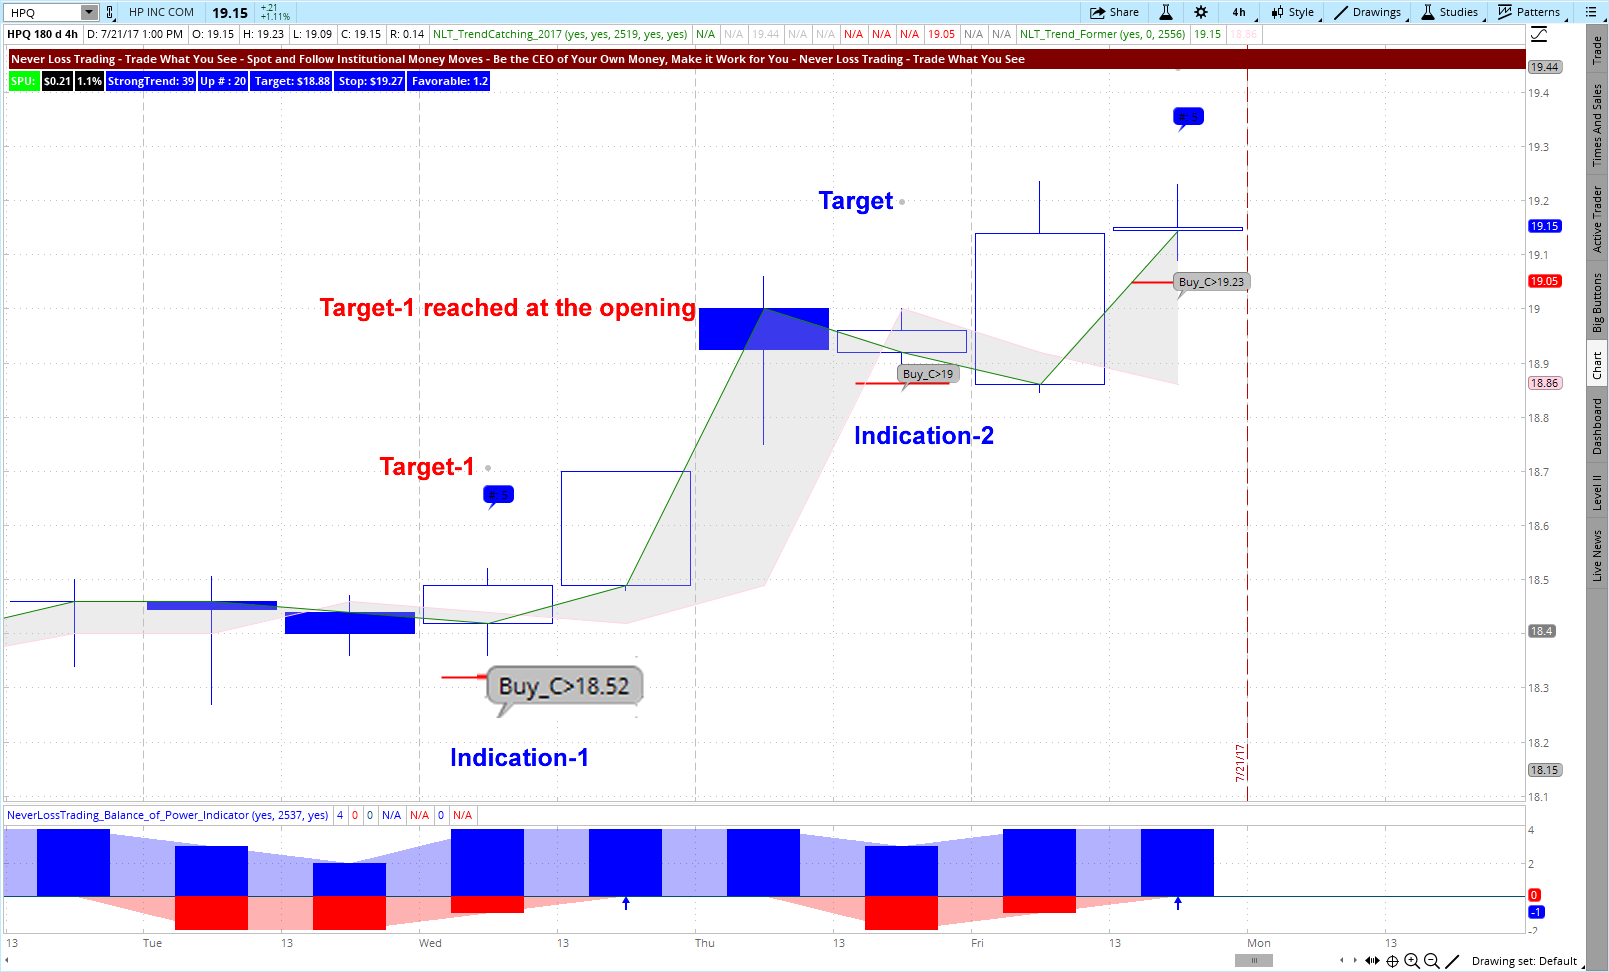
Chart-3: HPQ 4-Hour Chart – two winning trades

When you ask yourself where those signals came from? The NLT Long-Term Investor Alerts.
\
The NLT Long-Term Investor Alerts..click.
Besides stocks, we surely trade work with other assets. If you feel our trading style and systems can make a change to your trading, setup a consulting hour with us:
For more information: contact@NeverLossTrading.com or call: +1 866 455 4520
n case you have not yet participated in downloading a new trading book, where we wrote chapter 19, you can do this here: The entire eBook is Free Here
Good trading,
Thomas
www.NeverLossTrading.com
Disclaimer, Terms and Conditions, Privacy | Customer Support
Weekly signals go on the four-hour watch list and are traded independent when an NLT signal occurs and is confirmed. See the wave coupling chart on the intro picture. With the NLT systems, you obtain a scanner alerting you and you also learn how to set chart alerts that go to text or email.

With the NLT trading method, you only trade when other market participants confirm the indicated trading direction.
Last week, we informed our students and subscribers that based on the current earnings declaration period, we rather prefer short-term to longer-term stock engagements and thus, put the following signals on our 4-hour watch list:
- GM
- FB
- V
- HPQ
Trading Results 4-Hour Chart for Weekly NLT Trend Catching Signals
In case this table is hard to read, we had the following signals and attainment:
- GM (no signal – no trade)
- FB: one signal and a 0.9% return on cash in one day
- V: two signal and a 1.7% return on cash in two days
- HP: two trade signals, each came to target in the next candle and a 3.3% return on cash
Let us give you an the chart demonstrations for NLT Trend Catching
Chart-1: FB 4-Hour Chart – one winning trade

Chart-2: V 4-Hour Chart – two winning trades

Chart-3: HPQ 4-Hour Chart – two winning trades

When you ask yourself where those signals came from? The NLT Long-Term Investor Alerts.
\
The NLT Long-Term Investor Alerts..click.
Besides stocks, we surely trade work with other assets. If you feel our trading style and systems can make a change to your trading, setup a consulting hour with us:
For more information: contact@NeverLossTrading.com or call: +1 866 455 4520
n case you have not yet participated in downloading a new trading book, where we wrote chapter 19, you can do this here: The entire eBook is Free Here
Good trading,
Thomas
www.NeverLossTrading.com
Disclaimer, Terms and Conditions, Privacy | Customer Support


No comments:
Post a Comment