Summary: Join the world of high probability
trading by combining an existing system with the newly developed NLT SPU Move
Indicator to trade at critical price turning points.
A successful
trader has a systematic way to anticipate the future price action of assets
like stocks, futures, FOREX.
Not
successful traders act reactive and often start to enter into a price action
when it is right at the point where it ends, reverses and takes your money.
Unfortunately,
76% of the retail traders are losing money (get the details: email to contact@NeverLossTrading.com Subj. 76%).
Make a
difference!
In our
yearend offer 2021, we combine the newly developed NeverLossTrading SPU Move
Indicator with TradeColors.com or other NLT Systems, helping you to trade at
significant price turning points, and you get the second indicator for free: a
$3,997 value.
E-Mini S&P 500 Futures NLT
Timeless Day Trading Chart
Chart
Review
|
Entry
Rule
|
Signal
|
Result
|
|
Situation-1
|
Early entry into the price movement by
the lower signal, confirmed by the pride chart signal
|
win
|
|
Situation-2
|
Upper and lower indicators agree to go
short
|
win
|
|
Situation-3
|
Upper
and lower indicators agree to go short
|
win
|
|
Situation-4
|
Upper and lower indicators agree to go
short
|
win
|
|
Situation-5
|
Long trade by the lower indicator
|
win
|
|
Situation-6
|
Upper and lower indicators agree to go
short
|
win
|
In the example above, we used a range
bar chart where each candle is painted when a high/low-price-move of 40-ticks
is concluded (10 Points). In essence, you are trading for a minimum price
change of $500 per contract. The screenshot shows the price action from
September 29 to 30, 2021.
Does that mean a 40-tick chart has the superpower to
determine where the prices for the E-Mini S&P 500 Futures are going?
No, the tick range to choose is dynamic and throughout
2021 varied between 20 and 50 ticks. Our algorithm tells you the tick/range to select
for observing the price movement asset by asset going forward.
TradeColors.com is our introductory concept to
algorithmic trading, and with our yearend offer for 2021, we upgrade it by
adding the NLT SPU Move indicator (Find
more details in this publication…click).
We help traders in multiple dimensions:
· System-defined trading opportunities
at crucial price turning points
· One-on-one training suited to your
wants and needs at your best available times: learning classroom style is
inefficient. Each session is recorded so that you can repeat the learned.
· Executive teaching from a success
coach, experienced in bringing the best out of people, giving focus, sharing concepts,
providing calculations and documentation in mentorships to ensure you are on
the right path.
Indeed, this system also
works for time-based charts and all asset classes: stocks, futures, FOREX, and
their derivatives, like options.
Our systems formulate price
thresholds: Buy > and Sell <. Only when those are confirmed in the price
movement of the next candle, we enter into a trade. Thus, we always trade for a
pre-defined directional price movement and exit the trade when it is reached.
This way, you operate with mechanical rules that leave very little room for
interpretation.
SPY NLT Daily Chart (ETF of the
S&P 500 Index)
Chart
Review
|
Entry
Rule
|
Signal
|
Result
|
|
Situation-1
|
Early entry into the price movement by
the lower signal, confirmed by the pride chart signal
|
win
|
|
Situation-2/3
|
Upper and lower indicators agree to go
long, and the direction is re-confirmed during the price movement
|
win
|
|
Situation-4
|
Short opportunity by the upper and
lower signal
|
win
|
|
Situation-5
|
Upper and lower indicators agree to go
short; however, no trade, by the gap
|
no trade
|
|
Situation-6
|
Only the trade-color-combination-candles
direction was confirmed
|
win
|
|
Situation-6
|
Upper and lower indicators agree to go
long, but no trade by the gap
|
no trade
|
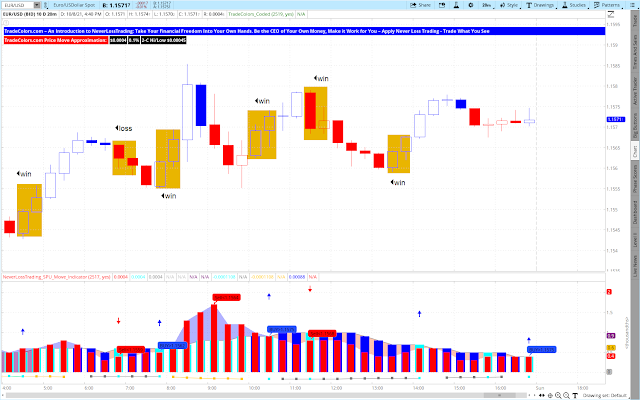
Our FOREX example demonstrates that the system also works on
short time frames; however, we encourage our traders to trade for meaningful
price movements to keep the odds in their favor.
EUR/USD 10-Minute Chart Example, October 8, 2021
Our systems
measure the underlying activity of supply and demand to define critical price
turning points.
Experience
live: contact@NeverLossTrading.com Subj. Demo.
We are a
primer education institution focusing on one-on-one training, where you and
your wants and needs are in focus.
Sign up for our free reports, trading
tips, and webinars.
Our yearend
offer:
Buy
TradeColors.com for $2,642 and get the NLT SPU Move Indicator for Free: a
$3,997 value.
This offer
is limited…do not miss out: contact@NeverLossTrading.com Subj: Offer 2021
www.NeverLossTrading.com
Disclaimer, Terms and Conditions, Privacy | Customer Support


