
Summary: We like to provide you with an overview of how to cope with the current financial market situation as a retail trader—a detailed explanation for a moment of reading time: a bit more than we can express in a Twitter-Note.
Where and how to trade and invest in 2023?
We expect another year of higher volatility and range-bound markets with a sound recession potential. As a result, longer-term buy and hold will certainly not be the strategy for 2023. Instead, a structured approach will be needed to yield returns.
Here are the decisive factors to consider:
Core Influences on the Financial Markets 2023

Learning to trade and invest takes more than reading 280 letters; hence be ready for some content-filled input!
Adding it all up, we have a sound basis for substantial volatility and a range-bound market with strong in-range price moves at essential news events. As a result, our focus will be on shorter-term instead of longer-term investments: Longer-term buy and hold will certainly not be the strategy for 2023—it even rhymes.
Our Trading Focus for 2023
- Day Trading Futures: E-Mini S&P 500 contract, Crude Oil, Gold, Euro with the NLT Timeless Concept, focusing on price-based developments rather than time-based price moves.
- Swing Trading: Stocks and ETFs and their options for 1-10 days with NLT Indications at crucial price turning points.
We share examples of indicator-based strategies for day trading futures and swing trading stocks in the following, picking event-based trading as an example:
The next earnings season will start on January 13, 2023, when the banks and investment houses report their fourth-quarter earnings. Our focal point will be JPM and BAC on January 13, followed by GS on January 17, 2023.
The hype of earnings declarations will come in the week of January 26, 2023, when AAPL and AMZN report and give their outlook for their sector worldwide. At the peak, over 150 companies report earnings in a single day, offering plenty of opportunities to participate in trades in and out of earnings with a solid system indication.
Are you ready for this?
Earnings reports contain various financial information on the corporate quarterly business’s performance, including balance sheet, income statement, cash flow, and market and sector performance.
When a quarter ends, public companies start to report their actuals and business outlook. Companies with a significant impact on their actuals and outlook are what the market spots for, and our systems provide solid ideas, and we want to share our thoughts with you on how to:
- Trading into earnings
- Trading out of earnings
- Limit your risk over earnings
Unfortunately, most portfolio holders take an unlimited risk by committing to company stock and holding it forever. We have been in a bear market since the beginning of 2022, and continuing such a strategy will be detrimental to you. Hence, we invite you to a different way of approaching stock trading: Stock trading is all about controlling risk. Suppose you can do this as a private investor. In that case, it gets you ahead of the curve. You participate with risk-limiting strategies where you trade the stock in combination with options, or you operate with pure options strategies to limit your risk and leverage your returns. To explain this, we best look at our systems’ most recent earnings declarations and pre-indications.
In the following example, we use NLT Top-Line, our flagship system; it highlights crucial price turning points with institutional engagement.
Trading in today’s market is not about what you think is happening. It is about that you see what is happening; hence, we let the chart tell when to buy or sell.
- Trading Into Earnings
At NeverLossTrading, we look about 20 trading days (four weeks) in advance of the earnings call for strong NLT price move indications. So what did our NLT Top-Line system project for the financial institution we track most: JPMorgan Chase & Co. (JPM), into the last earnings report:
JPM, Daily NLT Top-Line Chart, Sept. – Oct. 2022
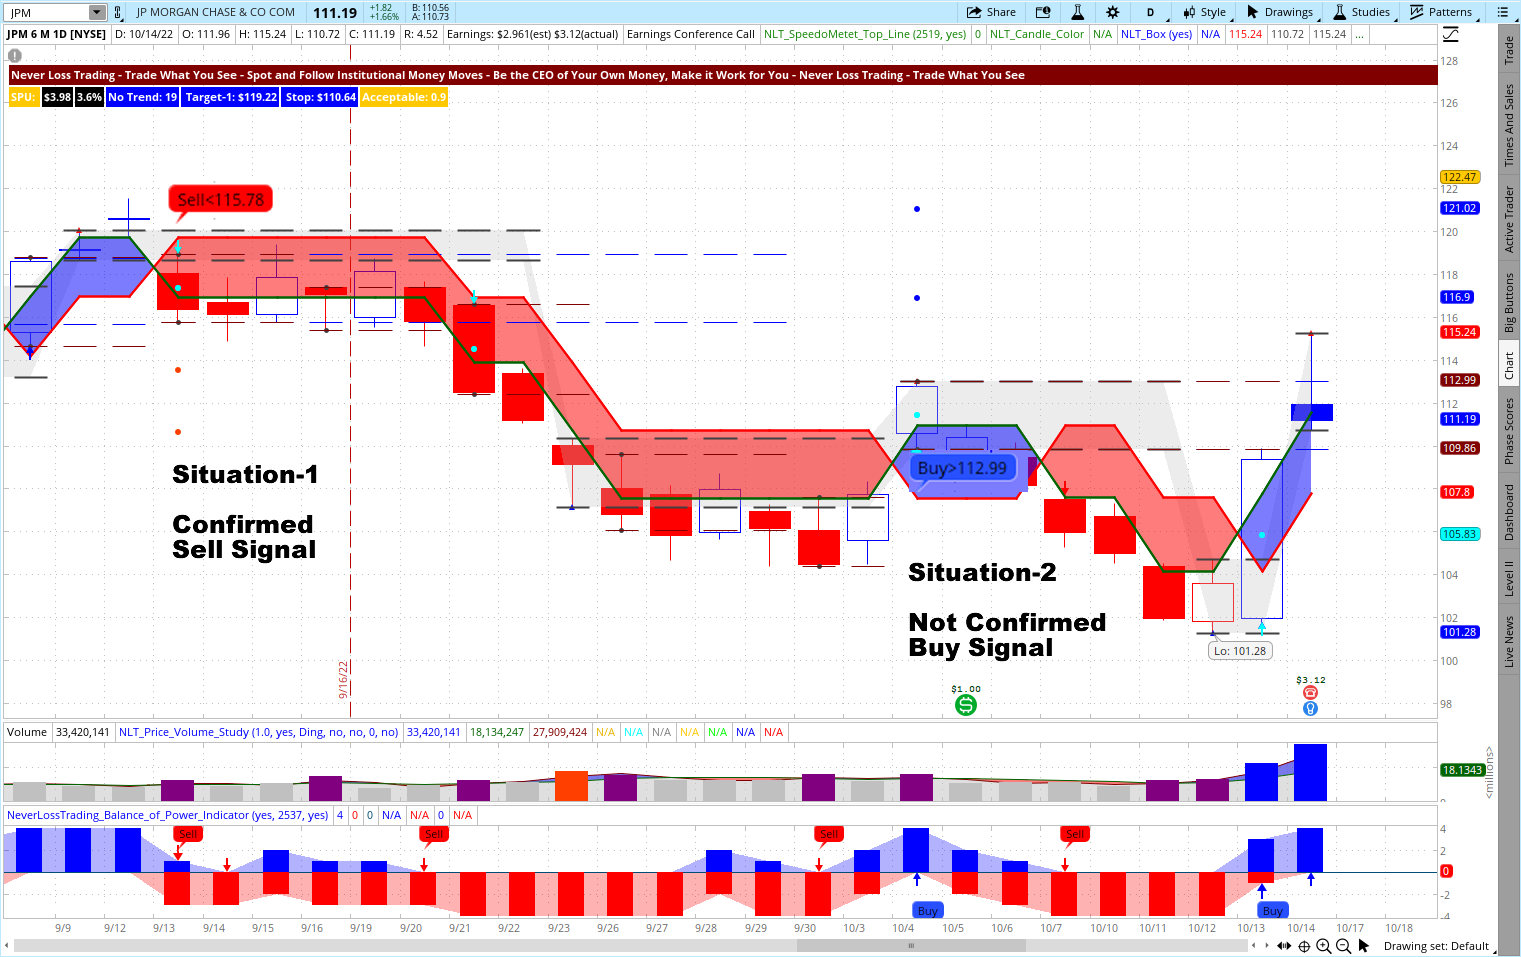
On 9/13/2022, the JPM chart showed in Situation-1 a sell signal: Sell < $115.78. Our system formulated a price threshold of $115.78; if the price move in the next candle surpasses the threshold, a short trade results.
At this point, you had a solid selection of opportunities to participate in the highlighted down-move potential of JP Morgan Chase Manhatten Co. (JPM), and we go through those briefly:
Short selling JPM Stock: in case you are trading from a margin account, JPM was ETB (easy to borrow), and such short selling was a simple strategy. The red line on the blue or red frame around the price development was the stop for the trade: $119.17, and the minimum expected price move was at the second red dot on the chart: $110.50. Hence, the risk and reward for the trade were in a meaningful balance and in your favor. However, the question is: do you have such instruments on hand to determine the target and stop?
On 10/4/2022 – Situation-2 – the JPM price radically reverted because $1 of a dividend was paid on October 5, and if you were short-stock, you had to pay this. Hence, whatever strategy you chose to participate in the downside move, you wanted to be out of the short position three trading days before the dividend was paid.
As you see, trading is all about preparation, and we teach you what to do in our mentorships.
Aside from short-selling stock on September 14, you had other alternatives:
- Selling naked call options (a strategy we do not recommend by not accepting unlimited risk)
- Selling vertical call spreads. In this strategy, you want to harvest the premium received; however, the danger is that your short leg comes into the money, and the stock will be called from you. Indeed, you are covered by the long leg of the trade, but you pay the dividend, which quickly can be more than the premium you received. Hence, another risky undertaking
- Buying Puts, where our systems and strategy help you to define:
- The time to expiration to pick
- The delta to choose
- The maximum price to pay
We teach what we call the NLT Delta Force Concept in our mentorships.
- Another way to limit your risk would have been to sell the stock short and buy Call options to limit the risk. But, again, for this undertaking, you need to know which strike price to choose and the maximum premium to pay.
In the case of JPM, our preferred investment strategy allowed trading with two NLT Put-Options strategies where the price for the option to pick met the system-defined maximum price we were willing to pay after the short-selling direction was confirmed. Here are three alternative ways to trade into earnings with Put options:
- If one chose our short-term strategy, where we planned to exit the trade when the second target dot was reached, a 250% return on investment resulted.
- Applying the longer-term strategy and exiting three days before the dividend, a 195% return was achieved.
- However, if investors were greedy and applied the max loss strategy, holding over earnings, an 80% loss would have resulted.
Knowledge is power, but common knowledge for operating in the financial markets is not the most common knowledge for private investors; hence, we are here to help and educate.
If you want to see how our systems work life, schedule a consulting hour: contact@NeverLossTrading.com Subj: Demo.
With decades of trading experience and more than ten years in the trading education business, you can participate from our expertise. Still, more importantly, our systems provide indications to act at crucial price turning points for you to act along.
2. Trading Out of Earnings
The actual achievement and outlook of companies change the demand for the stock. On the last earnings call, AAPL stock was already rising since our buy signal on 7/1/2022 (Buy > $137.35). The day before the earnings call, strong demand came into the stock and produced another buy signal, Buy > $157.33. The signal was confirmed in the price movement of the next day and resulted in a continued upwards price move, trailable by the red line of the blue frame around the price candles (NLT Double Decker).
To find such price move indications, you either subscribe to the NLT Alerts or operate with NLT Top-Line, where you find those opportunities with the help of scanners and watch list indicators.
AAPL Out of Earning Traded with NLT Top-Line Signals

On the chart, we highlighted two situations:
Situation-1: Before earnings demand for AAPL Stock, with confirmed direction.
Situation-2: At earnings demand for the AAPL stock with a minimum expectation of the price-move to the second blue dot on the chart.
The impact of earnings on a stock price is not an exact science. Here is a small selection of the factors that can impact a stock’s reaction to earnings:
- Earnings per share (relative to expectations)
- Sales (comparable to expectations)
- Profit margins (relative to expectations)
- Product unit sales (comparable to expectations)
- The company’s future outlook (relative to expectations)
- Comments made by executives on the conference call
- How much is the stock up or down before earnings
“Prediction is challenging, especially if it’s about the future;” hence, it is not uncommon for a company to beat expectations and share prices fall or report terrible earnings, and we see its stock rise.
Why does that happen?
It’s all about expectations, the appraisal, and the action of institutional money: Our indicators spot and follow institutional money flow to indicate with a high probability where the price move is most likely going to start and end.
Hence, we let the market and institutions appraise the stock price journey and latch on, entering and exiting positions faster than institutions can.
3. Holding Over Earnings
If you want to hold positions over earnings, you are taking an extra risk, but you also can reap enormous benefits. By the extraordinary potential risk, holding over earnings is what we favor the least.
Why is that?
NLT Top-Line predicts price moves into and out of earnings with a probability of around 70%. Hence, we instead trade with the odds in your favor than rely on a potentially random outcome.
When you hold a long position and you want to limit the earnings risks, you can associate options positions with stock positions:
- By selling Calls to provide an income cushion and reap the benefits of higher premiums around earnings
- By adding Puts to limit the downside risk
The NLT Delta Force Concept demystifies options trading and gives you a clear perspective of what to do, how, and when.
Our Blog and YouTube channel hold many examples of systems and decision-making points, where we explain how we act with the help of our indicators and strategies.
4. Day Trading
Another tangible way to participate in the financial markets is day trading. Futures are fantastic day trading instruments. To share examples of how our charts help you find critical price turning points, we pick crude Oil Futures and the E-Mini S&P 500 Index Futures contract.
You will see multiple trade situations, each with a spelled-out price threshold so you can execute buy-stop or sell-stop orders. A dashboard on the chart will indicate at which price point to enter your conditional order, and your order will only go to the exchange when the critical price point is reached in the price development of the next candle. Red crossbars specify the stop. Hence you can place bracket orders with system-defined entry, exit, and stop.
E-Mini S&P 500 Futures Contract, NLT Timeless Chart

The chart recorded the time of 8:30 a.m. to 1 p.m. ET. and highlighted two trade situations with confirmed directions that came to their system-defined target.
The colorful channels on the chart specify potential supply and demand levels. Directional price moves are powerful if the price breaks out or back into those channels. With the NLT Timeless concept, candles form by a system-defined price move, helping you always to have risk and reward of a trade in a meaningful balance. At certain times of the day, intense trading activity might produce trade setups that are unfavorable and not acceptable, considering risk and reward. Each trade was good for an income of about $400 per contract.
In addition, the timeless concept provides you with a less predictable stop setting, and such helps you to bring more trades to target. Indeed, we also offer time-based day trading concepts but do not cover them in this publication.
Crude Oil Futures Contract on the NLT Timeless Chart
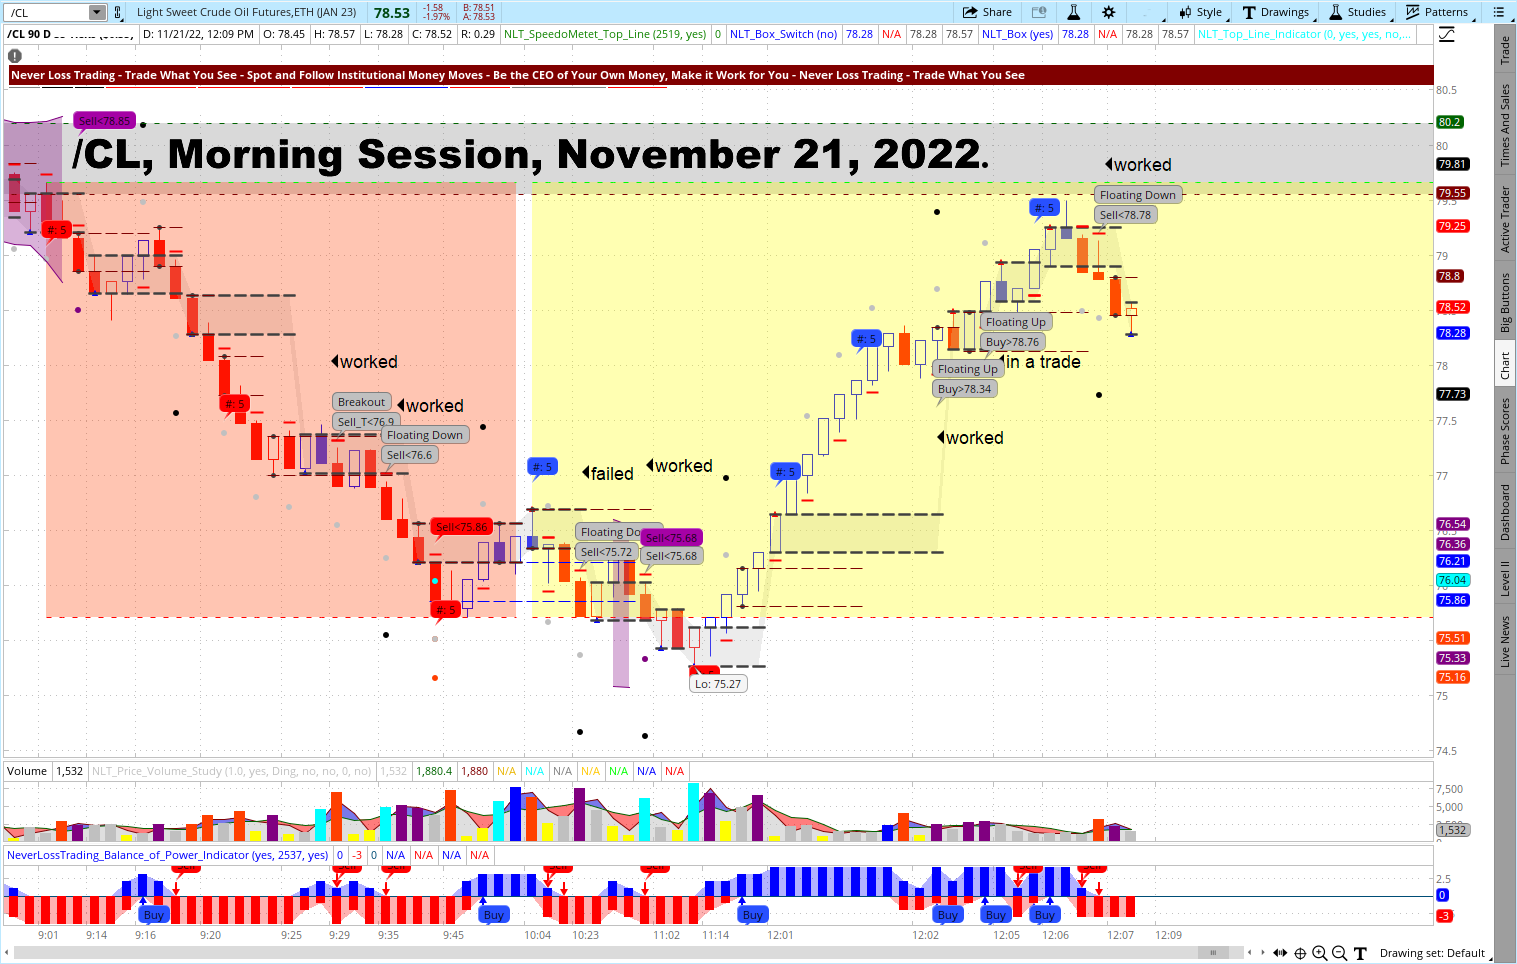
On November 21, between 9 a.m. and noon ET.: Six trading opportunities, five came to target, and one indication stopped. Each trade was good for an income of about $300 per contract with appropriate associated risk. There are a lot of details on the chart, and if you are interested in working with our day trading systems, we are happy to offer you a live demonstration:
contact@NeverLossTrading.com Subj.: Demo
To demonstrate that our high probability indications are not one-day wonders, here is the latest crude oil price chart for December 5, 2022 (yesterday, from the perspective of writing this article).
Crude Oil Futures Contract on the NLT Timeless Chart
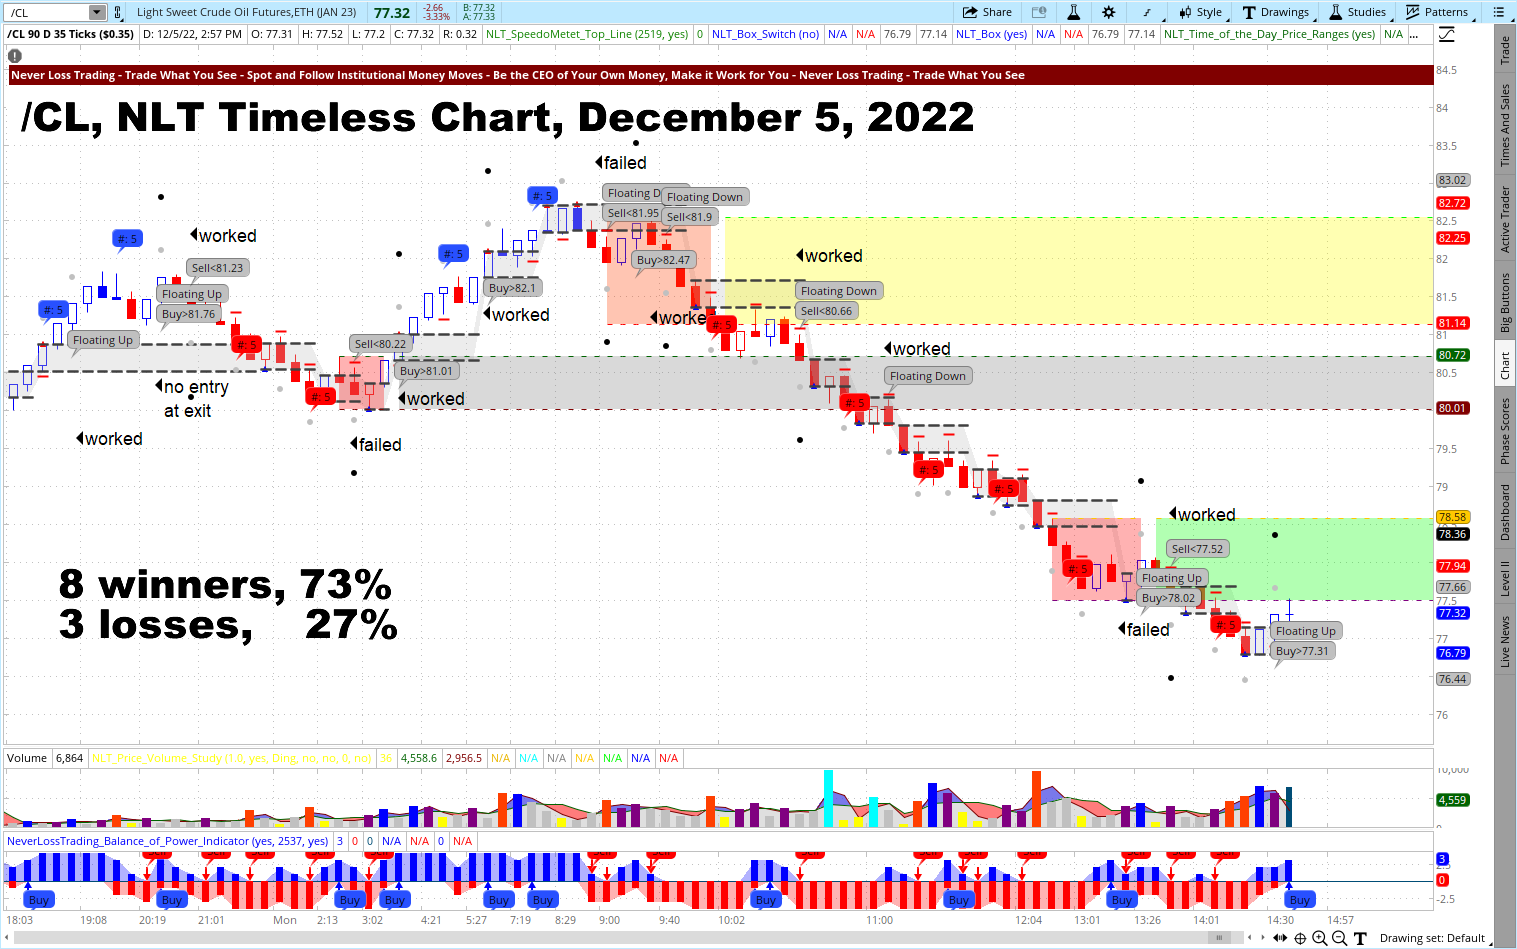
The NLT indicators highlighted eleven trading opportunities for a value change of the underlying contract >$300, where eight came to target, and three got stopped. To complete the picture, we also share the /ES chart for December 5, 2022.
We mechanically accepted all indications in our examples and reached a substantial probability above the minimum expectation of 65%.
E-Mini S&P 500 Futures Contract, NLT Timeless Chart

The chart shows four confirmed trading opportunities that all came to target. Each transaction was good for about $300 of income per contract with an associated risk.
How do our indications make a difference?
We measure the market’s pulse by analyzing underlying supply and demand changes. Price moves have a pre-lude, and in a multitude of dimensions, and there, our algorithms pick the indication, spell out entry and exit conditions and always stay real-time in tune with the price movement of the observed asset.
We have more than ten years in the trading education business and helped many make fruitful financial decisions. We work one-on-one only. In our yearend special, we integrate the new indicator into our systems for a marginal extra.
To succeed in trading, you best work with an experienced coach and learn much about trading. Our #1 competitive advantage is the support and customer service we offer. We work one-on-one with you to specify what we teach to your specific wants and needs; hence, if your knowledge base is not expanding rapidly, you are doing something wrong.
Ongoing education and mentoring are crucial to longevity in this business. Veteran traders have been through more ups and downs than you can imagine. So, experienced pros have probably experienced whatever you’re going through.
If you are ready to make a difference in your trading:
contact@NeverLossTrading.com Subj.: Consultation
It takes multiple dimensions to turn yourself into the trader or investor you want to be, and we support you in acquiring the knowledge and skills needed.

Trading is not a typical career, and you best learn from those who are long-term in this business to cope with the rollercoaster of the financial markets. We are here to help and provide feedback on what you might be doing right or wrong.
The markets changed, and if you do not change your trading strategies with them, it can be a very costly undertaking.
We are looking forward to hearing back from you,
Thomas Barmann (inventor and founder of NeverLossTrading)
Disclaimer, Terms and Conditions, Privacy | Customer Support

No comments:
Post a Comment