Shares often exhibit seasonal patterns and price movements that can be calculated and approximated.

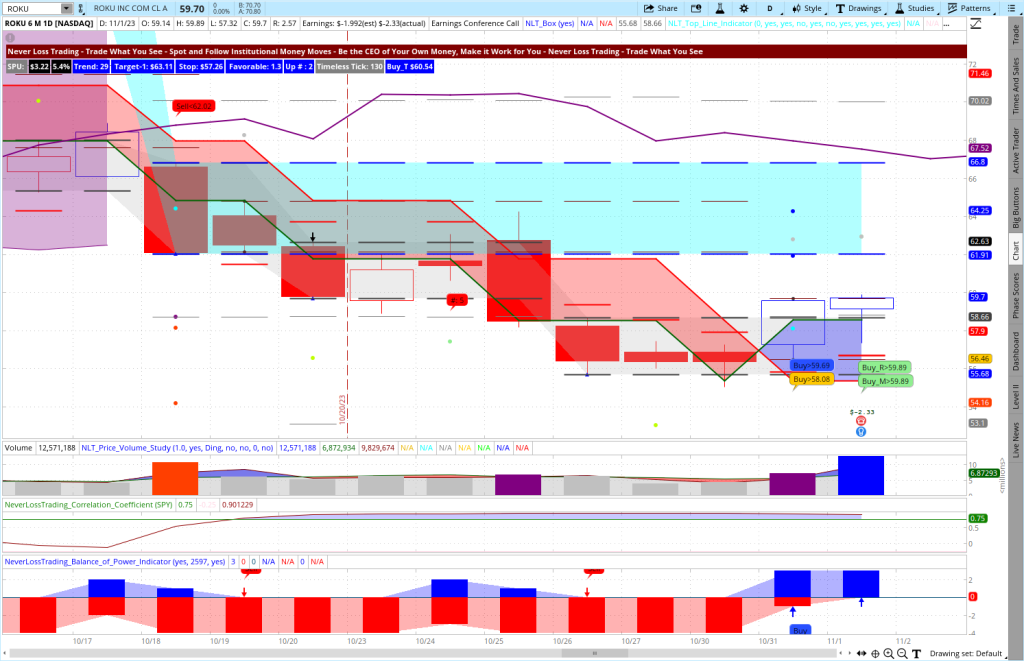
See on your charts when it matters to get involved. Our most recent examples were buying AMZN and ROKU.
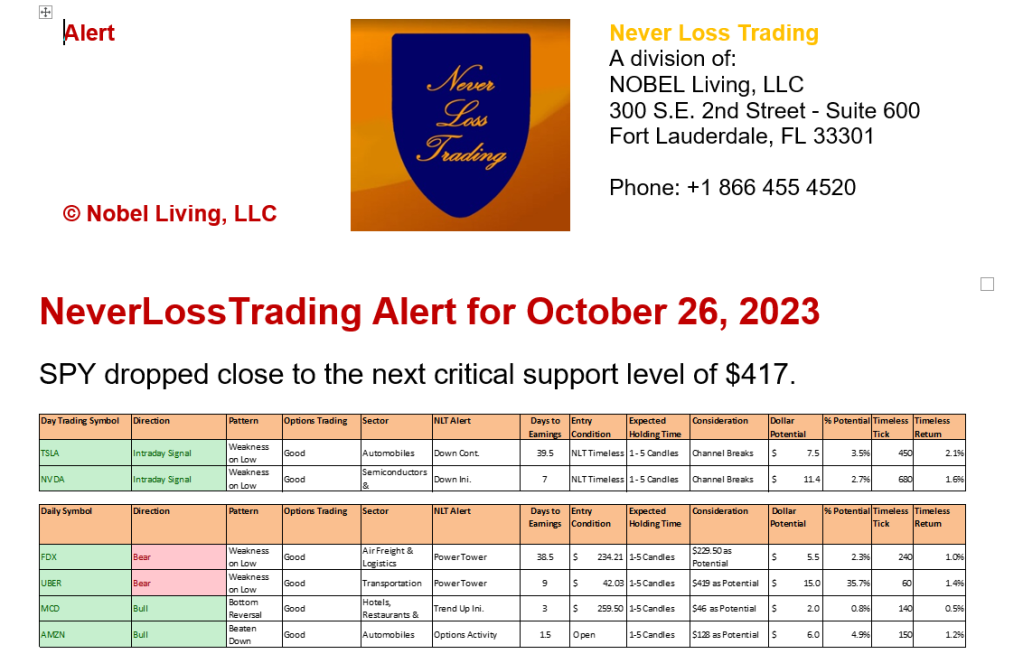
NLT Stock Alert for October 26, 2023

AMZN exploded from $120 to $137 in four trading days.
We also had ROKU with a buy indication on 10/31/23, which moved from $60 to $70 in one day.
ROKU Daily NLT Chart

If you want to trade when it matters, email us, and we will send you the concept write-up of our most recent indicator development, highlighting seasonal stock patterns.
contact@NeverLossTrading.com Subj.: Seasonality
Various factors influence these patterns, including market sentiment, economic cycles, and stock-specific events. Our scanners and indicators analyze price move data in multiple dimensions so traders and investors can identify recurring seasonal trends and critical price moves.
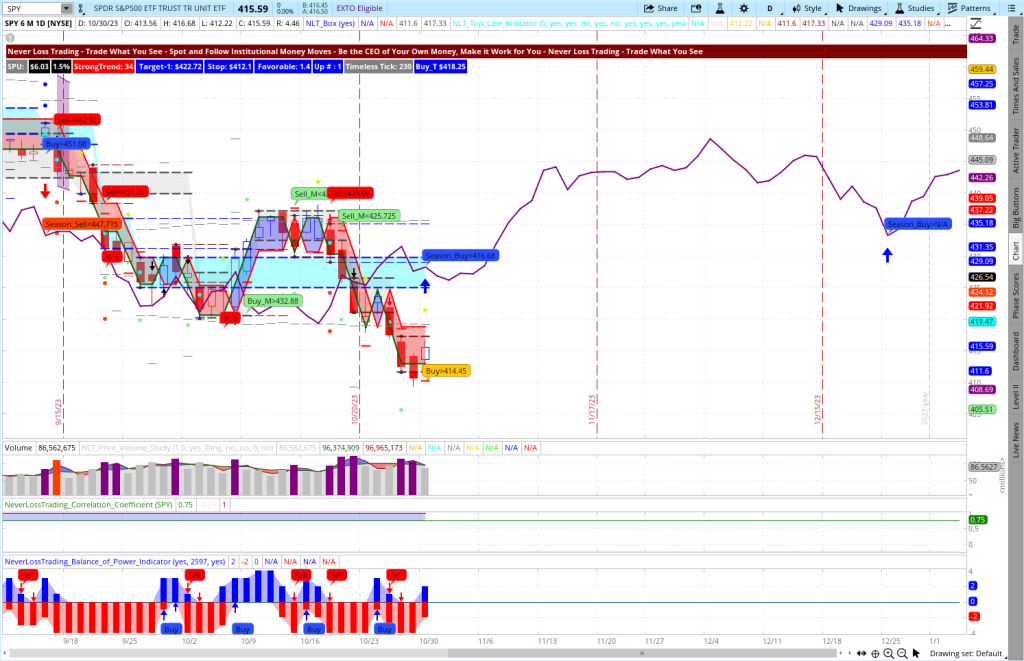
SPY is the instrument that best represents the overall stock market development. Our NLT Sesonality Price Move Indicator highlighted two recent events.
- On 9/14/23, there is a selling indication if the price for SPY drops below $447.71. This was the fact, and we entered a solid downward trend.
- On 10/30/23, there was a buying indication if SPY reached above $416.68. Also, this happens, and while we write this document, the stock market advanced.
SPY, Seasonality Price Move Indicator Highlighted

Check on the high probability the NLT indicators highlighted crucial price turning points to act on. Contact us; we will gladly send you the concept write-up and are ready for your questions in a live demo:
contact@NeverLossTrading.com Subj.: Demo
We are looking forward to hearing back from you,
Thomas Barmann (inventor and founder of NeverLossTrading)


No comments:
Post a Comment