Spot and Trade Institutional Money Moves

Algorithmic Trading with Human Interaction for:

Day Traders, Swing Traders, Long-Term Investors

Showing posts with label AAPL. Show all posts

Saturday, March 5, 2022

Return on Risk in Trading

Summary: Successful traders bring risk and reward in a meaningful balance to produce long-term income from the financial market—experience how this can be done by reading on.

What is your return on risk (RoR)?

Yes, you read right, return on risk, not capital. However, let us compare the two formulas:

  • Return on Capital (ROC) = Profit / The Invested Capital
  • Return on Risk (RoR) = Expected Profit / Assumed maximum Risk

Do you see the big difference between the two?

Return on Risk by NeverLossTrading

ROC takes past data and compares the outcome of the business or trading endeavor and reports in Hindside how things were.

By calculating RoR, you forecast two dimensions:

  • A forecast of the expected profit means that you or your system must specify the desired outcome of each trade and its probability.  
  • Forecast the maximum expected risk to take to bring the trade to target without getting stopped.

Boiling it down: as a trader, you are a probability thinker, and you only put your money at risk when there is a high probable chance for it to produce the desired return. Still, this does not help you define how much risk you can accept and assume its probability.

We work with high probability algorithmic setups and aim for an attainment rate or probability of winning ≥ 65%.

So now, let us make a simple breakeven calculation of the maximum risk you can take in a trade when your expected outcome or profit is $1 at a 65% chance of winning.

Breakeven =Winning – Losing= 0
Breakeven =$1 * 0.65 – 0.35 * Max Risk= 0
Max Risk =$1 * 0.65 / 0.35= $1.86
Return on Risk Formula

What does $1.86 mean for you as a trader?

When you operate with a 65% winning system, your max risk to accept is 1.86-times the reward, but you only reach breakeven at this point.

We casually advise our clients to accept a maximum of 1.2  to 1.3-times risk per dollar expected reward. Hence, when you operate with a high probability system and dedicate yourself to following this rule, you have an edge as a retail trader to produce constant income from the financial markets.

The biggest problem is how to specify the dollar target of a trade?

A general maximum principle of achieving a maximum output for a minimum risk does not work in trading, as it does not work in economics either:

  • You calculate an economic maximum by taking a base resource and calculating the output you can achieve by evaluating alternatives.
  • A financial minimum specifies a given output and calculates the choice with the lowest resource usage.

For trading, this means:

  • Know and understand your system probability. Unfortunately, most retail traders work with systems or ideas far from high probability and celebrate their random wins.
  • Let your system define the expected output of the trade and check if the setup allows for operating with an adequate risk gauge to bring the trade to target.

Why is there a risk gauge?

Price change has a natural statistical distribution, and when you set too tight stops, you get stopped before bringing your trade to target.

In case of wide stops, like 2-times profit, you risk too much, and you will not make long-term money.

It sounds like you are between a rock and a hard place.

Yes, trading is not easy, but it is learnable.

Let your system and chart tell when to buy or sell and trade what you see, not what you assume.

The price change results from a shift in supply and demand. Thus, a system can measure those and extrapolate how far a price movement most likely expands: This is precisely what our indicators and algorithms calculate and share on the chart with you.

Yes, trading is a numbers game, and you better comply with what works more often to come to profitability. The driver of your P&L is trading with the odds in your favor: Here is the price move model we follow, and it considers all we said above:

NeverLossTrading Price Move Model

NeverLossTrading Price Move Model

Theory: Key asset holders will have a solid need to re-balance their inventories. Thus, at a particular price expansion, they will either float- or shorten supply, which will result in an opposite directional price move that will then take away from our profits. Knowing this, we pre-calculate how far the expected price move will reach, and there we take profit,  assuming it will retrace or reverse after.

Hence, we let the market and institutions appraise the asset price journey and latch on, entering and exiting positions faster than institutions can.

Our brand name derives from the concept of repairing a trade instead of accepting a stop loss; however, Never Stop Loss Trading was a bit lengthy.

TradeColors.com is our introductory system to high probability trading. We always allow for upgrades; you only pay the difference if you start with TradeColors.com and upgrade after.

Many of our clients purchase more than one system: Our systems are productivity tools, and by combining them, you produce a higher participation rate and higher returns.
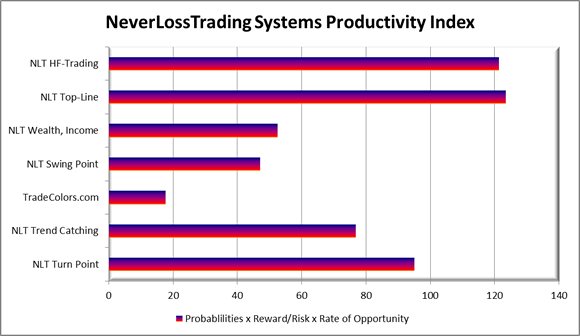
NLT System Index Productivity Comparison
NeverLossTrading System Productivity Compared

Our tool to calculate the expected price move to target is the SPU = Speed Unit, and it indicates how far a price move shall reach until it comes to an end. 

With our systems, you can operate with conditional buy-stop and sell-stop OCO orders (one-cancels-the-other). Without the need to be in front of your computer for the orders to execute. You enter by price thresholds, ensuring that other market participants have the same directional assumption as you do and exit at the SPU target or adjust the trade at the stop.

NeverLossTrading SPU Move Indicator Explained

By a change in the frequency and amplitude of the price movement over time, we specify indications to act on high probability price turning points, applying mechanical rules rather than leaving room for interpretation.

We cover all asset classes: Stocks, Options, Futures, FOREX.

As a retail trader, you have multiple opportunities for:

  • Day trading (opening and closing positions the same day)
  • Swing trading (holding position for multiple days)
  • Longer-term investing (holding positions for weeks and months)

You can act with a high probability price move model on key price turning points based on clearly defined risk-limiting strategies.

With the help of our systems, we help retail traders to decide at trade entry for the  five significant challenges they face to prevent the common mistakes often made:  

  • Trade entry decisions (when to trade)
  • Exit decisions (where to take profit)
  • Stops (where to place them)
  • Maximum time in a trade (specified by the signal)
  • Risk to reward (only trade at favorable setups)
Decision Making Dimensions in Trading

Make a change to your trading results, and we will find out which of our systems suits you best.

contact@NeverLossTrading.com  Subj.: Demo.

We are happy to hear back from you.

Volatility in the financial markets is up, and time-based price moves bury a higher risk than before. So we developed the NeverLossTrading Timeless Concept, where we dissect hefty potential price moves into sub increments to reduce the risk unit per trade. Here are some examples of what our system can do for you as a day trader or swing trader.

  1.  Stock Examples

By the NLT Timeless Concept, instead of drawing price happening over time, we trade for price changes and with that prevent long candles with unfavorable risk-reward setups:

AAPL NLT Timeless Trend Catching Chart, Jan. 24, 2022

AAPL on the NeverLossTrading Timeless Chart

A price threshold is formulated for every trade situation: buy > and sell <. This way, you can operate with buy-stop and sell-stop orders and only enter a trade when the threshold is surpassed in the price movement of the next candle. When you add up winning and losing trades, you see an example of high probability trading where we strive for winning 65% and above.

The chart shows a pure mechanical appraisal where every situation is traded. In the mentorship, you will learn the rules of how to pick higher over the lower probable cases.

Let us now take a time-based example for swing trading: holding a position between one and ten days.

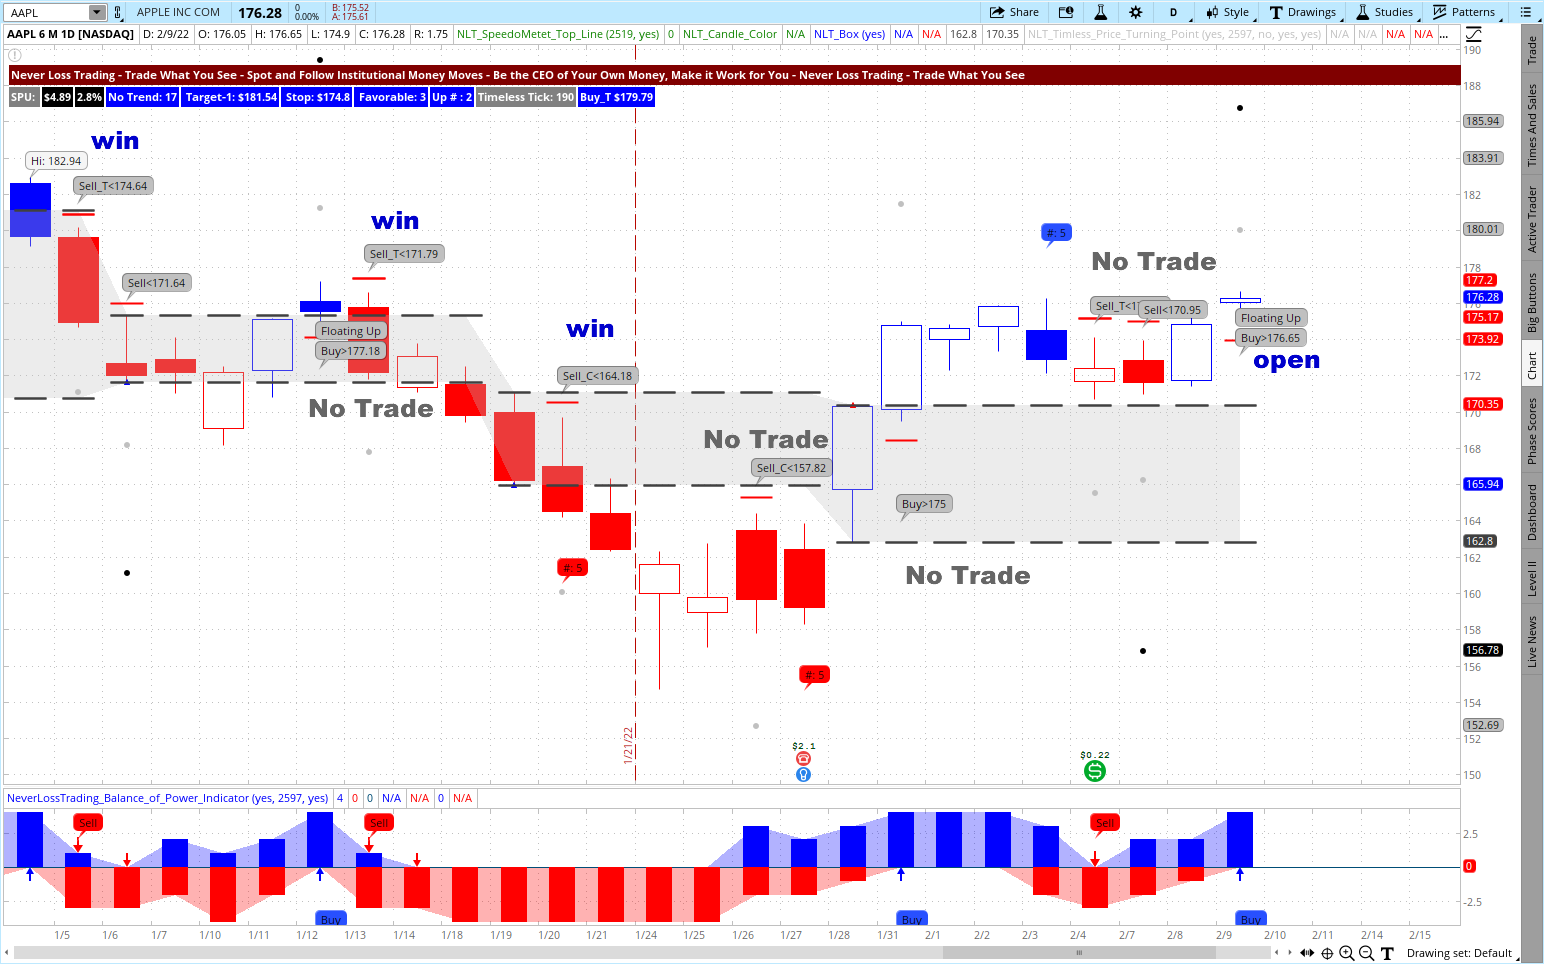
AAPL NLT Daily Trend Catching Chart, Jan./Feb., 2022
AAPL on the NeverLossTrading Trend Catching Chart

The chart shows multiple situations from January 4 to February 9, 2022, where it reads no trade: A signal spelled out a trading opportunity; however, the direction was not confirmed in the price movement of the next candle and such, no trade got accepted.

If you trade from an IRA, you would not be able to follow the short signals on the chart (SEC regulations do not allow short selling in IRAs). However, we teach appropriate Options trading strategies that you can profit from when stock prices fall.

  •  Futures Trading

The E-Mini S&P 500 Futures contract is an instrument many retail and professional traders operate with. Hence, let us pick a day trading situation and a longer-term trade setup:

NLT Timeless Trend Catching Chart for the E-Mini S&P 500
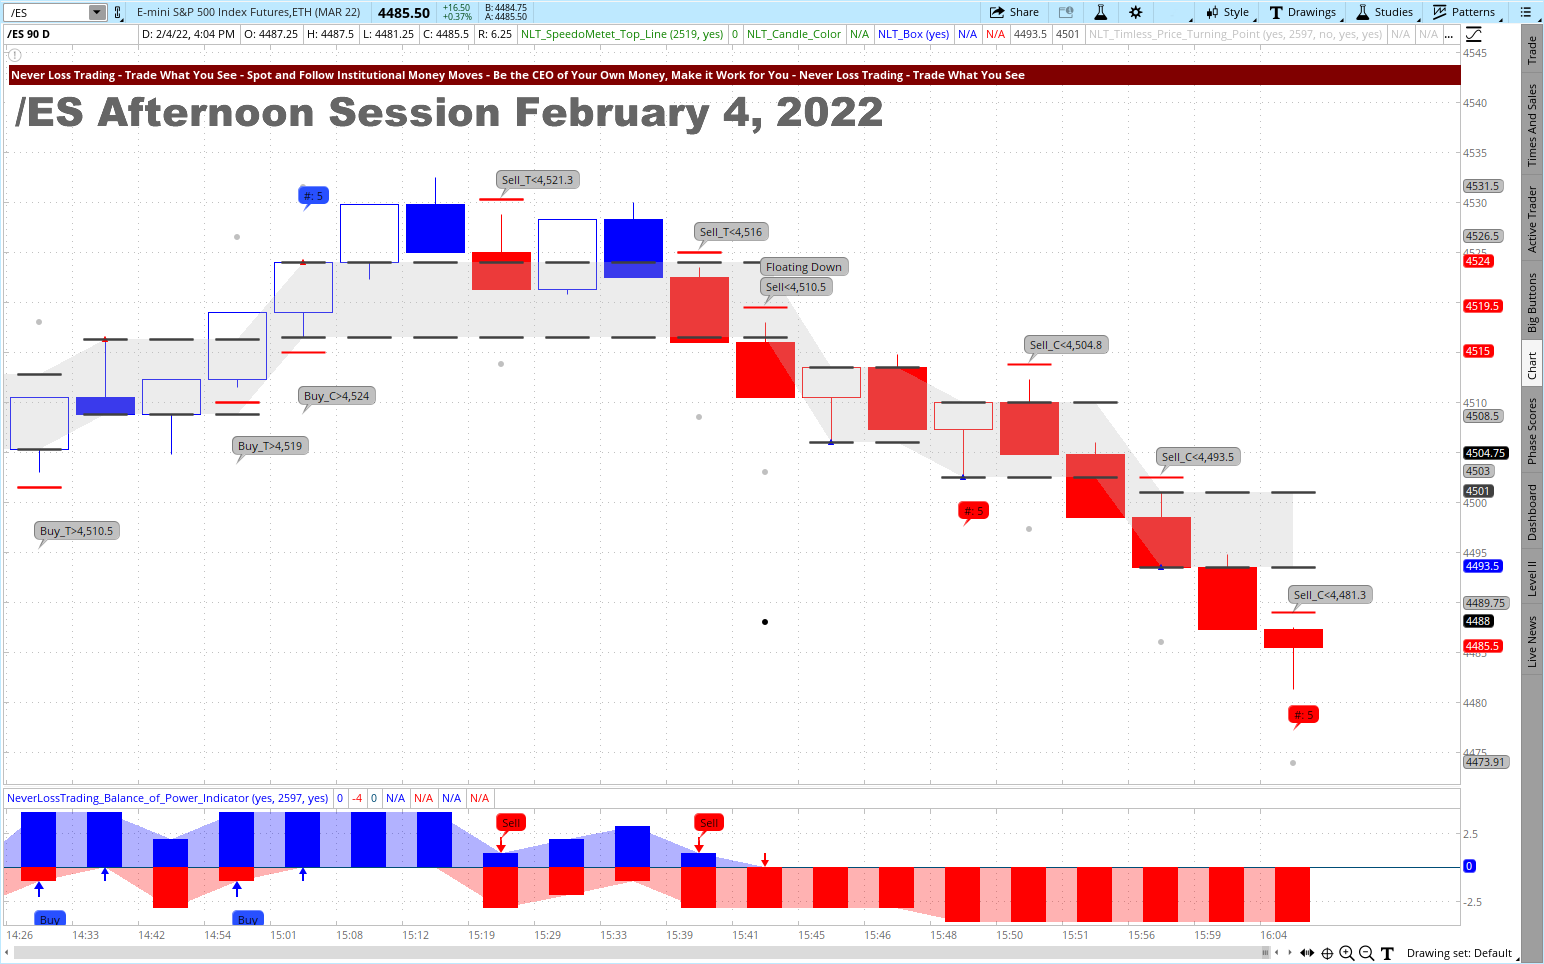
E-Mini S&P 500 Futures Contract on the NLT Timeless Day Trading Chart

The chart shows multiple buy or sell opportunities:

  • Each opportunity formulates as a buy > or sell < a system-defined price threshold, allowing you to enter the trade direction only when the direction is confirmed.
  • Each price change ends at the target (dot on the chart) or the red cross line, indicating where to stop.
  • The system probability is ≥ 65%. The difference of entry to stop is about 1.2-times the difference of entry to the target. In the chosen example, entry to target was $350 and such the risk was $420. Adding up three trades: two winners ($700) and one losing trade ($420), gives you a positive expectation of $280 per contract on a set of three trades.

Daily NLT Trend Catching Chart for E-Mini S&P 500

E-Mini S&P 500 Futures Contract on the NeverLossTrading Tend Catching Chart

From left to right, you see:

  • A trade to the downside, breaking the price containment NLT Box and coming to target: gray dot.
  • Two trades with “No Trade” indication: on the first trade, the target was cut short by a box line – no trade. The second signal was not confirmed.
  • What follows are two winning trades that came to target.
  • Then two “No Trades” where the threshold did not get surpassed in the next candle.
  • A winning trade on Buy_T> $4,426 that came to target three candles after entry.
  • An open trade that did not reach its target or stop. We set the stop by the red crossbar on the chart.
  • FOREX

The most favored FOREX pair is the EUR/USD. There are multiple ways to participate in the price development, and we share a day trading and swing trading example:

Timeless NLT Day Trading Chart for EUR/USD

EUR/USD on the NeverLossTrading Timeless Chart

From left to right:

  • No Trade, by NLT Box Line cutting the price move to target short
  • Wining long trade to target
  • Winning short trade, followed by another winning short trade
  • A losing short trade
  • Two winning long trades.

Daily NLT Trend Catching Chart for EUR/USD
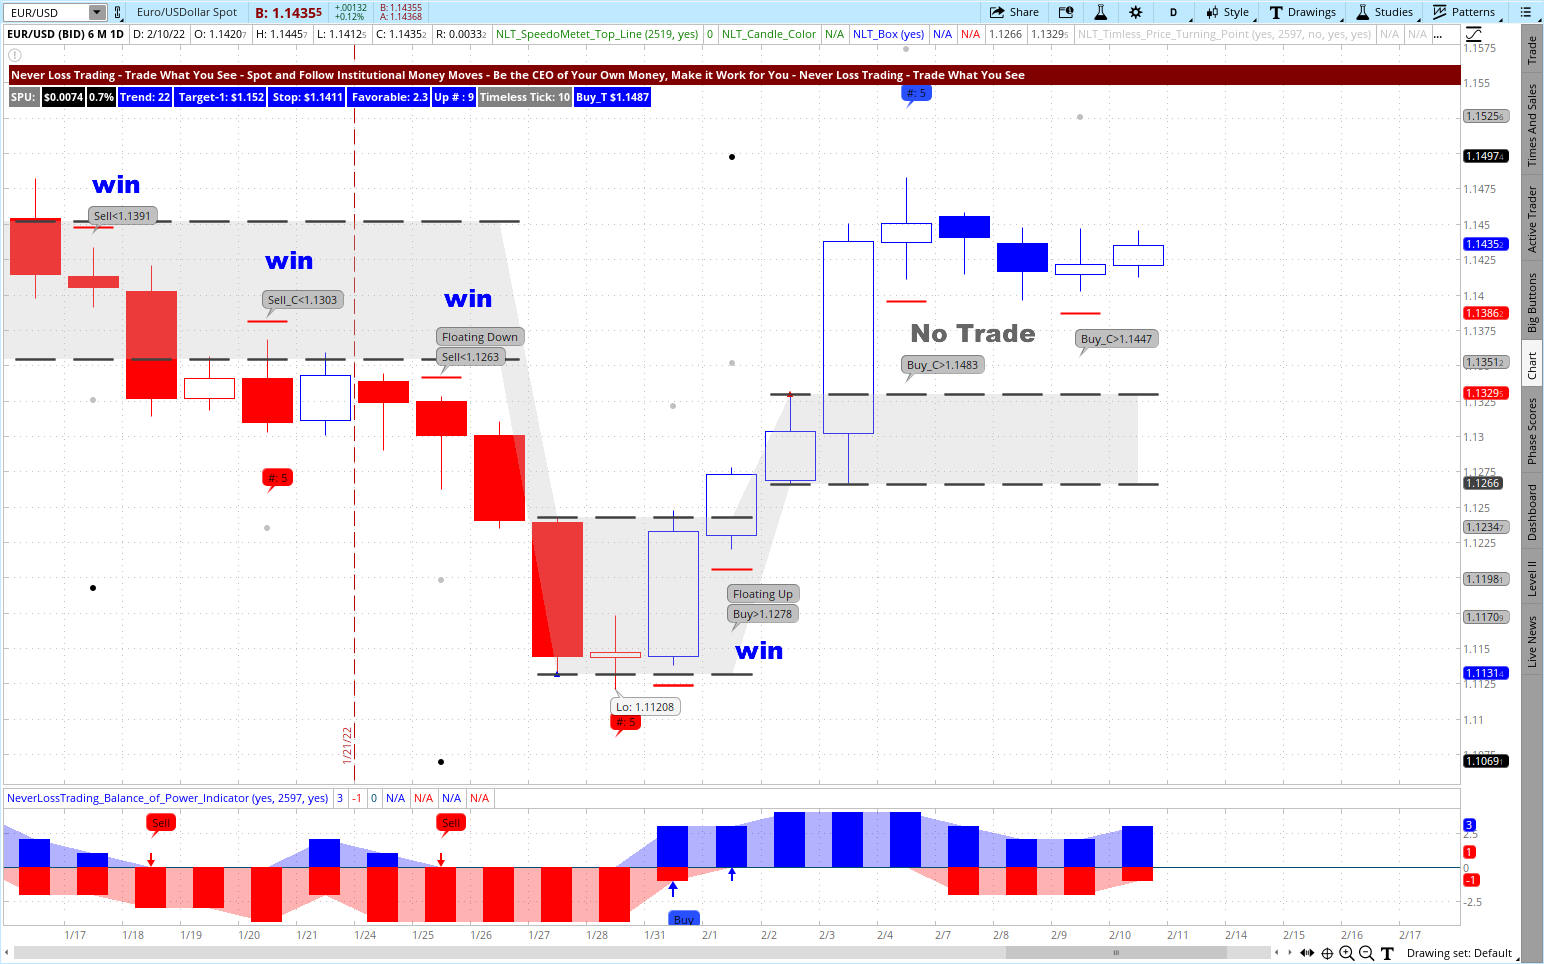
EUR/USD on the NeverLossTrading Trend Catching Chart

When we sparked your interest and you want to come on board with our systems and strategies, we invite you to a personal session to see how our systems work life.

contact@NeverLossTrading.com  Subj.: Demo.

We are more than 10-years in the trading education business, teaching one-on-one at your best available days and times, and are ready to share our experiences of helping private investors to build their trading business. Trading is not a typical career, and you best learn from those who are long-term in this business to cope with the rollercoaster of the financial markets. We are here to help and provide feedback on what you might be doing right or wrong.

Make a change to your trading results, and we will find out which of our systems suits you best.

Stay informed and subscribe to our free market updates.

We are happy to hear back from you,

Thomas Barmann (inventor and founder of NeverLossTrading)

www.NeverLossTrading.com

Disclaimer, Terms and ConditionsPrivacy | Customer Support

Saturday, August 29, 2020

Stock and Options Trading by Alerts


This white paper shows how we combine NeverLossTrading indications and options trading activity for finding and following trading and investing opportunities when they develop intraday.


We are blogging and sharing content for more than ten years, and we helped many traders and investors to produce consistent income from the financial markets.


With our systems and indicators, we are tracking institutional money moves and trade along with those by finding and acting on high probability setups with the goal of ≥ 65% accurate directional prediction.

Let us give you an example of how our systems spell out opportunities on the chart to spot and follow:

AAPL Weekly NLT Top-Line Chart, Feb. to Aug. 2020


Even so, reading and operating with our indicators needs to be learned, the chart demonstrates how our system points out opportunities at key price turning points and along with the price development of the observed asset: in our case AAPL.

For more input on our systems: contact@NeverLossTrading.com

In the NLT Options Trading Alert, we combine NLT indicator readings and options trading activities, highlighting where our systems find significant changes in supply and demand intraday. There is no fixed reporting schedule, the trading day and happening defines when the alerts are generated:

  • First reports come out around 10 a.m. ET forward.
  • End of the day alerts, around 3 p.m. to 3:30 p.m. ET.

-      We only share reports when referring changes in supply and demand are identified. When nothing happens, no alert will be generated and shared.

-      An alert based on the end of the day numbers will also be generated and shared.

-      Only shares with meaningful option trading conditions are considered (tight bid/ask spreads, minimum volume and open interest requirements we set).

With the NLT systems, we are operating on confirmed signals only: Daily signals, for example, have to be confirmed in the price continuation of the next day.

By combining early indicator readings and options trading activities, we are opening positions without confirmation on the day of occurrence, and we were able to achieve high probability results 65%.

In summary: The goal of this new alert service is to inform you intraday about happenings: The actual price move of the underlying, combined with the intraday options activity, proposes early entries into developing directional price moves.

Options trading with the right strategies provides:

-      Fantastic return opportunities.

-      Risk-limited trading: Limiting the trading risk, either to the premium paid, when buying options, or to the width of the spreads, minus the premium received on credit spreads.  

We are a big proponent of trading risk-limited only; it builds the basis for every successful trader by preventing drawdowns.

Could you have traded the stock instead of the option on the spelled out opportunities?

Yes, because we traded directional only, and such trading the stock instead of the option would have lead to the same positive results: 72% winners over 28% losing trades.

Before launching this alert service, we tested the NLT Options Trading Alert for three months, with the following results:

·       Between June 4 and August 25, 2020, we conducted 69 trades in 58 trading days: 1.2 transactions per day. Of those, 60 positions are closed, and nine are still open.

·       Of the 60 closed trades, 43 (72%) were winners and 17-times we lost (28%).

·       The average return of the winning trades was 74% of the investment made. The average loss was 65% of the investment made.

·       On the first pass, we kept the maximum risk-unit per trade below $500, and such we left put or call buying opportunities for high-value shares like TSLA out, except spread trades allowed to participate with the set risk limit.  

In summary: We were winning more often than we lost, and we produced a higher return and lower loss average per trade:

A success principle in which we believe in!

Here is an overview of the stock symbols we traded (options of some of the listed symbols were traded multiple times):  

Stock Symbols of the Options Trades Conducted


The listed symbols were not the only trades we conducted; NLT offers multiple alert services from which we choose and execute opportunities for all asset classes: stock, options, futures, and FOREX.

All traded symbols provided substantial daily open interest and volume: an imperative for meaningful options trading.

The average time in a trade was 11 days, with the following  distribution:

Average Days in a Trade


About 25% of the trades were adjusted, mostly by rolling positions forward:

-      40% of the losing trades were adjusted

-      12% of the winning trades were adjusted

By producing an average 74% return over a 65% average loss, the adjustment method provided an edge. Options trading adjustment methods are taught at our mentorship programs.

Watch Video

Producing consistent income from trading and investing is a process, and we provide systems, strategies, and a game plan, helping you to develop yourself into the trader you want to be.

If you are up for learning this and using the NLT Options Alert, let us get super interactive on multiple levels:

-      Level-1: Write us an email that you want to test the end of the day NLT Options Alert to see if you can get value out of it, and it will end up in your inbox at the end of the day or early next day. Subj.: NLT Options Alert Only.

-      Level-2: We interact with you and share opportunities we find intraday and at the end of the day. When you are up for this, we want to have content-filled conversations, and such we want to offer this to ten individuals only. For being able to act on the opportunities we share, options trading experience is of help. If you want to learn how to work with our systems, indicators, and strategies, we are happy to help you with one of our mentorship programs (incl. software, teaching, coaching). For being part of Options Level-2, please email us: Subj.: NLT Options Exchange.

No, there is no charge, and no credit card is needed to participate. When you like our service, we will make you an offer, and you decide if you accept it or not. For you to participate, a legit name and email address is needed:

contact@NeverLossTrading.com

We are looking forward to hearing back from you!

Thomas

www.NeverLossTrading.com

Disclaimer, Terms and Conditions, Privacy | Customer Support

Monday, February 9, 2015

A Simple Way to Know Where Prices Will Go

Price has a memory: A price point once reached is used by institutional investors as profit taking or investing point.
Knowing this, watch in particular for candles with very long wigs: Mark the high or low price point of the wig and be surprised:
Our base trading concept is called TradeColors.com; in a four hour Mentorship, you learn to follow price continuation patterns, triggered by market followers: Fund managers (mutual funds, hedge funds, pension funds, ETF’s) and low risk investors (banks and insurances).
Let us take a look on a day trading chart:
  • Trade Entry after the high, low of a tow or more same candle color sequence is surpassed (highlighted in orange).
  • Target: Top or bottom of the long wig candle. 
  • Stop: Below the first candle of the trade initiation sequence.
Australian Dollar Futures 1-Hour Chart
Australian Dollar 1-Hour Long Wig Candle Trade
The Australian Dollar chart shows how this trade setup lead to two wonderful trades just in the last trading day:
  • Trade-1: Long with a $280 income perspective and a risk of $170 per contract.
  • Trade-2: Short with a $260 income perspective and a risk of $280 per contract.
You sure like the first trade setup with a higher expected return than risk, but how about the second, where the risk is higher than the expected return?
The probability for success of this trade setup is about 70%. If you put the reward and risk in relation to the probabilities of winning or losing and your return on risk is higher than 50%, you found a solid trade:
Validation: ($260 x 0.7 - $280 x 0.3)/ ($280*0.3) = 116%; and thus represents a very solid trade setup.
Learn to be a high probability trader: Call +1 866 455 4520 or contract@NeverLossTrading.com
Check or sign up for the TradeColors.com mentorship at our web site…click
Does this work for Swing Trading too?
Indeed: Check the daily AAPL Chart and see the precision of the two candle color short setups
AAPL Trade Colors Example
But if your type account does not allow for shorting stocks?
Then you learn to trade options to produce short setups in any account.
Learn to be a high probability trader: Call +1 866 455 4520 or contract@NeverLossTrading.com
Check or sign up for the TradeColors.com mentorship at our web site…click
Good trading,
Thomas

Saturday, April 12, 2014

Comments on Trading Strategies


Lately, I was listening at some multi-speaker events to the presentation of several trading strategies and no wonder that many of you are doubtful in the application of any.

Well known presenters showed strategies, which are very easy to follow and administer: When a certain asset goes comes down 16-ticks, you go long for 32 and you risk five. Charts and an actual trade proofed that this is right and works.

Another one was, when gold moves up or down that much at 6 p.m., you go long or short and then overnight you are making money.

Those are billionaire strategies if they would work and they sell for just $97 from normally $197. It is a must buy for everybody who believes this is doable.

When trading is that easy, we would have already produced an indicator and auto trader which does this all the time for us while we are hanging out at the beach and come home rich.

What will actually happen: You will find out in your account statement what a $97 investment can cost you.

A pro makes money with what the person does. Which profession is there, where you can be a pro by watching one DVD?

Think about what determines the value of a product or service?
  • Some are raw material related, when little work is done to them, like simple jewelry.
  • Many others define their value by the cost of labor involved and skilled labor can drive those prices high, like a car.
  • Others have their value based on the productivity they bring and pay for themselves in either replacing other cost elements or by increasing productivity (throughput) and by that shorten the payback time.
When you consider this, and when you risk $500 per trade, and it does not work out twenty times, you invested $10,000; while you wanted to spend just $97.

The issue is:

“You paid the market and you still have no tools on hand that help your next trade to be more successful”.


Do you want to make a change to your trading?

Consider a NeverLossTrading Mentorship; you will be coached, supported with indicators, concepts, in individual training sessions were we are caring about your trading success.

If you like to experience this in action:

Call: +1 866 455 4520 or contact@NeverLossTrading.com


AAPL Daily Chart:
Learn to use this indicators; trade strategies for stocks, options, futures, Forex;
Position sizing, hedging and leveraging,  continues improvement and so much more.


Join our Mailing List

Schedule a Personal Consultation

Call: +1 866 455 4520 or contact@NeverLosstrading.com