Spot and Trade Institutional Money Moves

Algorithmic Trading with Human Interaction for:

Day Traders, Swing Traders, Long-Term Investors

Showing posts with label TSLA. Show all posts

Saturday, February 14, 2026

TSLA Trading: Buy and Sell Trumps Buy and Hold

In today’s markets, price alone tells only part of the story—real edge comes from knowing who is driving those moves. When large institutions shift from accumulation to distribution, they leave a distinct footprint, long before the broader crowd reacts. By systematically tracking these institutional handovers rather than relying on passive buy-and-hold, traders can align their entries and exits with the very forces that drive TSLA’s meaningful swings.

This article shows how our NLT systems translate those shifts in control into clear, rule-based trading opportunities—whether for directional stock trades or leveraged options strategies—so you are no longer guessing about market direction, but syncing your decisions with the capital flows of the dominant players.

Tesla is somewhat lighter on institutional ownership; yet, with 51% of the float in institutional hands, TSLA still delivers highly tradable and often predictable price swings. At times, however, it slips into phases of directional ambiguity—captured by our NLT Purple Zone—where our systems may flag directional trades, but discipline keeps us from executing them.

Our approach diverges from traditional buy-and-hold strategies. Instead, we track institutional flow reversals—the precise moments when buyers hand control to sellers and vice versa. The key lies in confirmed signals: we only act when the next candle’s price movement crosses our system-set threshold, ensuring institutional participants are actively accumulating or disposing of shares.

NLT Multi System Chart

Our NLT Multisystem Chart identified five confirmed handover points in recent months—approximately one high-probability trade per month. Each signal generated around 5% returns when trading the underlying stock. For options traders, these same setups yielded 60% return expectations, offering substantial leverage to the same institutional movements.

Four of the five opportunities came to their system-set target: dot on the chart. The last indication is still open.

The bidirectional nature of this strategy is particularly valuable for IRA accounts. While traditional retirement accounts restrict short selling of stocks, options provide a legitimate mechanism to profit from downward movements, fully utilizing both sides of institutional flow.

Rather than hoping for long-term appreciation, we participate actively in TSLA’s institutional rhythm. Each confirmed signal represents a calculated entry point where major players have already committed capital in one direction. This disciplined, flow-based approach to TSLA trading forms our core strategy for 2026—capitalizing on predictable institutional behavior rather than betting on distant corporate growth.

Here is the price move model we believe in that builds the basis for our Algos and AI indications:

The Foundation: Price Move Model and SPU Calculation

At the heart of the system lies the proprietary Speed Unit (SPU) calculation—a volatility-adjusted metric that measures the expected price move distance from entry to exit or stop level. Unlike fixed-point or percentage targets that don’t adapt to changing market conditions, the SPU dynamically adjusts based on current volatility, providing realistic profit targets and risk parameters for each market environment.

NLT Price Move Model

With the help of the SPU calculation, our system measures the price move distance from entry to exit or price adjustment level (or stop).

NLT SPU Calculation

This mathematical foundation, combined with advanced AI-driven processes, empowers traders with precise guidance on when to enter or exit trades mechanically. The system is designed to make you genuinely listen to the market’s underlying signals rather than impose your views on it. Trades are executed only when broad market momentum and price action collectively validate a substantial likelihood of a directional move.

Let us know what type of trading strategies you prefer:

  • Day Trading
  • Swing Trading
  • Long-term investing

And we jointly determine which of our systems, when combined, best supports your trading decisions. We work one-on-one and also offer you a personalized consultation.

📩 Contact us: contact@NeverLossTrading.com Subj.: Consultation

To stay connected, sign up for our free trading tips.

Good trading,

Thomas F. Barmann

www.NeverLossTrading.com

Disclaimer, Terms and ConditionsPrivacy | Customer Support

Thursday, April 5, 2018

Option Trading for Private Investors

Options offer wonderful tools for private investors to participate in the price moves of the underlying stocks, futures, commodities, and currencies.

With options, you find a variety of trading opportunities by Calls, Puts at various strike prices and expiration dates; not to mention the ability to create multiple types of spreads and combinations to take advantage of different market conditions; however, we want to keep it simple and focus on using options for participating in directional price moves of the underlying assets and you can do this with any type of account, even IRA, custodian, or cash accounts.
Option Trading by NeverLossTrading.png
Thus, let us share with you how to find strong directional price move setups and explain the reasons for trading options instead of the underlying assets.

Focusing on a simple way of option-trading, we buy Calls to participate in price moves to the upside and we buy Puts for price moves to the downside.
What will be your advantage of buying options over buying or selling the asset?
Our answers are multifold:
  • You can limit your maximum risk to the premium paid.
  • Options allow you to only invest a fraction: 1% - 5% of the asset price.
  • You operate with leverage, striving for 30% - 200% return per trade.
  • Trades can be repaired when they do not work: reducing losses or even turning losers into winners.
  • There is no uptick rule for buying or selling options and thus, you can participate in price moves to the downside in any type of account and market condition.
Your key to successful option-trading is your ability to repetitively predict directional price moves with a high accuracy.

This is where a trading system comes into play and you best only consider trading systems that offer you the following:
  • A ≥ 65% probability to predict the future price move of an asset.
  • Trading/investing at specific and confirmed entry conditions only.
  • At entry, you receive specific target prices, reachable in a pre-defined period of time.
  • Operating with specific stop price levels, where you either exit your trade or you start repairing it.
For option traders, the element of high predictability of a price move at a pre-specified time period is important: At whatever strike price you buy Puts or Calls, you are always paying a time value; which is decaying, taking away from your investment even so the underlying asset price might not even move in your disfavor.

Let us put together two examples:

TSLA Daily NLT-Top Line Chart March 5 to March 29, 2018
TSLA NLT Top Line March 30, 2018
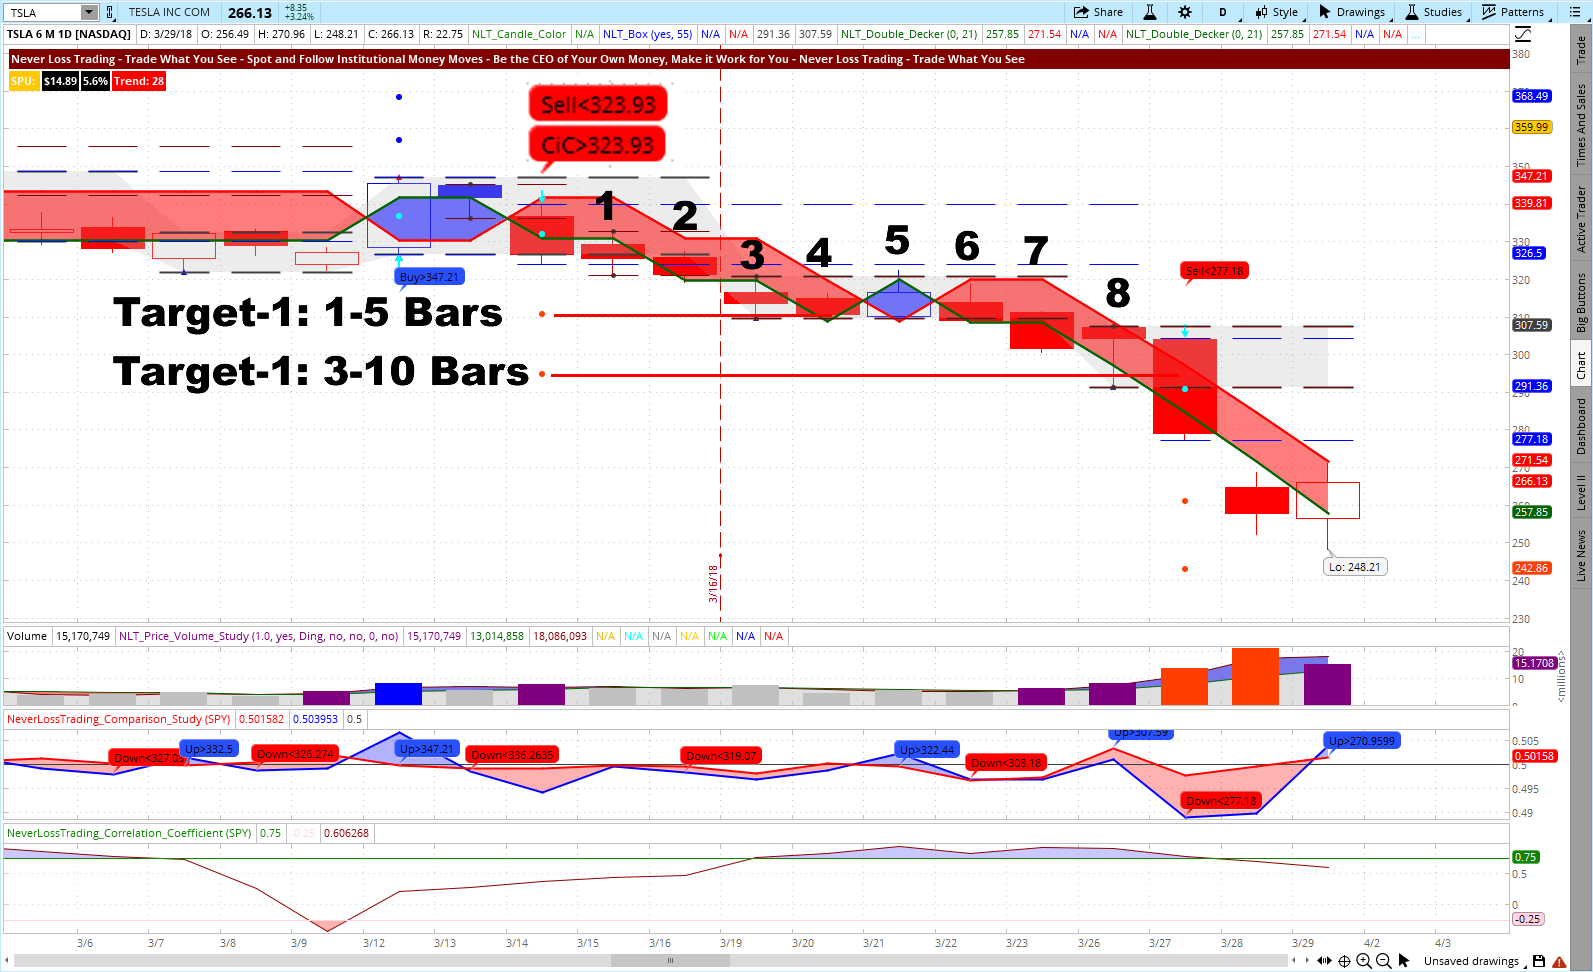
The chart shows you on 3/14/2018 a trade condition: Sell <$323.92 (CiC expresses a change in command; sellers take over from buyers at this setup). Thus you can operate with a clear-cut entry-level condition: When the price-move of the next candle surpasses the set price threshold, go short in the asset (TSLA) through buying Puts.

The trade entry condition was met in the next candle/bar on 3/15/2018 and thus confirmed the trade entry. By the system conditions, you know the maximum and favorable price to pay for the option and the time to expiration to decide for. We teach those details, concepts, and strategies in our mentorships and give you the tools on hand for taking solid trading and investing decisions.

Where is the magic in trading options?

Let us explain:
  1. You are able to participate in the downside price move of TSLA without the need to comply with SEC regulations that do not allow sorting stocks with account holdings < $25,000, or in an IRA, or cash accounts.
  2. No need to borrow TSLA stock from your broker, with the risk that it might not be available for you.
  3. The NLT system conditions specified at the chosen instance, the maximum price to pay for TSLA Put options at $14; favorably at $7:
  • When accepting the trade, Puts were available at $7.22 and such the price to pay was in spec. (the NLT chart dashboard expresses those price levels).
  • In essence, your minimum investment to participate in the price move of TSLA was 2.2% of the share price at entry (just a fraction); asking you for a $722 investment, which is more or less the price of two shares and you control 100.
  1. By NLT Top-Line, we assume to reach the price target-1 after a maximum time in the trade of five bars/candles.
  • Actually, the price moved to target-1in three bars, producing a 70% return on investment.
  • Price target-2 was supposed to be reached after a maximum of 10 bars and was reached at bar-8, with a return on investment of 433%.
Next, we show you if you like to take a longer-term perspective, how the system can help you to make sound decisions with fractional investments:

MSFT Weekly NLT-Top Line Chart, November 2017 to March 2018
MSFT Weekly NLT Top-Line March 2018
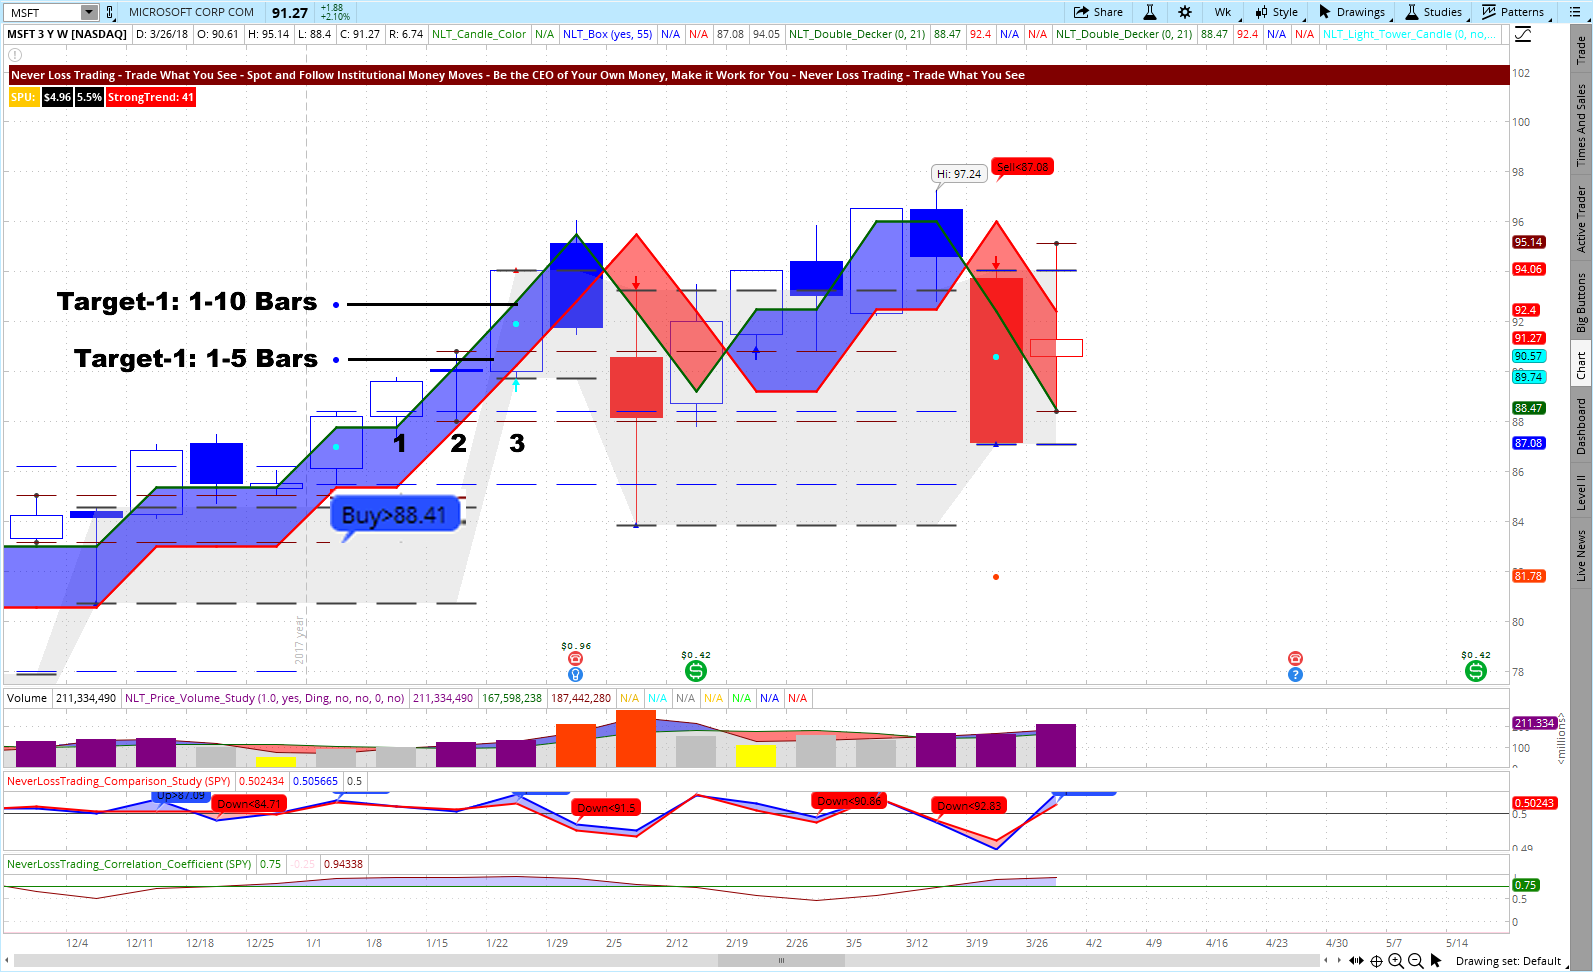
The chart shows a buy threshold at Buy>$88.41, which was confirmed in the price move of the next candle, allowing the trade entry with Call options. This way, you can pre-condition your order so it only goes into the market when your conditions are met, at your pre-defined offering price. This way, you do not have a need to sit in front of your computer for the order entry.

By our system, we originally assumed to reach the target-1 after one to five bars and got there in two bars. Target-2 was reached at bar-3 (3-weeks later), with the following return expectations:
  • Return at target-1: 52%.
  • Return at target-2: 110%.
Again, you just had to invest a fraction of the share price: <2 able="" and="" in="" increments.="" investment="" move="" of="" p="" participate="" price="" the="" to="" underlying="" were="" you="">
We hope this shows you, how you can keep more of your own money and make better than average returns… and fewer mistakes. NeverLossTrading provides you with the systems and knowledge to find such opportunities and to make those decisions. You stay in control as the markets move up and down, with at-a-glance guidance where the chart will tell, when to best buy or sell. Your trade potentials are either to be found by own scanners or by the NeverLossTrading Alerts (subscription service).

To learn more about what you will experience trading the markets the NeverLossTrading way, check out our info page and make a decision..click.

We are in business since 2008 and developed multiple systems and the necessary tools and knowledge base to support you in your aim for trading and investing success. If this is for you and you want to experience how it works live:

Call +1 866 455 4520 or contact@NeverLossTrading.com

If you are not already subscribed to our free trading tips, reports, and webinars…sign up here.

Best regards,

Thomas Barmann

Disclaimer, Terms and Conditions, Privacy | Customer Support

Tuesday, October 18, 2016

The Power of Trading the Right Hour

Based on history, the number twelve has a high importance in human life; however, in the last two centuries we started to focus on the decimal systems and consider that everything works 24/7.
Watch the video…click or read on:
clock-with-trendcatching-chart-and-tb
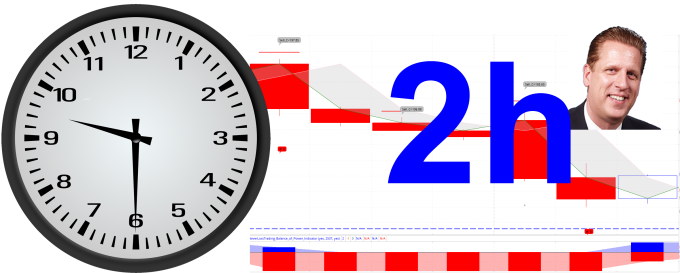
When you cut your trading day into two hour increments, you divide the day into 12 trading opportunities for six days of trading.
Why six trading days?
The futures and FOREX markets open Sunday and close Friday.
Let us show you a couple of examples how this looks on a chart and later explain why the 2-hour time frame is powerful for you (has to do with signal to noise).
NASDAQ E-Mini Futures on a 2-Hour NLT Trend Catching Chart
nasdaq-futures-trend-catching
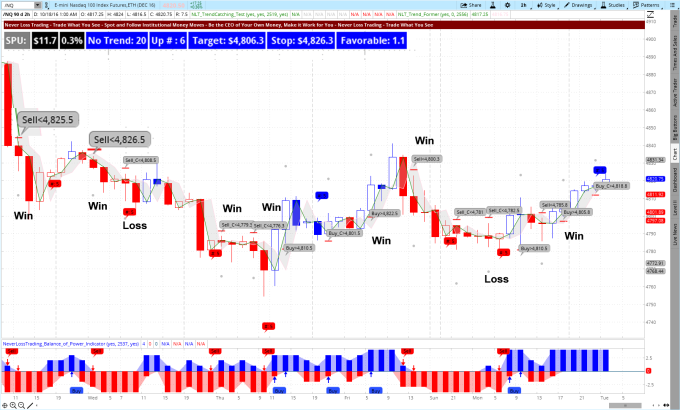
The above chart shows 10-trading opportunities in four days, seven winners (70%) and three losses (30%) by just following the signal mechanically: Certainly high probability trading; however, we also teach in our mentorship how to appraise trades situations individually, risking more when the odds are in you favor and allow ourselves to not trade if this is not the case.
In the left upper corner of the chart you see SPU: our measure that defines bar by bar how far a price move most likely reaches after institutional engagement is found. The expected price move distance is marked by a gray dot on the chart.
Further you are getting an indication if you are in a trending environment: blue for up, red for down. To help you entering your bracket order, a target and stop point are expressed bar by bar, with an appraisal of the reward to risk ratio:
Our NeverLossTrading dashboard to simplify your actions.
The bottom study: NLT Balance of Power shows you if Buyers dominate (blue) or Sellers (red), spelling out additional trading opportunities with buy and sell bubbles, that are either confirming the upper chart signals or producing own directional price indications.
Instead of trying to catch the entire price move from the beginning to the end, the NLT Trend Catching system supports you by dissecting trends into price increments, so you can trade multiple times in a directional price move.
How does this work with stocks?
TSLA on a 2-Hour NLT Trend Catching Chart: October 5 – 17
tsla-trend-catchin-october-2016-1
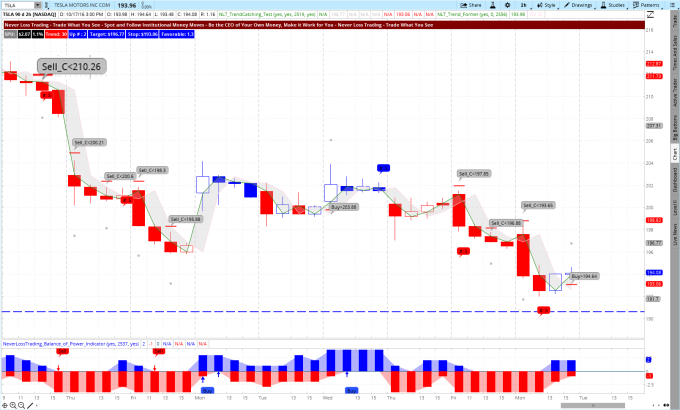
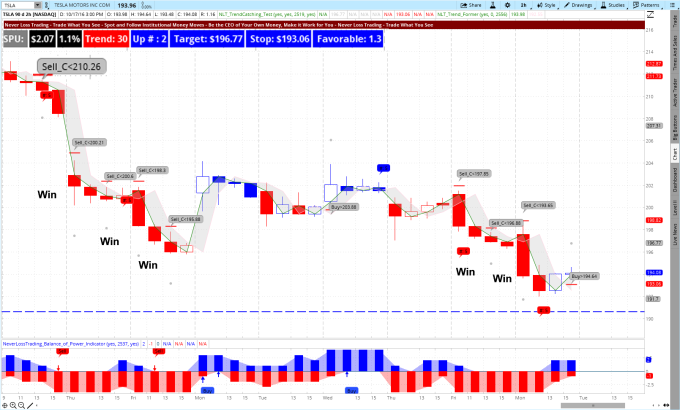
On October 5th, late in the day, we receive a short signal and we are catching a very nice move to the downside, producing a $8 price move. Then we further participate on the second wave of the price breakdown with a signal on October 7th, 2016. In the days of October 10 – 13, we receive no signal confirmation and no trade, to then be active again on October 14th and 17th, to harvest on the breakdown. In total, we are producing five winners out of five potential trades in total a price move of about $18 in nine days:
A 9% return on cash, an 18% return on margin and humongous return on Option trading capital if you follow our specifically developed option trading program.
TSLA on a 2-Hour NLT Trend Catching Chart: October 5 – 17
tsla-trend-catchin-october-2016-2
 If you like to be part of this, ask for our Election Special on NLT Trend Catching.
Call +1 866 455 4520 or contact@NeverLossTrading.com
By teaching one-on-one, focusing on your specific wants and needs, spots are limited, so do not miss out.
Good trading,
Thomas

Tuesday, September 22, 2015

Predict and Trade Directional Price Moves

How do you know where prices will go?
As a trader, you have three choices:
  1. Going Long
  2. Going Short
  3. Staying Out
The same likelihood of occurrence could be associated with each of those choices: 33%; however, with the right tools on hand, you can eliminate the one or the other choice, reaching 66% predictability; stacking the odds of being on the right side of a trade into your favor.
This is exactly what you want to do: Trading at high probability chart setups.
Our basic system is called TradeColors.com and invites you to the world of algorithmic trading, offering you instruments to spot and follow institutional money moves:
Institutions dominate more than 85% of all trading decisions; by following institutional money moves you have a chance for being more on the right side of the trade direction:
Let us take a look at some chart examples:
Crude Oil Futures September 14 – 21, 2015, 4-Hour Chart: Trade entry at a two of the same color candles with pre-defined exit and not staying longer than five bars in the trade.
Crude Oil 4-hour Chart
A trade setup is given if two-blue candles form after a red candle and the high of the second blue candle is surpassed by the price development of the next candle: opposite on a two-red-candle-color-sequence: the low of the second red candle is surpassed in the price continuation of the next.
EUR/USD, September 18 – 21, 2015, 1-Hour Chart
TradeColors.com Euro
TSLA, August 5 to September 21, 2014, 4-Hour Chart
TradeColors.com TSLA
The TSLA chart reveals a little secret for Swing Traders: institutional money moves can be detected with a high probability on 4-hour charts. With the help of the NLT Watch-List indicators, you will be in the position to find assets with the referring two-candle-color-sequence without the need for going through 100’s of charts.
For more background on activity based trading, watch our introduction video to see how it works…click.
To be part of this: Call +1 866 455 4520 or contact@NeverLossTrading.com
We are looking forward to hearing back from you.
If you are not already part of our free trading tips and webinars…sign up here.
Good trading,
Thomas
Good trading,
Thomas
NeverLossTrading
A division of Nobel Living, LLC
401 E. Las Olas Blvd. Suite 1400
Fort Lauderdale, FL 33301
Phone: +1 866 455 4520

The risk of trading securities, options, and futures can be substantial. Customers must consider all relevant risk factors, including their own personal financial situation before trading. In our teaching of how to trade the markets, in our newsletters, webinars and our involvement in the Investment Clubs, neither NOBEL Living, LLC, the parent company of NeverLossTrading®, or any of the speakers, staff or members act as stockbrokers, broker dealers, or registered investment advisers. We worked out trading concepts and share them through education with our members and clients.