As a trader or investor, you have multiple ways to leverage your return on investments and still limit your risk, allowing you for above-market average returns: knowledge makes a difference!
Return on investment is the name of the financial market game. Return on investment (ROI) is a performance measure used to evaluate the efficiency or profitability of an investment or compare the efficiency of several different investments. To calculate ROI, the benefit or return of an investment is divided by the investment cost. Read or watch our video…click.

On a simple term, it looks like ROI is just a relation of two factors; however, multiple influencing variables determine the final result; let me list those briefly:
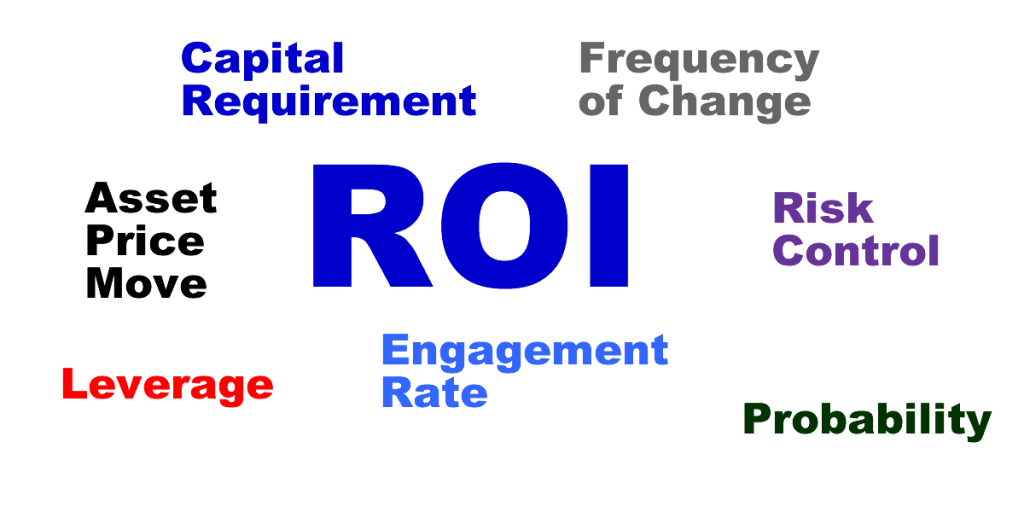
- Capital requirement builds the base or denominator of the formula and differs widely by asset and asset class.
- The asset price move determines the first component of the numerator and specifies the potential return
- The frequency of price change gives you an idea of how often you can expect to participate in price moves
- The probability or predictability assumes the likelihood of determining a potential trade situation in your favor
- Leverage indicates the amount of increased return expected by the movement of the underlying asset
- Engagement rate specifies how much of your capital works for producing a return
- Risk control defines if you and how far you can limit your trade risk or take an unbalance risk
The following graph lists the complexity to handle when striving for a return on investment in the financial markets.
Influencing Factors on ROI (Return on Investment)

We engage in trades from longer-term investments to day trading. Today and in this article, we want to focus on swing trading assets by holding positions between one and ten days.
- As a short-term stock trader, your average return per trade ranges between 2% and 5%. If you obtain portfolio margin, you can leverage your return on risk or capital engaged between 20% and 60%.
- As an options trader, you can strive for an average return on capital of 65% up with the appropriate strategy on hand. On the other hand, you also take a 100% risk on most of your investments, and you need to consider that you invest in time-decaying assets, requiring you to be right in direction and time.
- As a futures trader, you can trade highly leveraged instruments with stop-defined risks, producing between 15% and 50% return on maintenance margin, depending on the future you choose to trade.
The basis of producing constant returns from the financial markets is operating with a high probability system. Leveraged trading strategies are not commonly known but learnable, and we teach them in our mentorships.
Leveraged Trading Strategies Compared
Let us build a quantitative model and appraise the three leveraged-return, swing trading methods, comparing at an average expected high-risk procedure. To appraise the three choices, we evaluate the average expected Return on Investment or Return on Capital (ROC) for a 55% system and a 65% system. The average expectancy of the trading system used by many retail traders is 55% (standard indicators like Moving Averages, MACD…); high probability systems start at attainment rates of 65% and require a different appraising basis and algorithm.Conservative Return Expectations of Trading Strategies
As expected, operating with a 55% system does not give you an edge as a private investor: Whatever you do, you are either trading water or even acting with a negative expectation. Yes, you can celebrate winners, but you will not make money long-term. The odds are staggered against you!By our quantitative appraisal: Futures Trading is the winner, allowing for limited risk trading at an average expected weekly return rate of 14%, compared to an 11.5% expected return rate on trading stocks risk limited. Options trading also achieved a 14% potential weekly return rate potential; however, you have to be right in time and direction for achieving such return, which finally favors futures swing trading over options trading.
However, there is no king’s way: Futures have a limited choice of well-tradable contracts by volume and bid/ask spread, and if you want to keep your money constantly engaged in the financial markets, you might want to trade with more than one focus.
Why?
By focusing on multiple streams of income, your rate of money engaged will increase, so the returns you are striving for.
In our model, we included the following assumptions:
- At a 1.2-times risk to reward, you have the highest probability to bring a trade to target without facing the threat of being stopped, and the trade still commences in your expected direction.
- We assumed the worst-case scenario; it will not always be a 1.2-times risk to reward. You let the chart situation tell when to buy or sell.
- For a positive expectation, you need a high probability trading system with an attainment rate at or above 65%; else, you are not fit for making money long-term.
- Your system needs to produce hardcoded entry, exit, and stop signals: no room for interpretation.
If this is for you, we are here to work in our mentorships for extended periods to help you develop yourself into the trader/investor you want to be.
More than 85% of the transactions in the financial markets are institutionally based. Big money decides for the supply and demand side of the trading business. Our system and indicators observe underlying changes in supply and demand to extrapolate price move potentials with a high probability of ≥ 65% for coming to target when initiated.
Based on broker-published data, 76% of retail traders are losing money. However, 24% are making money, and for you to be part of those, there are specific principles to follow.
Here are the top ten primary edges profitable traders have over their competition, separated by system and trade management.
System-Based Decisions
- Trading the price action as it plays out has better odds than operating with opinions and predictions.
- Backtested signals that worked in the past have better odds of success in the future than guessing which way the market will go.
- Operate with system-based entry, exit, and stop conditions that are hardcoded with no room for interpretation.
Trade Management
- A trader with a trading plan will usually beat a trader with no plan. A trading plan guides the trader in making fact-based decisions rather than emotional ones.
- Traders who are patient with their winning trades will have bigger wins than traders who take profits early.
- Considering statistical volatility by putting your stop loss in a spot that is unlikely to be triggered gives your trades time to work out without being prematurely stopped out during average volatility.
- Following repetitive patterns of the markets gives you an edge over the traders that do not know about those patterns.
- Only accept trades where the reward/risk relation of your system provides a long-term income opportunity.
- Define the position size of your trade percentage based, which prevents drawdowns.
- Discipline: Be prepared to trade and follow your plan daily without exceptions.
We are tackling all those dimensions of trading in our mentorship programs, so you learn what to do and how to be part of the successful long-term traders.
Dimensions of Knowledge Building and Behavior

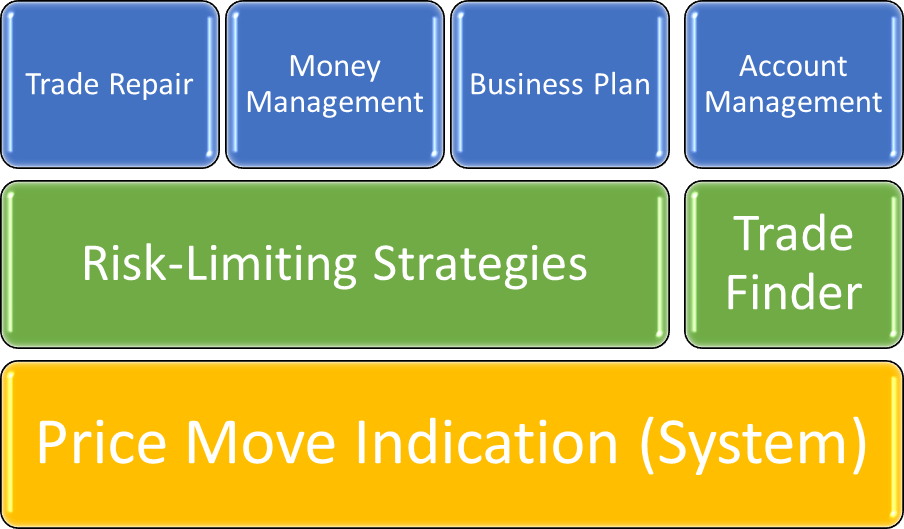
Our charts and indicators build the basis, but there is more to learn and teach than just following price indications. Here are some examples of our latest developed risk-limiting trading concept based on NeverLossTrading Top-Line and Trend Catching:
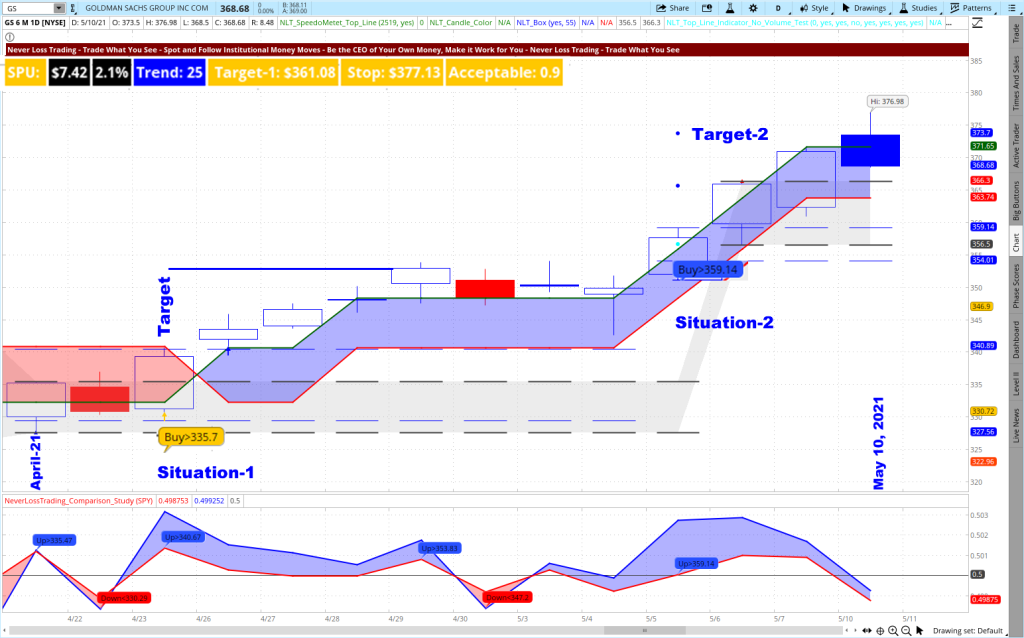
GS Daily NLT Top-Line Chart, April 21 to May 10, 2021

The chart shows two trade situations:
Situation-1:
Buy > $335.70, and the trade direction was confirmed in the price development of the next candle. On the current signal, the 2-SPU target was reached on 4/29. The system anticipated a max of ten days to get to the target.
Situation-2:
Buy > $359.14; which was confirmed in the price development of May 5, 2021. The system assumed the 2-SPU target (dot on the chart) to be reached in 1-10 bars. In the actual situation, the trade was closed on the third day by reaching its target.
You could follow the trade direction either by trading the stock or by choosing an options strategy. The system specified clearly defined trade entry, exit, and stop conditions for both situations: Stops at 2% of 1-SPU below the trade indicating candle.
In both situations, we see a pullback of the price development. By following NeverLossTrading Top-Line rules, you were able to exit the trade before the pullback and harvest on the directional price move.
The average expected return of a 2-SPU price move is 2 x 2.1% = 4.2% for a stock trade. In our mentorships, we share how to leverage those returns drastically by:
- Stock trading in combination with options for 50% ROC
- Trading Call options instead of the stock for 65% ROC
A drastically increased income expectation for the trader who knows and applies those methods.
On the top left of the price chart, you find the SPU definition, which bar-by-bar will help you to define your expected price move. In addition, the system spells out the target and stop placement to evaluate the trade setup. The reading of 0.9 tells you that you would expect a $0.90 return for a dollar of risk to take if you invested at the current candle. In this case, an acceptable setup rather than a favorable one; however, the last candle on the chart does not carry a signal to trade, and we never enter at an exit candle.
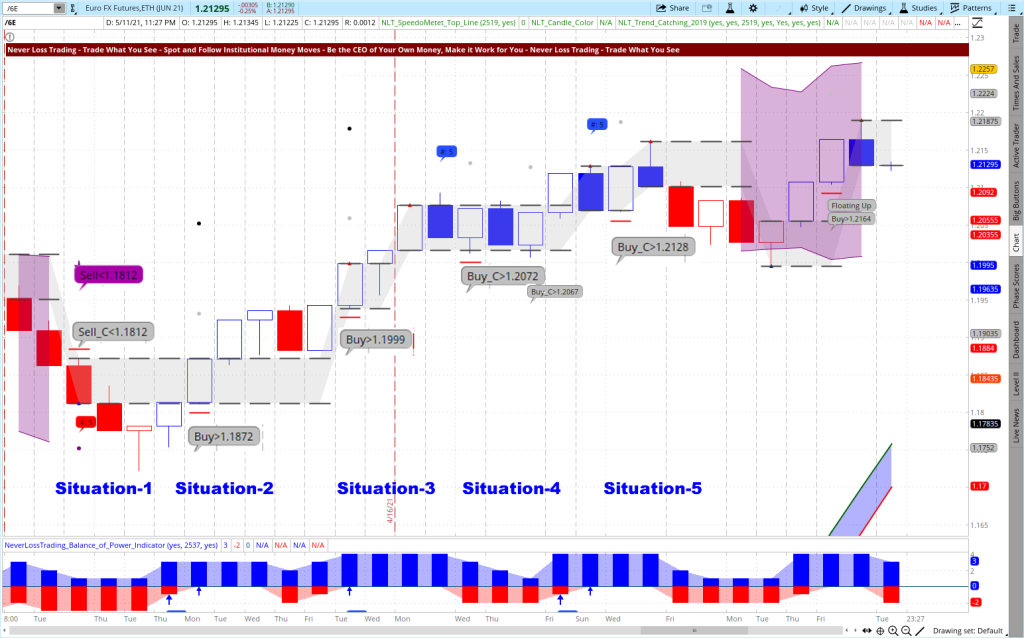
Euro Futures, March 22 to May 11, 2021

Situation-1:
End of price move ambiguity and NLT Trend Catching Signal: Sell < $1,1812. The direction was confirmed, and the trade came to target on 3/30/2021 for a 30% return on maintenance margin in one day.
Situation-2:
Buy > $1,1872: a confirmed signal by the price movement of the next candle, reaching its target on April 7, 2021, for a 30% return on maintenance margin in two days.
Situation-3 and 4:
Confirmed buy signals and the trade targets (dot on the chart) were reached to continue the following days.
Situation-5:
Two days after entry, we were stopped by the price development reaching the red crossbar of the trade initiation candle. Losing is part of winning, and in the observed time, the system produced four out of five winners: 80%. Currently, the /6E is in an NLT Purple Zone (a sign of directional price ambiguity), and such, we do not initiate new trades until this stage is over.
In the observed period, the following return on capital engaged, based on maintenance margin, was achieved:
- Four, 30% return winners
- One losing trade – 30% times 1.2 (max risk) = 36%
- Return approximation: 30% x 4 – 36% = 84% ROC in 50 days
By the present maintenance margin of about $2,400 for one /6E contract, you see why we encourage you to look out for multiple income streams to engage your capital.
You see, we work with clear-cut traffic rules to prevent accidents when entering and following a price move. We share all of this in our training sessions and tune our programs for getting you fit to operate in the financial markets.
The /6E chart lets you trade multiple times in a developing price move, reducing decision making to a minimum and eliminating time as a deciding factor; thus, we call the new concept: NLT Timeless Trading. We use this chart setup for day and swing trading. Here a day trading example:
NLT Timeless Day Trading Chart for /ES on May 11, 2021

The chart shows five confirmed trade situations in a matter of two hours during the trading day of May 11, 2021: all winners.
When working with brokers who offer reduced day trading margins, day traders leverage their return on capital for /ES trades and achieve about a 40% ROC per trade.
We teach our programs and strategies one-on-one, at your best available days and times, focused on your wants and needs. Experience live how our systems work and find out which one is best suited for you. When signing up for NLT Top-Line, NLT Trend Catching in May of 2021, or the combination of both, the NLT Timeless Concept is included for FREE: a $3,997 value.
contact@NeverLossTrading.com, Subj. Timeless Summer 21
For more of our free publications and webinars…sign up here.
www.NeverLossTrading.com Disclaimer,Terms and Conditions, Privacy | Customer Support


No comments:
Post a Comment