
Summary: Experience ways to trade and invest in precious metals by letting the chart tell when to buy or sell!
Gold has a history of being a long-term preservative of money, and this is why people and banks keep it in their vaults; however, today, you will learn how to make sound decisions going long or short in silver or gold.

There are multiple ways to participate in a value change of silver or gold:
- Buying the precious metal in the form of coins or bars
- Trading gold or silver futures
- Working with ETFs that are directly related to gold and silver (GLD, SLV, e.g.) or their options
- Investing in mining companies that are digging for gold and silver
Price is the result of a shift in supply and demand; hence, in times of stock market ambiguity, gold and silver come in demand, and we see rising prices.
Let us compare the price development of Gold and Silver and the S&P 500 for the past six months, referencing the E-Mini S&P 500 Futures Contract and Gold Futures. Futures contracts are instruments that are traded around the clock, six days a week, providing the best basis for real-time data. ETFs and stocks catch up to the futures development and gap.
Gold Price Development and S&P 500 Index

The chart shows relatively falling prices for the S&P 500 Futures (-5.15%) and rising prices for gold (+7.99%), reflecting what we said before.
The next question: are gold and silver prices developing correlated or independent. To answer this, we take a three months comparison to see the following:
Gold and Silver on a Three Months Comparison Chart

Comparing the two precious metals shows that both prices correlated, while silver has even more significant swings to the up and downside.
Critical for every trading or investing endeavor is that you buy or sell at crucial price turning points, and you have to define those. As an algorithmic trading house, we use our systems and let the chart tell when to buy or sell.
Here is an example of the NeverLossTrading Top-Line Chart for gold futures. If you are not yet familiar with us: our brand name, NeverLossTrading, derives from the concept of trade repair, where we take corrective actions instead of accepting the stop-loss, and Never Stop Loss Trading was a bit lengthy. Hence, our name does not imply a promise of never losing a trade, but we share high probability trading systems and strategies.
With this said, let us take a recent chart example for gold futures.
Gold Futures on the NeverLossTrading Top-Line Chart
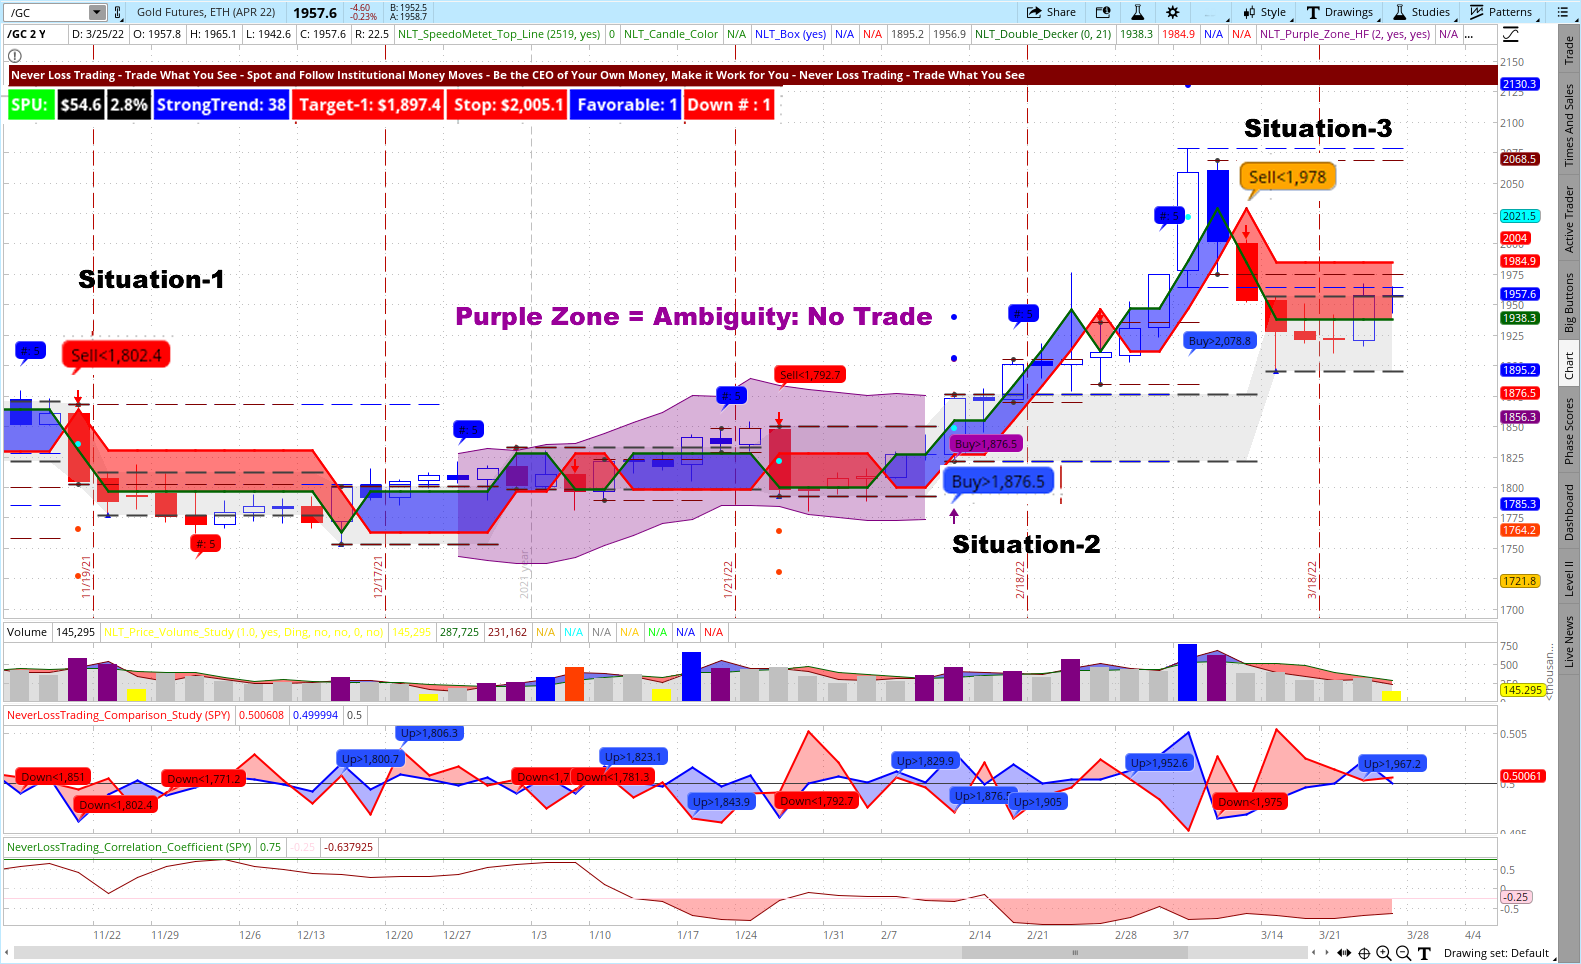
On the chart, we highlighted three trade situations and the NLT Purple Zone:
- In the NLT Purple Zone, no price direction is found, and we are not accepting directional trade signals if they occur. When the purple zone ends, we have a high chance for a directional price move, as it happened in reality.
- Situation-1: Sell < $1802.40 defined a short opportunity when the set price threshold was surpassed in the price development of the next candle, which was the fact. Hence we had a short selling opportunity, and the red dot on the chart specified where the exit was.
- Situation-2: Buy > 1876.40 had its price threshold surpassed in the next candle and led to a trade to the upside for two target dots and the red line on the blue frame, covering the price development functioned as a trailing stop.
- Situation-3: Another short opportunity, and the trade quickly came to target. On this signal, you do not see a dot on the chart, but you can read the expected price move from the dashboard on the chart:

SPU is our measure for the expected price move. For example, on March 14, it was $54.60; the plan was to exit the trade when this price move from entry was accomplished. The NLT Top-Line dashboard also specifies targets and stops in discrete numbers and relates risk and reward: At the highlighted opportunity, the risk and reward balanced and proposed a favorable trade setup.
Let us take a quick journey to silver, for the same period:
Silver Futures on the NeverLossTrading Top-Line Chart

The chart shows two trading opportunities (two buy signals); both were confirmed and came to target. We teach in our mentorships how to participate in such opportunities with risk adequate or risk-limitings strategies.
Why is this important?
At the gold futures example, a risk of about 60 points was involved, which translates back to $6,000. When trading the micro gold futures contract, one risk unit was at a $600 risk, and if you decided to trade GLD or GLD options, we share strategies to scale down the minimum risk unit further.
We took trading gold and silver as an example, while our systems are used for finding and acting at crucial price turning points on Stocks, Futures, FOREX, and their derivatives, like options.
We offer multiple high probability trading systems: TradeColors.com is our entry-level system, and NLT Top-Line, is the top of the line.
Overview of the NLT Trading Systems
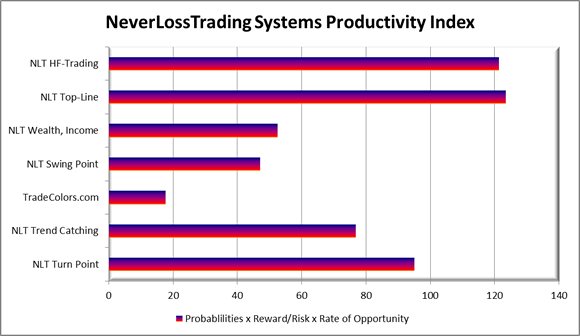
Take the chance and experience which of our systems fits your specific demand best:
contact@NeverLossTrading.com, Subj.: Consulting.
We teach one-on-one only, focusing on your wants and needs at your best available times. For more than ten years, we helped many traders to reach independence and constant income from the markets. Our mentorship entails multiple dimensions of trading knowledge, and with NLT Top-Line, you learn the details in 20 hours. The system also gives you your own scanners where you can find trading opportunities with NLT signals. If you want to rely on our services, we offer the NLT Alerts, where we daily report on potential trade setups.
NeverLossTrading Mentorship Program Elements

Those are general categories; we tailor the mentorship specifically to your wants and needs and the trading styles you choose. You find more specifics on our blog and website.
Our trade indications show clearly defined entries, target exits, and stop levels (or adjustment levels). With that, your trade selection and execution are painted on the chart, and this is why we say, trade what you see:
“Let the chart tell when to buy or Sell!”
Take the chance for a free consultation meeting:
contact@NeverLossTrading.com, Subj.: Consulting.
Schedule your consulting hour! Working one-on-one spots are extremely limited: Do not miss out!
Follow our free publications and webinars…sign up here, and we are looking forward to hearing back from you,
Thomas Barmann
www.NeverLossTrading.com Disclaimer, Terms and Conditions, Privacy | Customer Support

No comments:
Post a Comment