Spot and Trade Institutional Money Moves

Algorithmic Trading with Human Interaction for:

Day Traders, Swing Traders, Long-Term Investors

Showing posts with label Gold Futures. Show all posts

Saturday, August 16, 2025

Revolutionizing Day Trading with the NLT Timeless Concept

Generally, we speak of timeless when something is not affected by the passage of time or changes in style.

In traditional trading, most decisions are driven by time-based charts — such as five-minute, ten-minute, or hourly candles — that create a new bar at the end of a set period. While this method is widely used, it often leads traders into unnecessary noise, false signals, and missed opportunities. The NeverLossTrading (NLT) Timeless Day Trading Concept changes this game entirely by removing the arbitrary constraints of time and focusing instead on system-generated price increment changes.

Rather than waiting for a clock to dictate when a new candle forms, the NLT Timeless approach creates a new bar only when a system-defined price increment — a change in market price significant enough to warrant attention — is reached. This way, traders see what matters: market moves that carry meaning and potential.


Why Timeless Charts Outperform Time-Based Charts

In time-based charts, two consecutive candles might look identical in size but could represent drastically different levels of buying or selling pressure. A quiet market might generate multiple time candles with minimal price change, while a sudden surge in momentum might still be crammed into a single candle, hiding the action that truly matters.

The NLT Timeless concept fixes this by:

  • Filtering out periods of low volatility and noise.
  • Focusing trader attention on meaningful market movements.
  • Aligning trades with critical price turning points rather than arbitrary time intervals.
  • Always keeping risk and reward for every trading opportunity in a meaningful balance.

Acting on Critical Price Turning Points

At the heart of the NLT Timeless system is the ability to detect precisely when buyers take control from sellers, or vice versa. Our algorithm identifies these turning points by combining:

  1. Volatility-adjusted price increments to determine when a new bar should form.
  2. Proprietary NLT indicators (e.g., Light Tower, Trend Catching) to confirm trade direction.
  3. Pre-defined exit points (target dots) for systematic profit-taking.
  4. System-defined stops, keeping risk and reward in a meaningful balance.

This provides traders with an edge that time-based charts cannot replicate: a clear view of market shifts as they happen, not after the fact.


The NLT Timeless Concept in Action

We prefer day trading with futures; however, our systems work for all asset classes and also project high probability setups on time-based charts. To demonstrate the advantage of the NLT Timeless Concept, we compare timeless to time-based charts for our three preferred futures to trade: E-Mini S&P, Crude Oil and Gold.

Let’s imagine trading the E-Mini S&P 500 using the NLT Timeless approach:

  • Step 1 – Price Increment Trigger
    Instead of forming a candle every 10 minutes, a new bar appears only when the market moves by the set price increment (e.g., 1 SPU — Speed Unit).
  • Step 2 – Entry Signal Confirmation
    The system prints a buy or sell signal once the price crosses a system-defined threshold, confirmed by the next bar’s price movement.
  • Step 3 – Exit with Precision
    A target dot is set automatically. If the market reaches it, the trade is closed; if not, the adjustment line offers a chance to repair rather than take a stop-loss.

Benefits for Day Traders

Day traders using the NLT Timeless Concept enjoy:

  • Reduced false signals caused by market noise.
  • Better alignment with actual market sentiment.
  • More consistent results by acting only when meaningful price changes occur.
  • The ability to meet pre-defined income budgets through high-probability setups.

Trading Examples – Time-Based vs. Timeless in Action

Let’s step into the markets on August 8, 2025, and see how the NLT Timeless Concept transforms trading opportunities compared to traditional time-based charts.


E-Mini S&P 500

Ten-Minute Chart
On the standard ten-minute chart, we spotted three trade setups that met our acceptable risk-reward criteria. Two of these trades hit their profit targets exactly as the system predicted, each target marked by a dot on the chart. The third trade, however, failed to reach its goal — a familiar frustration for time-based traders.

Timeless Chart

Covering the same time period, the NLT Timeless Chart also produced three setups — but here’s the difference: all three delivered on their potential. By responding only to meaningful price movements, the timeless approach kept us in sync with the market’s rhythm, avoiding the false start that occurred in the time-based method.

Crude Oil

Ten Minute Chart

Two trades appeared on the ten-minute chart, but volatility painted a messy picture. The chart displayed oversized candles — surges that obscured finer market details and wiped out smaller, more frequent opportunities.

Timeless Chart

Switching to the timeless setup, the noise disappeared. Those oversized candles were broken down into clear, actionable movements, revealing multiple additional opportunities — each filtered for risk and reward before they ever reached our screen.

Gold Futures

Ten Minutes

In the observed period, our indicators saw no suitable trades on the ten-minute chart. Gold’s price action didn’t fit our criteria, and the rigid time bars left us waiting on the sidelines.

Timeless

The NLT Timeless chart told a different story. Several high-quality opportunities emerged — all maintaining a meaningful balance of risk and reward. Where time-based traders saw nothing, timeless traders had clear entry points and profit targets.


A True Game Changer

By removing the artificial constraints of time, the NLT Timeless Day Trading Concept allows traders to focus on the natural rhythm of the market. With its emphasis on volatility-adjusted price increments and rule-based entries and exits, it equips traders with a precise and repeatable strategy to capture opportunities at the most critical moments.

If you are ready to experience trading the way professionals do — where the chart tells you when to buy or sell — the NLT Timeless Concept is your path forward.

📩 Contact us for a democontact@NeverLossTrading.com

Let the chart tell you when to buy or sell. Trade what you see, not what you feel.

To stay in contact, sign up for our free trading tips.

Good trading!

Thomas

www.NeverLossTrading.com

Disclaimer, Terms and ConditionsPrivacy | Customer Support

Saturday, March 23, 2024

Successful Long-Term Futures Trading

Research Results

In the dynamic realm of financial markets, traders continuously seek reliable indicators to navigate the complexities and uncertainties. Among the myriad tools available, NLT signals stand out by their purported ability to provide actionable insights into market movements. Retail traders primarily use futures as day trading instruments, and we invite you to consider long-term trading them with high yield expectations.

This article delves into the power of combining NLT Top-Line and NLT SwingPower (our newest development) for a higher participation rate in longer-term directional price moves of futures contracts, and we document the mechanical performance of trading signals when confirmed.

  • NLT Top-Line highlights crucial price turning points early at momentum changes.
  • NLT SwingPower recognizes changes in the frequency of transactions, often preceding a solid directional price move and extrapolating a price move forecast.

In our research, we investigate the trading performance of weekly chart signals.

Methodology

At NeverLossTrading (NLT), we favor eight futures contracts most friendly for retail traders based on their volume (number of contracts exchanged per day), volatility, and accessibility. In addition, we check that they are independent and not correlated movers.

NLT Favored Futures for Retail Traders

With their inherent leverage, futures offer the potential for remarkable returns, enticing traders with the promise of substantial profits. However, this allure comes hand in hand with significant risk, especially when trades do not unfold as anticipated. The table vividly illustrates the broad spectrum of return expectations, ranging from an impressive 38% to a staggering 67%.

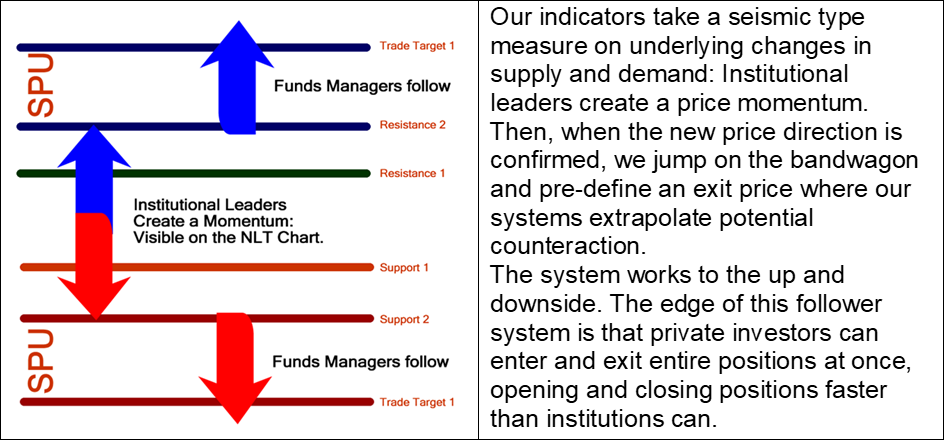
By the NLT concept, we are extrapolating potential price moves as SPU (Speed Unit) and briefly explain how we let the system forecast or extrapolate price moves after signal confirmation (price threshold surpassed in the price movement of the next candle).

NLT SPU Move Model

The basis of the NLT SPU Move Model derives from:

Basis of the NLT SPU Move Model

In the next step, we will document the results of NLT Trade Indications for the past twelve months, charting our favored Futures contracts. Simplifying the process, we accept signals mechanically, not applying the rules you will learn during our one-on-one mentorship, where we focus on your specific wants and needs.

Next, we analyze the past year’s results and are almost ashamed of the highly positive results documented.

Analysis of Confirmed Signals

Each NLT signal spells out a price threshold: Buy > or Sell <; The next candle’s price movement must tick out the set price threshold; otherwise, we will ignore it. Dots on the charts are exit points.

On our list of preferred futures contracts, we reference ETFs you can trade if Futures are not your favorite instruments or in addition to the NLT Delta Force Options Trading Concept.

Examples of Confirmed and not Confirmed Signals

After an in-depth chart analysis, we let the chart decide when to buy or sell, and we documented mechanical trading results, accepting each confirmed signal.

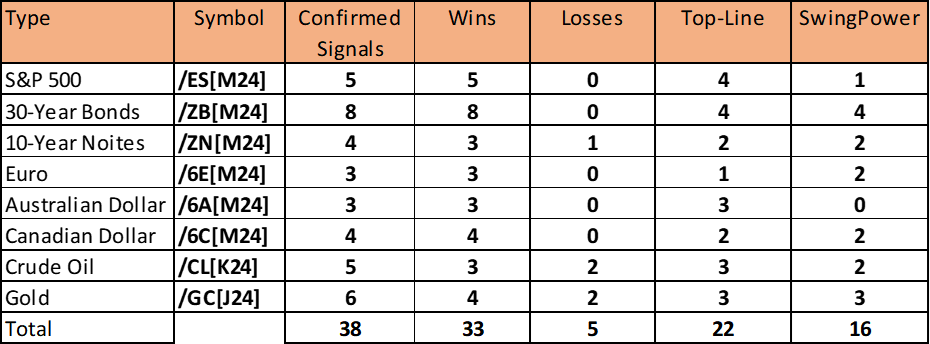
NLT Signal Performance

In addition, we check for correlated price move happenings and uncorrelated ones to document the following results:

Week of the Confirmed NLT Signal

In summary:

  • 23 independent confirmed trading opportunities
  • Six happenings with more than one symbol triggered confirmed buying or selling opportunities:
    • 5/15/2023 (/ZB and /CL)
    • 7/24/2023 (/ZB, /ZN, /6E)
    • 9/25/2023 (/ZB, /GC)
    • 10/16/2023 (/6E, /6C)
    • 10/30/2023 (/ES, /ZB, /6C)
    • 11/27/2023 (/ZN, /GC)
  • Twenty-nine trading opportunities in a one-year time frame: 2.4 trades per month
  • The holding time of open positions varied between one and ten weeks, with an average of about three weeks for open positions.

Considering the high ROI rates (38% to 67%) inherent in longer-term futures trading, those instruments offer an excellent investment opportunity for retail traders. By trading six days a week around the clock, they allow for fully automated trading, triggering at the system-set target or stop with a broker that allows you GTC orders (good till canceled). Next, we share the charts for researching these highly independent trading instruments.

If you prefer stock options trading, we referenced the best choice underlying in our table, like SPY about the E-Mini S&P 500 futures contract. We then help you to identify with the NLT Delta Force Concept:

  • The strike price to choose.
  • The time to options expiration to select
  • The maximum premium to pay or to apply a different options trading strategy like a credit or debit spread, with the minimum premium to receive or the maximum premium to pay.

Whatever instrument you choose, here are the charts and NLT indications to base your decisions on:

Trade What You See, Let the Chart Tell When To Buy or Sell!

E-Mini S&P 500 Futures Conctract

30 Years Bond Futures

10 Year Notes Futures

Euro Futures

Australian Dollar Futures

Canadian Dolla Futures

Crude Oil Futures

Gold Contract Futures

Conclusion

In conclusion, our comprehensive analysis integrating the NLT SwingPower signal with the NLT Top-Line on weekly charts has yielded compelling results.

We are offering the two systems together in a bundle deal and are happy to demonstrate live how they perform:

Contact: contact@NeverLossTrading.com  Sub.: Demo

All our teaching and coaching is one-on-one; hence, spots are limited, and you do not want to miss out.

We are looking forward to hearing back from you,

Thomas

www.NeverLossTrading.com

Disclaimer, Terms and ConditionsPrivacy | Customer Support

Saturday, April 2, 2022

Trading in Silver Investing in Gold

Summary: Experience ways to trade and invest in precious metals by letting the chart tell when to buy or sell!

Gold has a history of being a long-term preservative of money, and this is why people and banks keep it in their vaults; however, today, you will learn how to make sound decisions going long or short in silver or gold.

NeverLossTrading Gold and Silver

There are multiple ways to participate in a value change of silver or gold:

  • Buying the precious metal in the form of coins or bars
  • Trading gold or silver futures
  • Working with ETFs that are directly related to gold and silver (GLD, SLV, e.g.) or their options
  • Investing in mining companies that are digging for gold and silver

Price is the result of a shift in supply and demand; hence, in times of stock market ambiguity, gold and silver come in demand, and we see rising prices.

Let us compare the price development of Gold and Silver and the S&P 500 for the past six months, referencing the E-Mini S&P 500 Futures Contract and Gold Futures. Futures contracts are instruments that are traded around the clock, six days a week, providing the best basis for real-time data. ETFs and stocks catch up to the futures development and gap.

Gold Price Development and S&P 500 Index

Gold Price Development Compared to the S&P 500 Index

The chart shows relatively falling prices for the S&P 500 Futures (-5.15%) and rising prices for gold (+7.99%), reflecting what we said before.

The next question: are gold and silver prices developing correlated or independent. To answer this, we take a three months comparison to see the following:

Gold and Silver on a Three Months Comparison Chart

Gold and Silver Three Months Development

Comparing the two precious metals shows that both prices correlated, while silver has even more significant swings to the up and downside.

Critical for every trading or investing endeavor is that you buy or sell at crucial price turning points, and you have to define those. As an algorithmic trading house, we use our systems and let the chart tell when to buy or sell.

Here is an example of the NeverLossTrading Top-Line Chart for gold futures. If you are not yet familiar with us: our brand name, NeverLossTrading, derives from the concept of trade repair, where we take corrective actions instead of accepting the stop-loss, and Never Stop Loss Trading was a bit lengthy. Hence, our name does not imply a promise of never losing a trade, but we share high probability trading systems and strategies.

With this said, let us take a recent chart example for gold futures.

Gold Futures on the NeverLossTrading Top-Line Chart

Gold Futures on the NLT Top-Line Chart

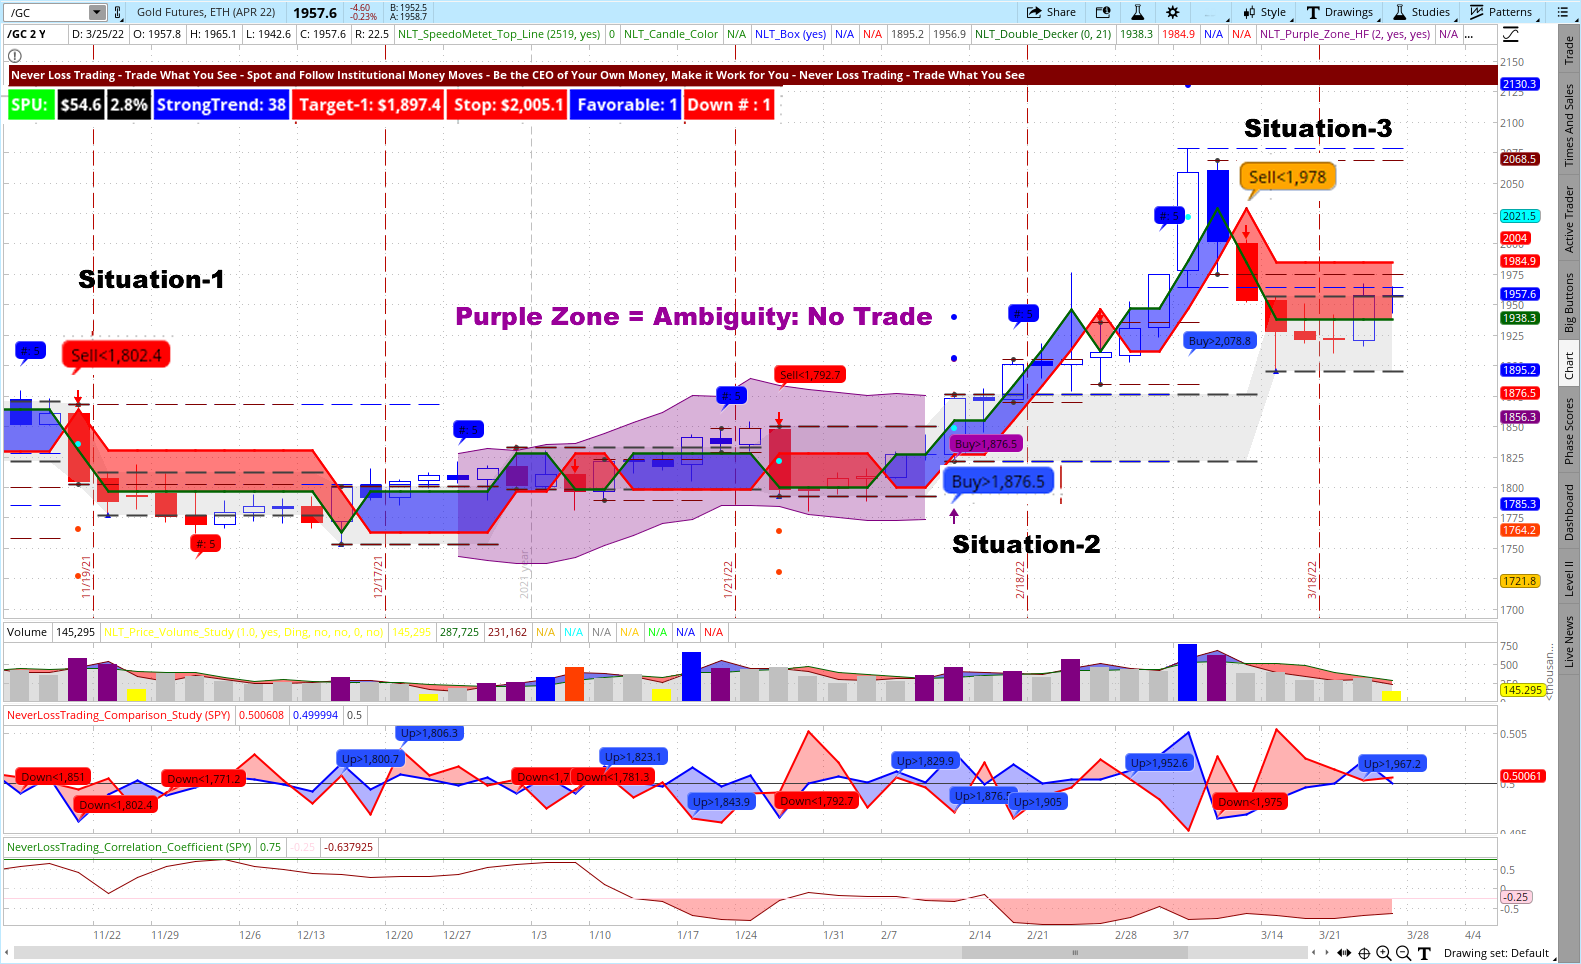
On the chart, we highlighted three trade situations and the NLT Purple Zone:

  • In the NLT Purple Zone, no price direction is found, and we are not accepting directional trade signals if they occur. When the purple zone ends, we have a high chance for a directional price move, as it happened in reality.
  • Situation-1: Sell < $1802.40 defined a short opportunity when the set price threshold was surpassed in the price development of the next candle, which was the fact. Hence we had a short selling opportunity, and the red dot on the chart specified where the exit was.
  • Situation-2: Buy > 1876.40 had its price threshold surpassed in the next candle and led to a trade to the upside for two target dots and the red line on the blue frame, covering the price development functioned as a trailing stop.
  • Situation-3: Another short opportunity, and the trade quickly came to target. On this signal, you do not see a dot on the chart, but you can read the expected price move from the dashboard on the chart:
NLT Top-Line Dashboard for Gold Futures

SPU is our measure for the expected price move. For example, on March 14, it was $54.60; the plan was to exit the trade when this price move from entry was accomplished. The NLT Top-Line dashboard also specifies targets and stops in discrete numbers and relates risk and reward: At the highlighted opportunity, the risk and reward balanced and proposed a favorable trade setup.

Let us take a quick journey to silver, for the same period:

Silver Futures on the NeverLossTrading Top-Line Chart

Silver Futures on the NLT Top-Line Chart

The chart shows two trading opportunities (two buy signals); both were confirmed and came to target. We teach in our mentorships how to participate in such opportunities with risk adequate or risk-limitings strategies.

Why is this important?

At the gold futures example, a risk of about 60 points was involved, which translates back to $6,000. When trading the micro gold futures contract, one risk unit was at a $600 risk, and if you decided to trade GLD or GLD options, we share strategies to scale down the minimum risk unit further.

We took trading gold and silver as an example, while our systems are used for finding and acting at crucial price turning points on Stocks, Futures, FOREX, and their derivatives, like options.

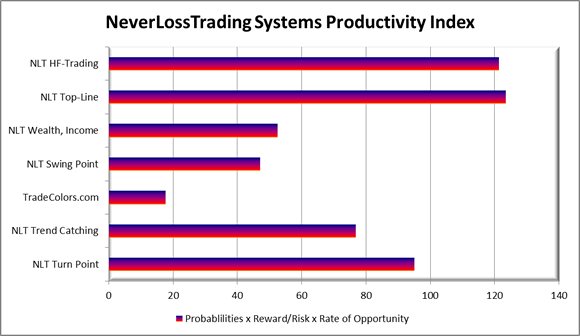
We offer multiple high probability trading systems: TradeColors.com is our entry-level system, and NLT Top-Line, is the top of the line.

Overview of the NLT Trading Systems

NLT System Index Productivity Comparison
NLT Systems Productivity Index

Take the chance and experience which of our systems fits your specific demand best:

contact@NeverLossTrading.com, Subj.: Consulting.

We teach one-on-one only, focusing on your wants and needs at your best available times. For more than ten years, we helped many traders to reach independence and constant income from the markets. Our mentorship entails multiple dimensions of trading knowledge, and with NLT Top-Line, you learn the details in 20 hours. The system also gives you your own scanners where you can find trading opportunities with NLT signals. If you want to rely on our services, we offer the NLT Alerts, where we daily report on potential trade setups.

NeverLossTrading Mentorship Program Elements

NeverLossTrading Mentorship Program Elements

Those are general categories; we tailor the mentorship specifically to your wants and needs and the trading styles you choose. You find more specifics on our blog and website.

Our trade indications show clearly defined entries, target exits, and stop levels (or adjustment levels). With that, your trade selection and execution are painted on the chart, and this is why we say, trade what you see:

“Let the chart tell when to buy or Sell!”

Take the chance for a free consultation meeting:

contact@NeverLossTrading.com, Subj.: Consulting.

Schedule your consulting hour! Working one-on-one spots are extremely limited: Do not miss out!

Follow our free publications and webinars…sign up here, and we are looking forward to hearing back from you,

Thomas Barmann

www.NeverLossTrading.com Disclaimer, Terms and ConditionsPrivacy | Customer Support