Summary: Find and execute stock trades in today’s market environment. Suppose you hold a solid portfolio of stocks in an IRA or other account and care about your financial freedom and well-being; read on and experience how to make a difference!
The typical stock trader follows the imperative: make the trend your friend. Since 2009 we have had a strongly up-trending market, but this reality changed starting in January 2022.

The market is choppy, and those who trade at crucial price turning points have multiple opportunities for producing returns with trades to the upside and downside.
SPY (ETF of the S&P 500) Monthly NLT Top-Line Chart
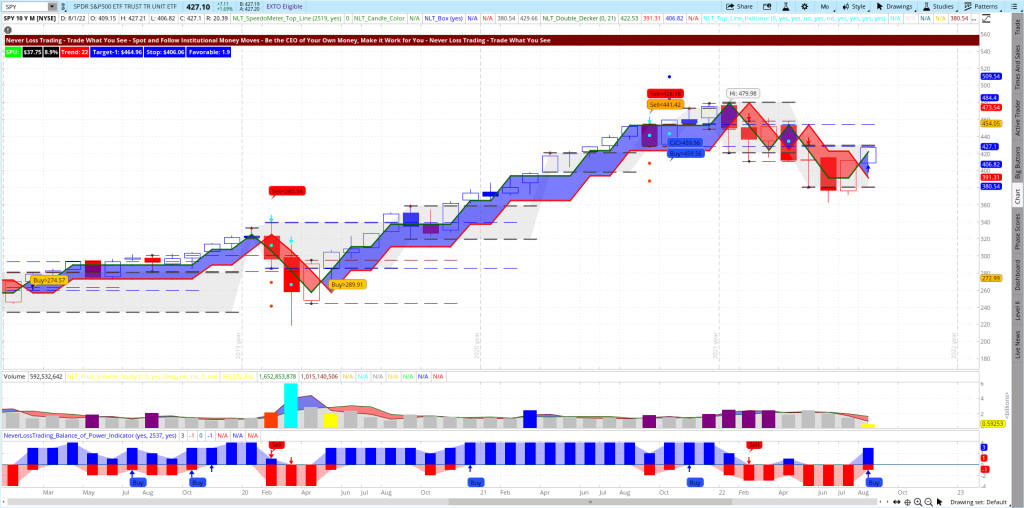
The chart above shows how our system finds crucial price turning points and if you want to follow an evolving trend, use the red line of blue or red frame around the price move.
In essence, you need a system that supports you in making sound decisions based on market reality. Finding and acting at crucial price turning points is not common knowledge; however, it is learnable, and we offer concepts and a step-by-step approach to follow.
Let the system tell you when and what to do, and your trading and investing endeavors will be more beneficial long term. We provide more than ten years of experience in helping people decide right from the chart when entering and exit positions and what to do to be your money manager, aiming to beat the index and the average money manager achievements.
You can control what you can measure; however, many stock traders never set measurable goals, praise their winners and neglect losers. So make a difference and learn a new trading approach!
Let me give you an example of a straightforward way of acting based on the NLT Top-Line chart:
- Indicators spell out buying- and selling opportunities: Buy > and Sell <. Buy and sell indications need to be confirmed in the price continuation of the next candle.
- Red lines on the chart signify stop lines.
Many private investors prefer technology shares. The QQQ is an excellent index that contains the major US technology companies, like AAPL, AMZN, TSLA, and MSFT, to name a few. We take a weekly chart in our example.
Our chart’s color up moves in blue and down movements in red; when the market is undecided, the chart shows an NLT purple zone, mixing red and blue, and we do not initiate trades in this zone by a lack of directional commitment.
QQQ on a Weekly NLT Top-Line Chart
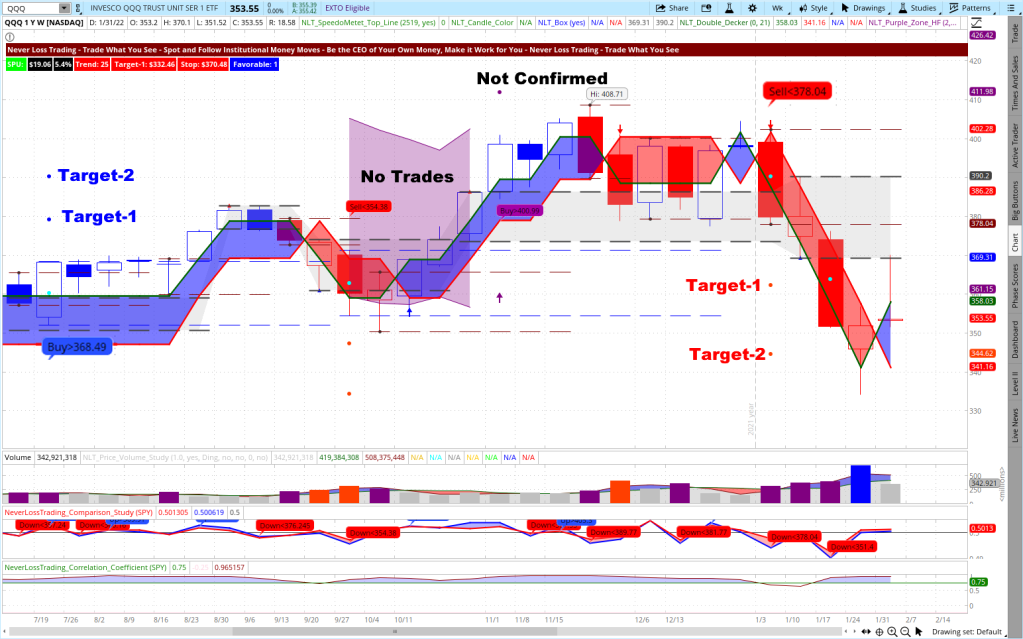
Let me explain the chart action from left to right:
- Buy > $368.49: the signal was confirmed in the price movement of the next candle, and a long position opened. Two target points were formulated, and after Target-1 was reached ($390.50), we closed the position and produced a 6% return on cash invested.
- If you just held your position, hoping the market comes back, the QQQ shares in this example would be at $350 and had produced a -5% drop.
Compare the two scenarios: The investor who decided based on our system produced an 11% difference in return. When you applied allowed trading methods to participate in the downside move, it offered an additional 9% gain – and we are talking about six months.
At this point, you might want to throw the argument:
“It is not permitted to short stocks in an IRA.”
True; however, we share the concept of how you can follow downwards moves with options trades allowed in your IRA; you only need to submit paperwork to obtain options level two for your IRA account.
On a $100k account, acting along with the signals, a $15,000 gain was possible compared to a $5,000 loss with a buy and hold strategy.
My question to you:
Are you ready to learn the rule of such a system to put them in action to trade when the market moves?
contact@NeverLossTrading.com Subj.: Stock Demo
We are more than ten years in business, working one-on-one with people to apply our systems and strategies:
- Best situations to trade on
- Strategies to apply
- Position-sizing
- Money management
- Discipline
- Financial and business plan and more…
Adult learning works best one-on-one, considering your risk tolerance and affinity to specific assets like stocks, options, futures, and FOREX. This way, you can learn at your best available days and times.
Let us present four trading examples, expressing how trading is best done in a mechanical way and manner:
- AAPL swing trading from a daily chart, June to August, 22
- BA on a daily chart, April to July, 22
- LULU on a chance in command price point, July 2022
- MSFT on a change in command price point, July 2022
If you want to see how our systems work in a live situation, schedule an online meeting with us:
contact@NeverLossTrading.com, Subj.: Stock Demo
Swing Trading Example 1
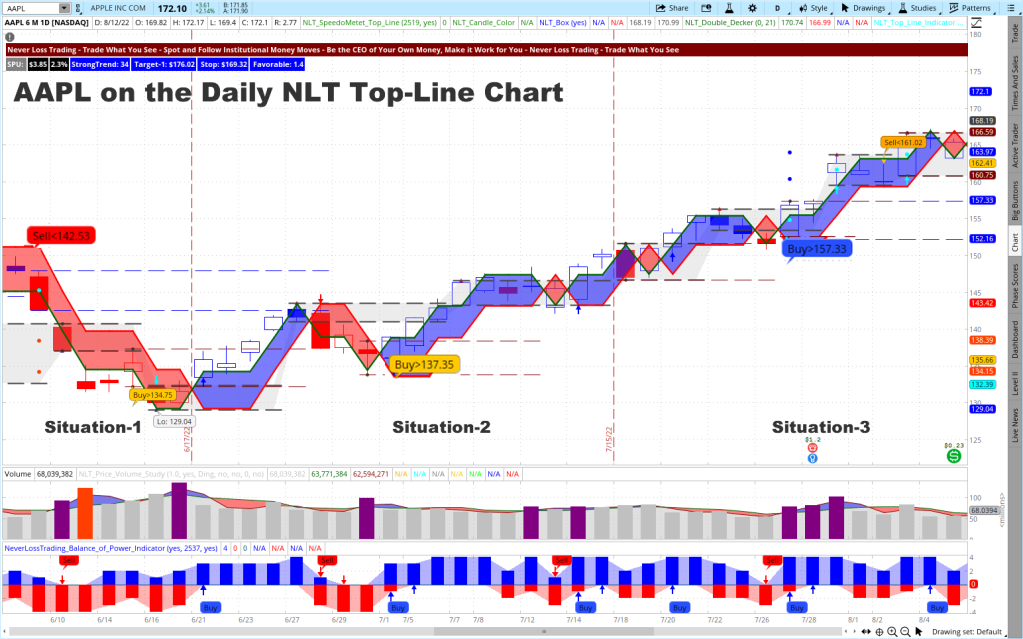
You see two more orange signals on the chart, which were not confirmed in their price direction and thus not considered.
As you see, we trade at crucial price turning points for pre-defined price moves, exit the trade and re-invest when our scanners find the next trading opportunity.
Swing Trading Example 2
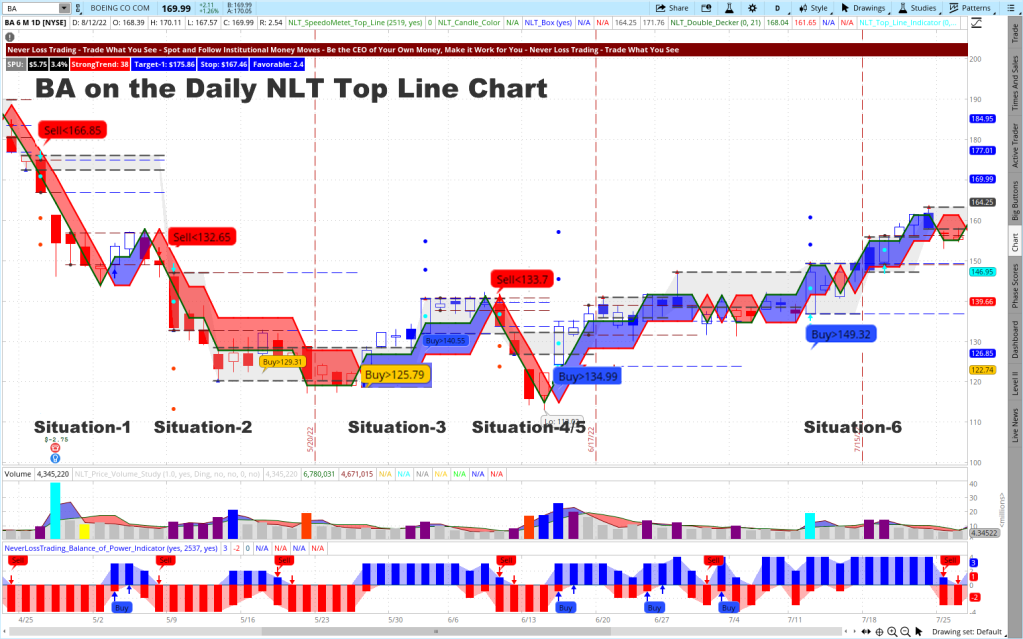
The chart shows six confirmed trading opportunities, three long and three short selling opportunities: By the concepts we teach, you can participate in both price directions with risk-limiting strategies.
Question: how do you find those trading opportunities?
NLT Top-Line has its scanners and watch list indicators so that you can scan the entire market, sectors or stock lists of your choice.
We also provide you with the NLT Stock Alerts, where those opportunities are highlighted for you with specified entry, exit, and stops. The NLT Alers are sent out daily in the early morning hours so our subscribers can be ready to enter conditional orders and trade without needing to be in front of their computers.
Here is an example of the NLT Stock Alert for July 28, 2022:

The three stocks highlighted had specified entry price levels to use conditional buy-stop orders to trigger when the entry price level was reached on July 28, 2022.

Let us take LULU and check on the trade situation and price development:
Swing Trading Example 4
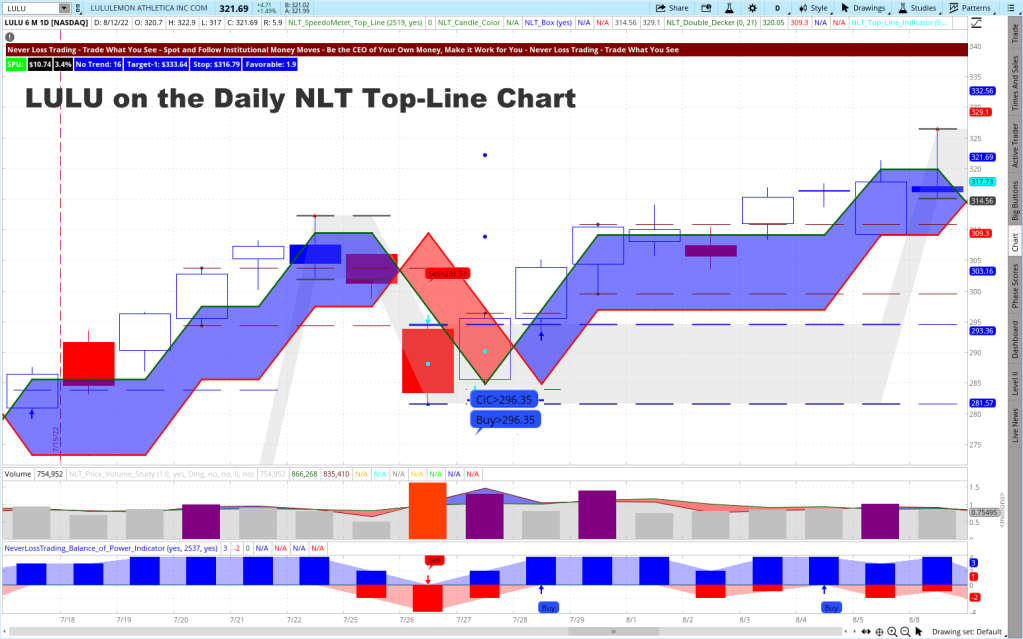
End of the day, July 27, the chart printed the buying opportunity with a price threshold of Buy > $296.35 and CIC, wich stands for a situation we call “Change in Command.” The system signaled that buyers took over from sellers, indicating that we have a price situation with a very strong price move potential to the second dot on the chart ($322 or a return on cash of 8.7%). The expanded price target was reached on 8/8/2022.
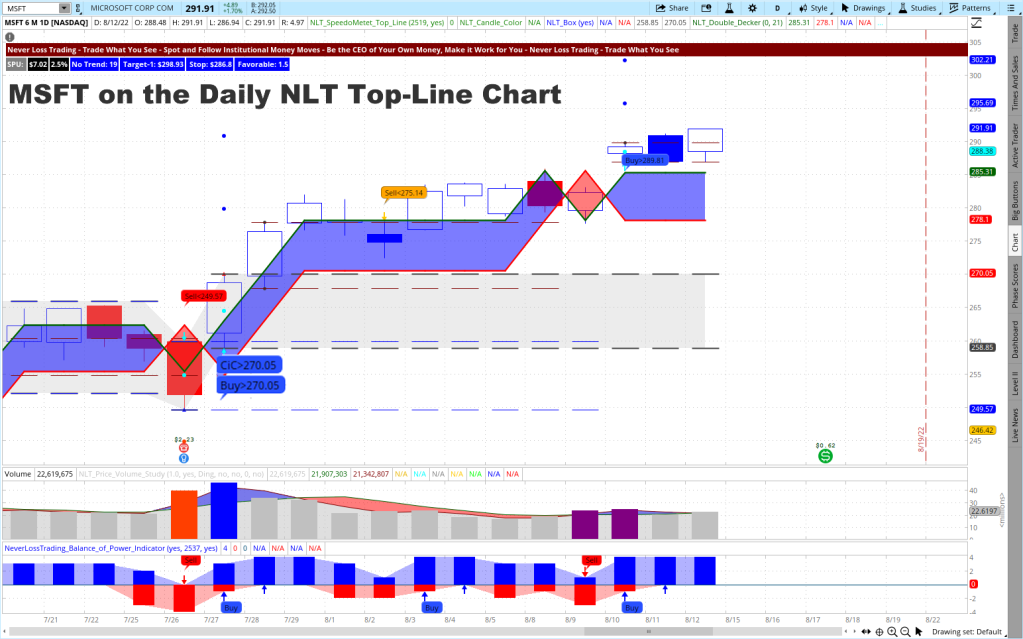
MSFT had a similar situation to LULU and reached its target-2 on 8/12/22 for a 7.6% return on cash.
Swing Trading Example 4
The price threshold for MU: Buy > $62.39 was not reached in the price development of the candle on July 28, 2022, and no trade was conducted.
We offer a summer special for NLT Top-Line and are ready to share more examples with you in a personal session:
contact@NeverLossTrading.com Subj.: Stock Demo
On the NLT Alerts, we highlight stocks with favorable options conditions. Thus they allow, aside from trading the stock, to combine stocks with options or trade the stock options with the NLT Delta Force Concept so that you can participate in the price movement of the underlying for a fraction of the investment and with high leverage.
We have over ten years in the trading education business, teaching one-on-one at your best available days and times, and we are trading our account day-by-day and helping clients lets us provide long-term experiences and support.
Customer service and tailored mentorships are our virtue. Following this principle, we provide:
- Server-installed Software
- Real-Time Data
- System-Defined Entries, Exits, and Stops
- Position-Sizing
- Time-in-a-Trade
- Trading-Strategies
- Risk-Handling
- Business Plan (financial- and action plan)
- Own scanners to find investment opportunities
- Watch list indicators for finding changes in supply and demand on multiple time frames
Basing your trading and investing decisions on defined rules is learnable, and we are here to support you!
Follow our free publications and webinars…sign up here, and we are looking forward to hearing back from you,
Thomas
Disclaimer, Terms and Conditions, Privacy | Customer Support


No comments:
Post a Comment