
Summary: Successful traders distinguish potential price moves that are random happenings from price moves that can be forecasted with a high probability. The science or art is in detecting signals and staying away from Noise.
More than 85% of all financial market transactions are institutional decision-based. Therefore, big money decides the direction and if a price-movement-initiation spotted is followed or countered. Hence, the market creates signal patterns that are detectable and predictable with a high probability. As a high probability situation, we specify a 65% or above predictability of the happenings to continue in the forecasted price direction.

Let us take a signal transmission model: Filtering technology helps to detect the signal and filter out Noise. Even when a signal is distorted, models like the Hamming Distance help to identify the underlying movement and fill in what is missing to forecast the content to a specified target.
At this point, it might sound abstract; however, it builds a crucial part of our algorithmic trading systems with an AI component. For programming such a system, you first describe the natural happening, and such, we formulate some of the observations to take:
- How do financial market transactions take place?
- Who are the decision-makers, and what is the basis of their decisions?
- How and when do price moves start and end?
Next is to find a mathematical model to replicate the actual market happening. Let me give you some examples:
- We are assuming a Markov-Chain-Happening: forecastable action in a predictable frame of activities, instead of considering a Finetti relation of a random happening.
- Mandelbrot iterations help us to consider the action of now: The result of each market action is used as the starting value for the next iteration. The values are checked during each iteration to see whether they have reached a critical “trade” condition or “bailout.” If a trade condition is found, the calculation is stopped, and a potential signal is drawn on the chart, spelling out the next price value to be reached and the statistical volatility to get to the examined target value without a high likelihood of getting stopped.
- Filtering technology to express higher over lower likelihood happenings
- Price expansion calculation and stop, considering the actual statistical volatility of the happening.
What we explain above and more happens in the background, and we wanted to invite you into our thinking. However, you do not need to understand and learn all this. Still, we wanted to express that simple moving average calculations, or similar iterations will never be able to provide high probability trade setups. So we calculated the difference between a model with a 55% probability to one of 65% and estimated the expected win rate of 10 trades by a Bernoulli experiment to win six or more trades out of ten. We explained how to put together an experiment with marbles, but let us take a shortcut here:
- A 65% system gives you a 75% chance to predict and win six or more out of ten trades.
- A 55% only gives you a 50.4% chance for six or more winners (random predictability).
You know now why we propagate high over low probability for retail traders.
We offer several systems: TradeColors.com is our beginner system and is included in all other systems. In this publication, we like to share a combination of NLT Top-Line, Trend Catching, and NLT Timeless Indications.
NLT Top-Line has multiple price charts and lower study indicators for trading at crucial price turning points:
- Strong Price Turning Points: NLT Power Towers stand tall and point a direction (blue and red, buy> and sell<)
- Tops and Bottoms: NLT Early Buy or Sell, pointing out more considerable directional price moves (orange buy>, sell<)
- End of Purple Zone. We color up-moves in blue and down moves in red; when a time of ambiguity in price direction (purple buy> and sell <).
- Strong money in our outflow, showing institutional engagement (lower study)
- Correlated or uncorrelated to the overall market move (lower study)
- Historical price projection to understand what others expect (upper and lower study)
- and more
NLT Trend Catching differentiates
- Trend Initiation Signals (gray buy > and sell <)
- Trend Continuation Signals (gray Buy_C and Sell_C)
- Balance of Power: Buyers or sellers in Charge (lower study)
Why to combine those systems?
For a higher participation rate: more trades and accuracy with indicators that take a different market cut by not being correlated.
NLT Timeless Day Trading Examples /ES

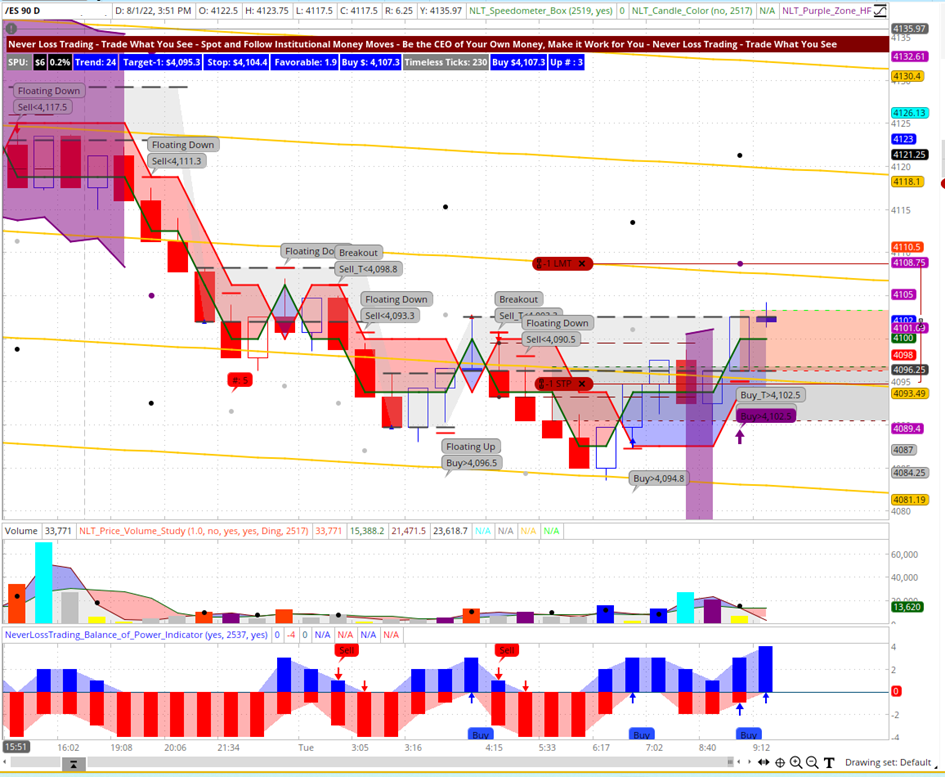
At the time of writing this Article: August 2, 2022, this was the chart situation on the NLT Timeless Chart (candles form price-based, not time-based). There are six trade situations to discuss:
- We are taking a mechanical approach considering every opportunity when a signal appears on the chart.
- The gray or purple dot on the chart specifies the target
- The red crossbar is the stop
During your training, you will learn not to consider every situation painted on the chart. In this example, we accept all signals, with the condition to not enter, except for an opposite-facing candle signifying a new trade potential.
Situation-1: After a purple zone, indicating price ambiguity, and we do not consider signals, an end of NLT Purple Zone signal (NLT Top-Line), combined with an NLT Trend Catching signal announced a short potential that came to target two candles after entry: win.
Situation-2: NLT Trend Catching Signal: Sell_C<$4100.80, confirmed trend continuation entry to target (gray dot, reached in three candles): win.
Situation-3: Bottom reversal signal (and you will learn not to take this signal: in a downtrend, the first leg long is wrong!). However, we take a mechanical approach here: losing trade.
Situation-4: Short signal with a floating indication: Floating is part of the NLT Timeless Concept and specifies a situation where the price moves into open space and such has a high likelihood to come to the target: win.
Situation-5: Gray Buy signal that came to target.
Situation-6: End of Purple Zone buy signal, and at the time of writing this publication, the trade was open, but we took it, and it came to target: win.
Here is the trade entry photo of the account where we trade one /ES contract or never take an equity trade with a higher than $400 risk.
For day trading, we always operate with bracket buy-stop or sell-stop orders. The order is only filled when a pre-defined price level is reached and automatically stops and targets in place.
In our trading chart, we also consider price-volume happenings, and the colors on the volume bar tell a story of higher-level engagement on highlighted bars. The price-volume study is part of NLT Top-Line, and we run a summer special for the system combination, which we are happy to share with you in a demo.
contact@NeverLossTrading.com, Subj.: Demo
NLT Timeless Day Trading Chart on August 2, 2022
Following specific rules in trading is essential, leaving only very little room for discretionary decisions. Very little interpretation:
Trade What You See!
Let the chart tell when to buy or sell!
By the way, the brand name NeverLossTrading does not promise never to lose a trade; it derives from the concept of trade repair and Never Stop Loss Trading was a bit lengthy.
The following example shows an NLT Timeless Swing Trading example:
NeverLossTrading Timeless Swing Trading Chart
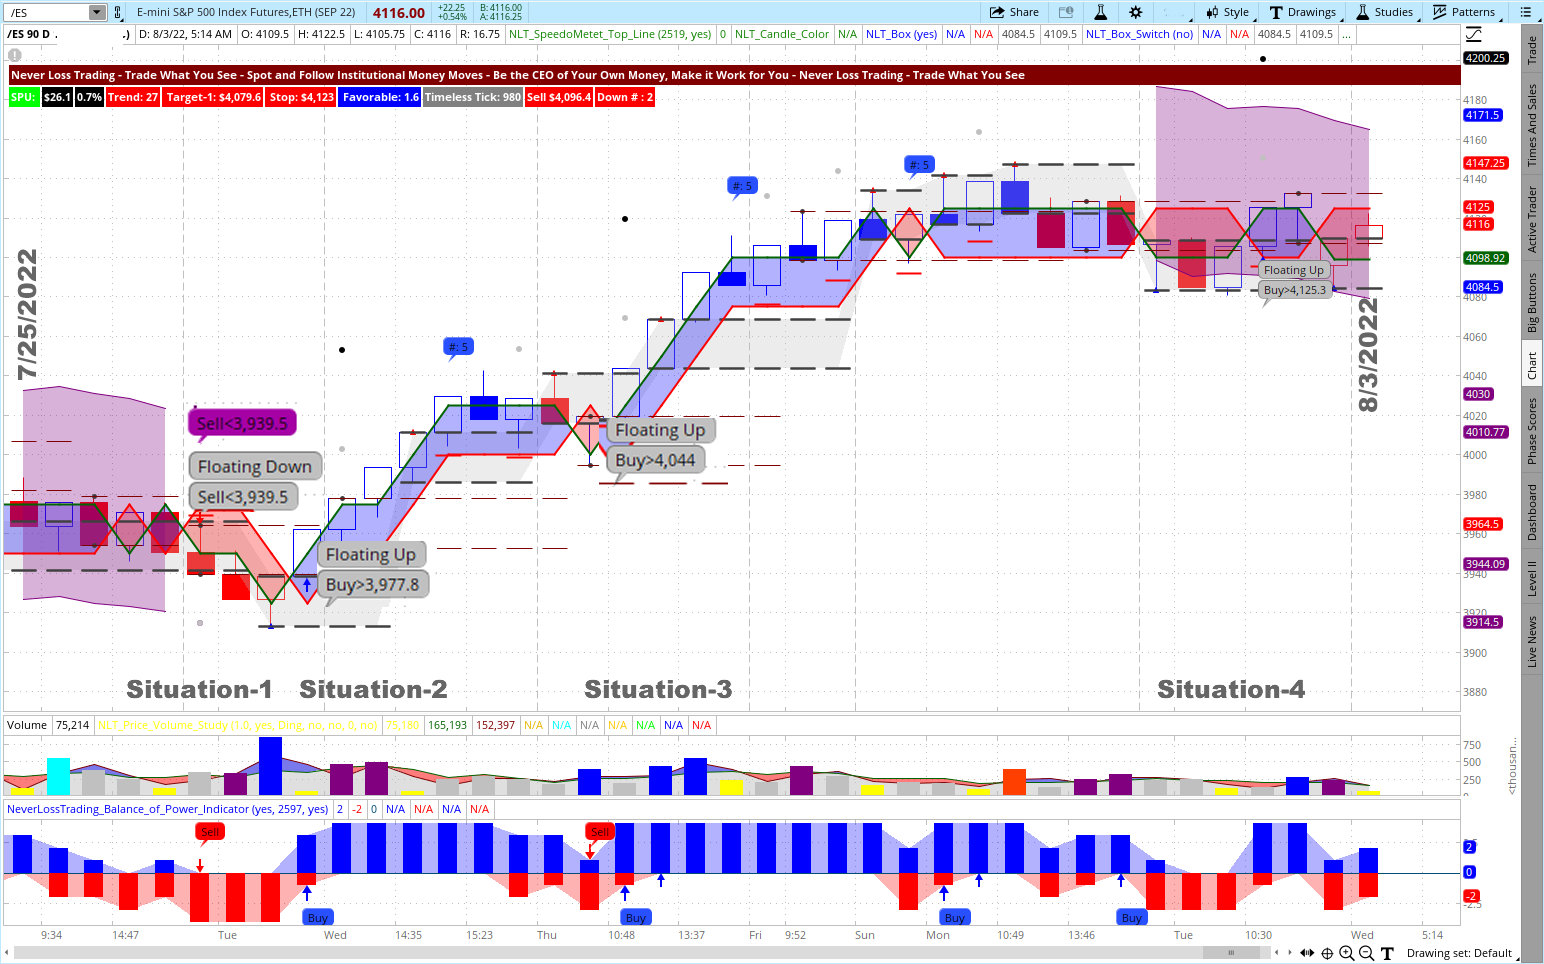
The chart shows NLT trade indications between July 25 and August 3, 2022, describing four situations we now explain:
Situation-1: After directional price ambiguity, the NLT Top-Line End of Purple Zone signal and the NLT Trend Catching Sell signal pointed down, and the trade direction was confirmed and came to target by reaching the gray dot on the chart.
Situation-2: A bottom was found, the buy signal confirmed, and an upside trade was initiated. The first target was at the gray dot. If you want to trail your transaction, use the red line of the blue frame and exit at the black dot or 3-SPU level.
Situation-3: A trend-continuation signal after a short retracement and another uprun to target or to be trailed with the red line the black dot: 2-SPU level.
Situation-4: on August 1, 2022, an NLT Purple zone opened and told us not to initiate swing trades until it was over.
In our prior publication, we used the same chart with continuation signals switched on, and you will see more swing trading opportunities along with the price movement.
After the NLT Timeless examples, let us dive into time-based trading: We use the same indicators and pull up a price chart for Apple Corp. (AAPL) from June 8 to August 3, 2022.
Do you see four or potentially five trading opportunities (one short – sell signal in red – and three long opportunities – buy signals in gray and red)?
If yes, you understand what we mean by letting the chart tell when to buy or sell; if not, challenge us for a free demo:
contact@NeverLossTrading.com Subj. Demo.
AAPL Daily NLT Chart: NLT Top-Line and Trend Catching
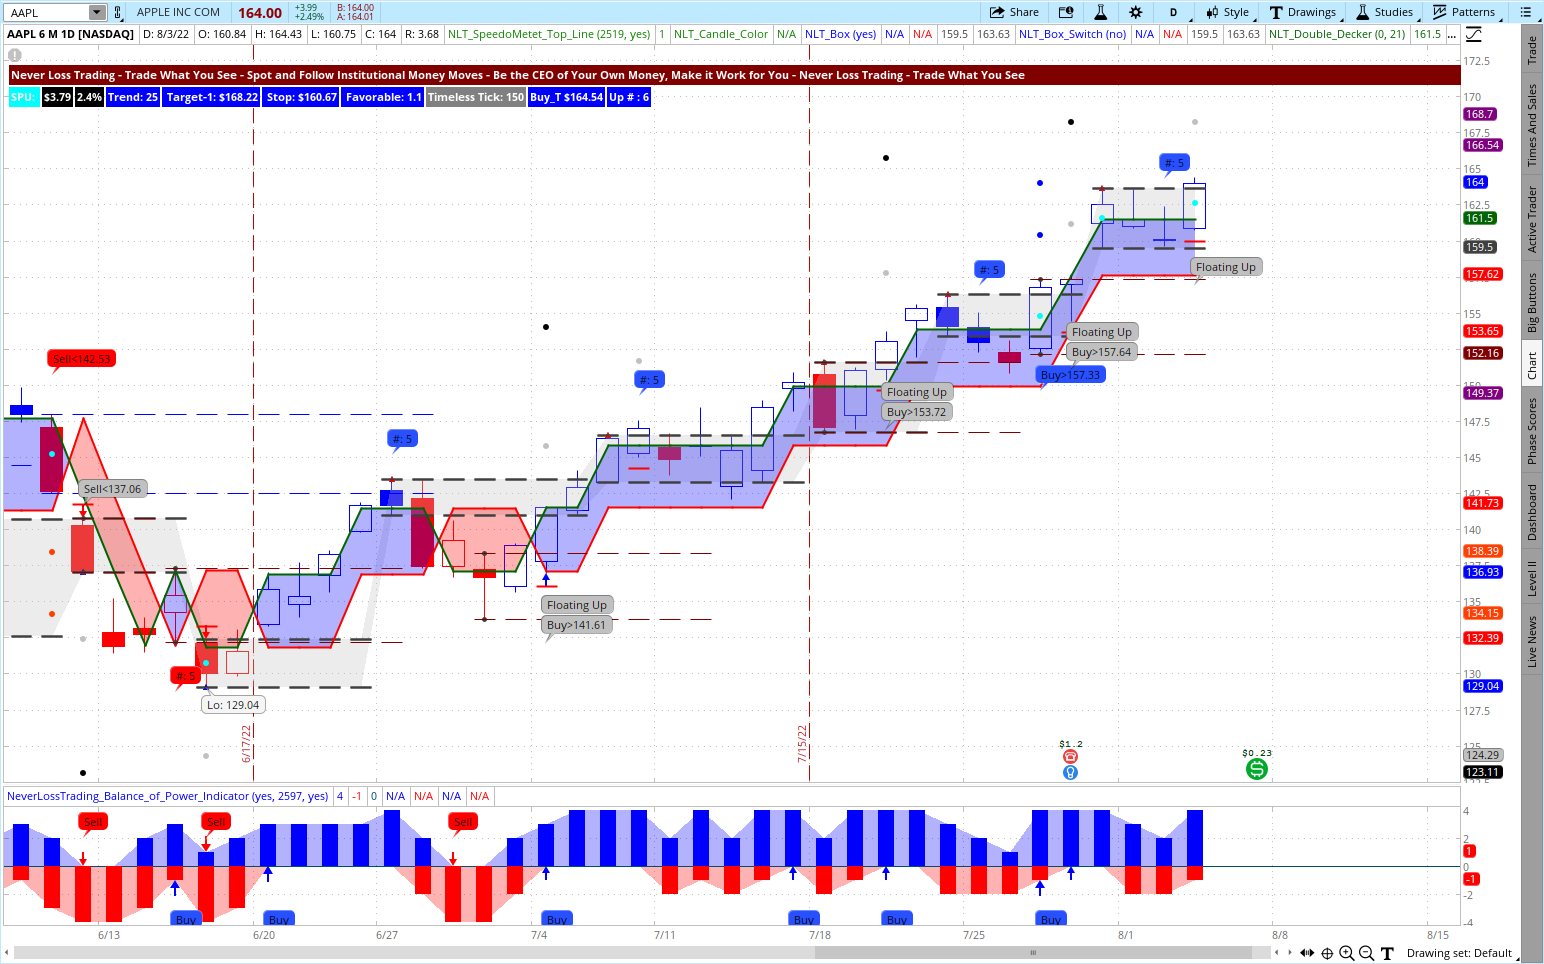
The trade situation on the chart is not magnified, leaving it up to you to test what you see.
Only if you have a solid decision-making base, supported by a system that helps you to identify high probability trade setups, will you have the chance to trade for constant income from the financial markets as a time-based or timeless trader. You can learn both concepts in our mentorships and more.
Here is a longer-term timeless chart, and please check yourself which situations to take:
NLT Timeless Longer-Term Chart March to August 5, 2022
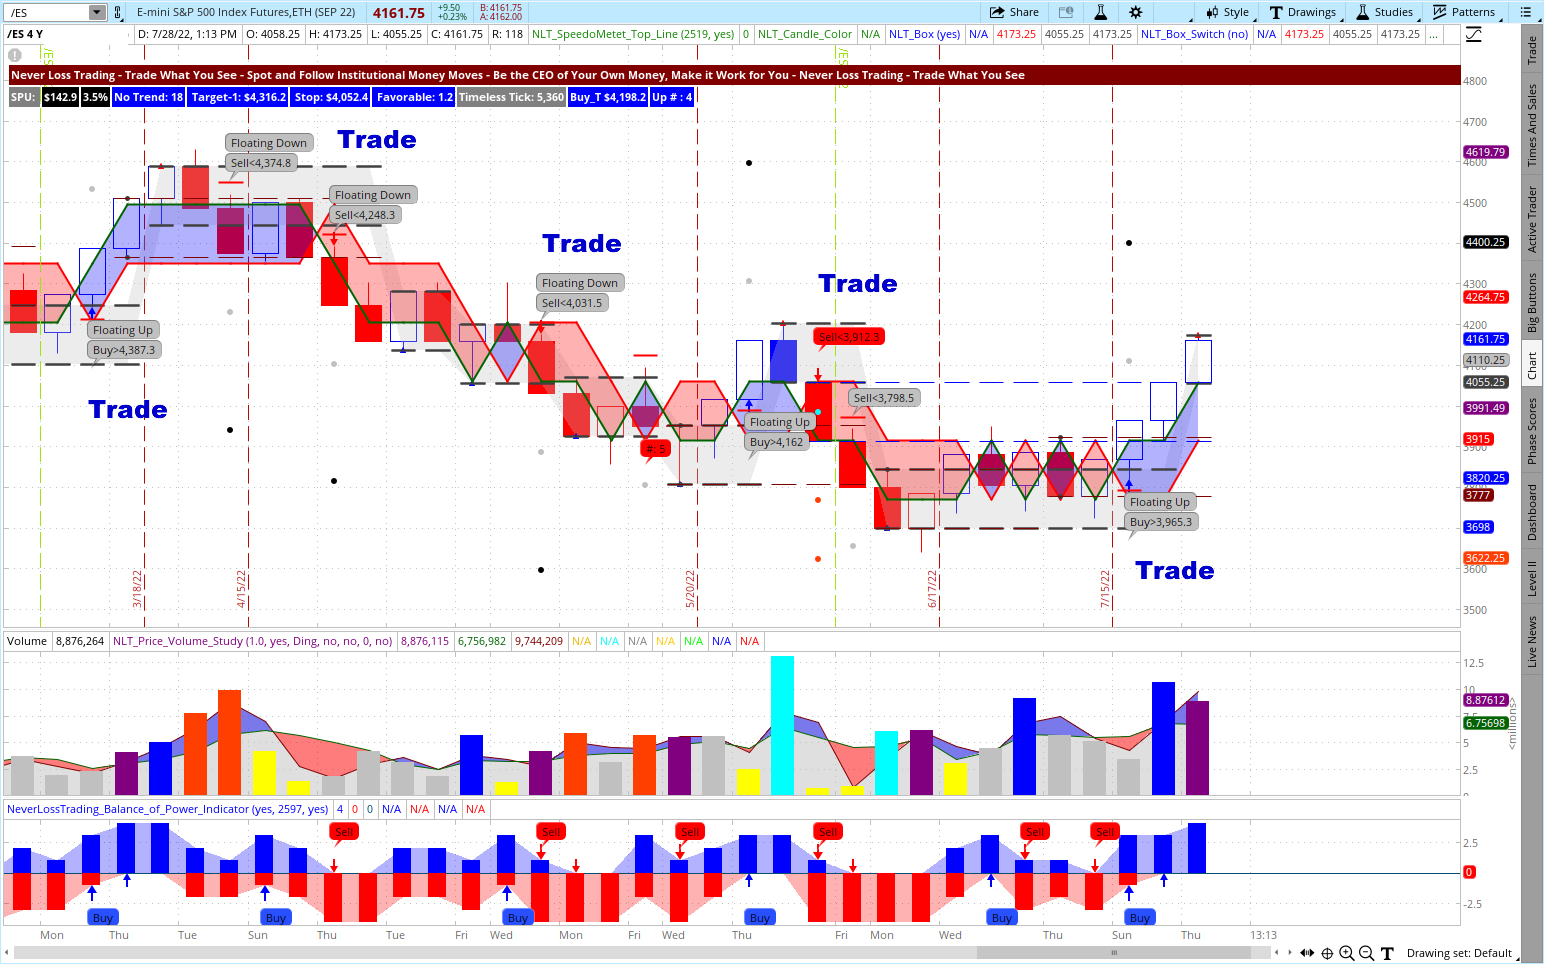
Even if you went long at the one trade we would never have taken, the chart would have given you five winning and one losing trade: we call high probability. Each trade was good for a price change of the underlying /ES futures contract of $7,500, with an associate risk, if you traded the /MES, 10% of it, $750.
We know and acknowledge that every trader is different. Hence, we tune our systems and teach to your specific wants and needs, supporting you to turn yourself into the trader or investor you want to be, teaching one-on-one at your best available days and times.
Let us share an overview of learning elements to take away from our training and coaching sessions, which vary based on the system you choose, from four to twenty hours of teaching.
Summary of learning elements:
- Acting with a system probability > 65%
- Mechanical rules for entry, exit, stop
- Trade at perfect moments only
- Consider overall factors, patterns
- Risk and reward in an acceptable balance
- Risk-averse trading
- Holding positions to target
- Do not add to losers
- Stick with a trading strategy. Follow a business plan – action plan and financial plan
- Trade for meaningful price moves
- Systematic trading
- Having a mentor to learn from
We also help you to journal your trades. Such a journal provides excellent feedback on how you are developing, and you find a perfect example in this article on our Blog: How to Control Your Trading Results
To succeed in trading, you best work with an experienced coach and learn much about trading. Our #1 competitive advantage is the support and customer service we offer. We work one-on-one with you to specify what we teach to your specific wants and needs; hence, if your knowledge base is not expanding rapidly, you are doing something wrong.
Ongoing education and mentoring are crucial to longevity in this business.
Veteran traders have been through more ups and downs than you can imagine. So whatever you’re going through, experienced pros have probably experienced it already.
If you are ready to make a difference to your trading:
contact@NeverLossTrading.com Subj: Demo.
We are ready to share our experiences and help you build your trading business. Trading is not a typical career, and you best learn from those who are long-term in this business to cope with the rollercoaster of the financial markets. We are here to help and provide feedback on what you might be doing right or wrong.
Strive for improved trading results, and we will find out which of our systems suits you best.
We are happy to hear back from you,
Thomas Barmann (inventor and founder of NeverLossTrading)
Disclaimer, Terms and Conditions, Privacy | Customer Support

No comments:
Post a Comment