
We write the year 2023 and invite you to participate in the financial markets with high probability trading, accurately forecasting more than two-thirds of the price developments. Still, this is not a guarantee to make money, there is more involved, and we will guide you through the critical elements in this article.
Algorithms can estimate price turning points and trends in the financial market differently than humans can achieve alone: Computers instantly process large amounts of data, making decisions more reliable.

NLT systems generate indications for directional price changes; however, the order placement is supervised and executed by humans. Now you know why we call NeverLossTrading, algorithmic trading with human interaction. Our algorithms measure underlying changes in supply and demand and extrapolate crucial price turning points. The time horizon can be anything from:
- Intraday trades (opening and closing positions on the same day)
- Swing trades (holding positions for multiple days)
- Longer-term investments (holding positions for weeks and months)
In the past, algorithmic trading was solely available to institutional investors, but we put in the work and effort to offer adequate systems to retail traders at affordable rates. Our offering for NLT systems ranges from about $2,500 for TradeColors.com to $15,500 for the combination of NLT Top-Line and Trend Catching, and we work one-on-one with you to apply our systems for your decision-making best.
With NeverLossTrading, all financial markets can be traded, while we mainly focus on liquid markets in the arena of stocks, options, futures, and FOREX. We offer a robust framework of constantly adjusting to actual algorithms that contain an AI component and, with that, recalibrate constantly. Our systems provide broad flexibility because they allow us to scale up and react quickly in different products and markets. The most practical approach for us is to use algorithms to process data and then leave it to humans to make the decisions. Price, volume, and volatility are our data inputs to mathematical models. In addition, we teach various strategies to act on price changes, limiting the risk and leveraging profit opportunities.
The advantage of NeverLossTrading is that it allows for the optimal use of available data and reduces or eliminates the emotional decision-making that can occur during trading.
Our algorithms collect underlying changes in supply and demand to extrapolate potential price moves with system-defined entry, exit, and stop decisions. At this point, we best share some examples to demonstrate what our systems can do:
TradeColors.com is our entry-level system for algorithmic trading. The system looks for continuation patterns and colors the candles: up-sequences in blue and down in red. After a new two-candle-color-sequence is painted on the chart, the system spells out a buying or selling opportunity with a price threshold:
- Buy when the high of the second blue candle is surpassed in the price movement of the next candle
- Sell when the low of the second red candle is surpassed in the price movement of the next candle
This way, you can work with buy-stop and sell-stop orders.
TradeColors.com and all our systems apply to all time-frames, asset classes and what we call timeless trading: we only consider price change as the decisive element, leaving the time component aside.
Timeless Day Trading Chart by TradeColors.com
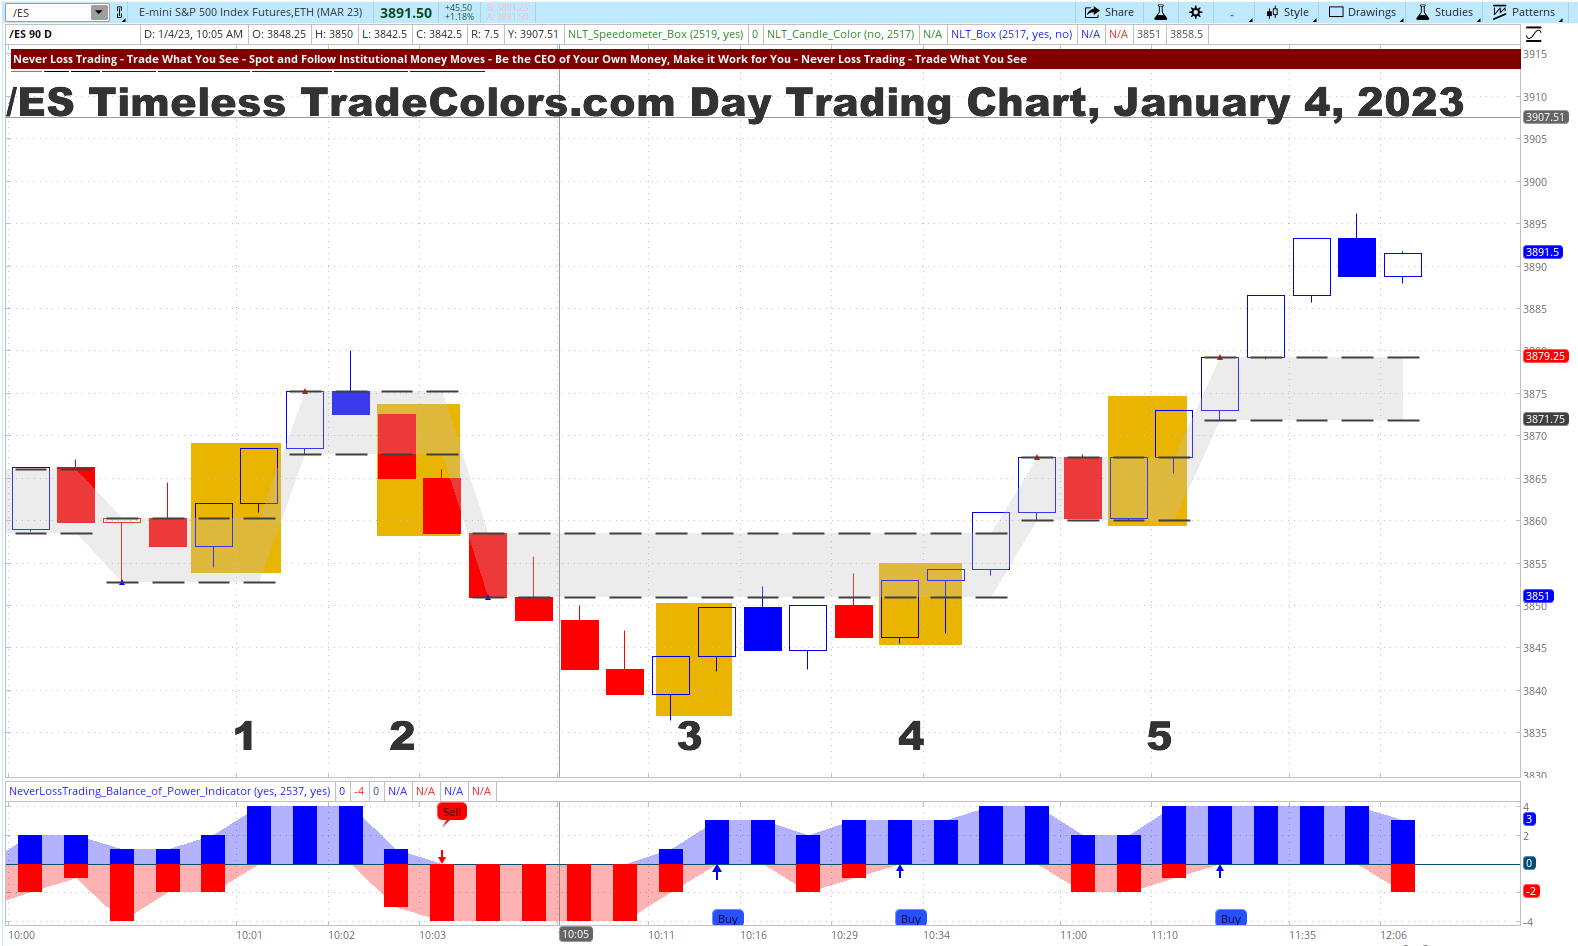
The system highlighted five critical price turning points in orange rectangles. In those situations, our algorithm indicated two new same-color candles. The chart showed five potential trade situations on January 4, 2023, between 10 a.m. and noon. You see a timeless chart where the basis for a candle is a system-specified price move. With the help of the NLT Timeless Concept, risk and reward are always in an acceptable system-set relation. In the highlighted time, all trades came to target; however, this is not always the case, and we assume a 65% or higher probability to forecast price moves with this system.
META on a Weekly Chart with TradeColors.com
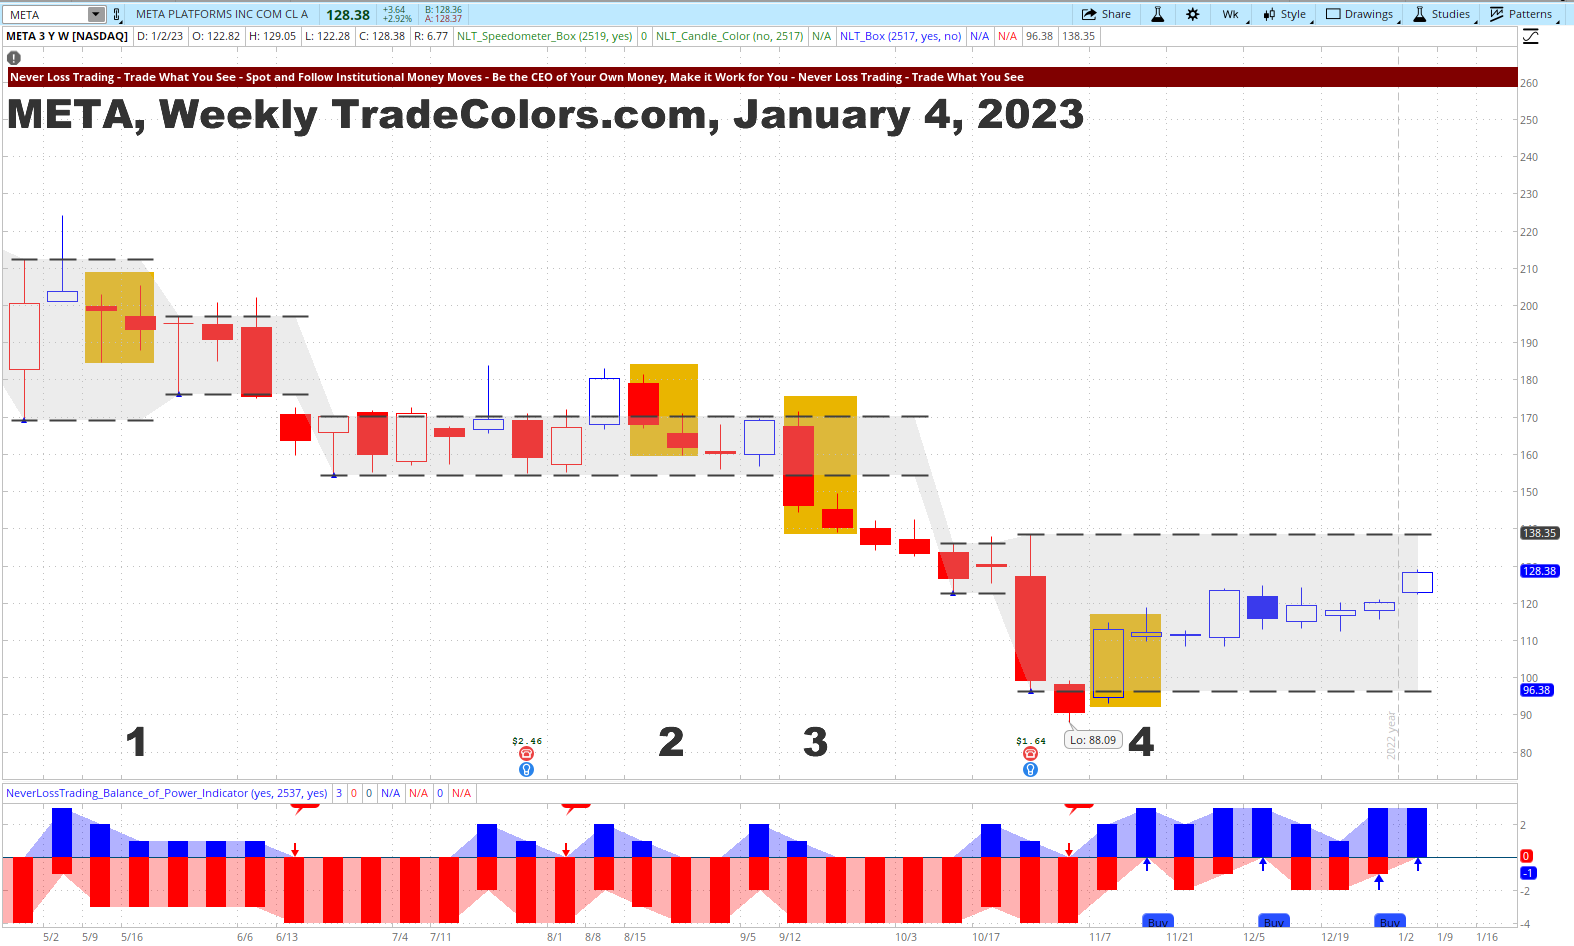
META, on a longer-term perspective (weekly chart), showed four trade situations. The TradeColors.com algorithm assumes a transaction to close on time-based charts at candle three, either by reaching its target or closing the trade at the close of candle three. Given this condition, all trades closed with a positive result. In case you want to follow the downside direction by trading from an IRA, we share in our mentorships ways to apply options trading strategies that gain value when stock prices fall and are allowed in any account. TradeColors.com is our entry-level program for algorithmic trading, and many of our clients upgrade later, where tuition paid will be deducted from the price of the new program.
NLT Top-Line is our flagship product indicating strong points of price change. The program provides market scanners and watch-list indicators for clients to analyze the markets and find investment opportunities on their own. Aside, we offer financial market alerts for trading opportunities in stocks, options, futures, and FOREX. Our NLT Alerts are Excel-based, allowing you to condition them to your wants and needs. Some training is needed to read the alerts; however, we will send you some samples for two weeks if you want a glimpse.
contact@NeverLossTrading.com Subj: 2 Weeks
SPX, Weekly NLT Top-Line Chart
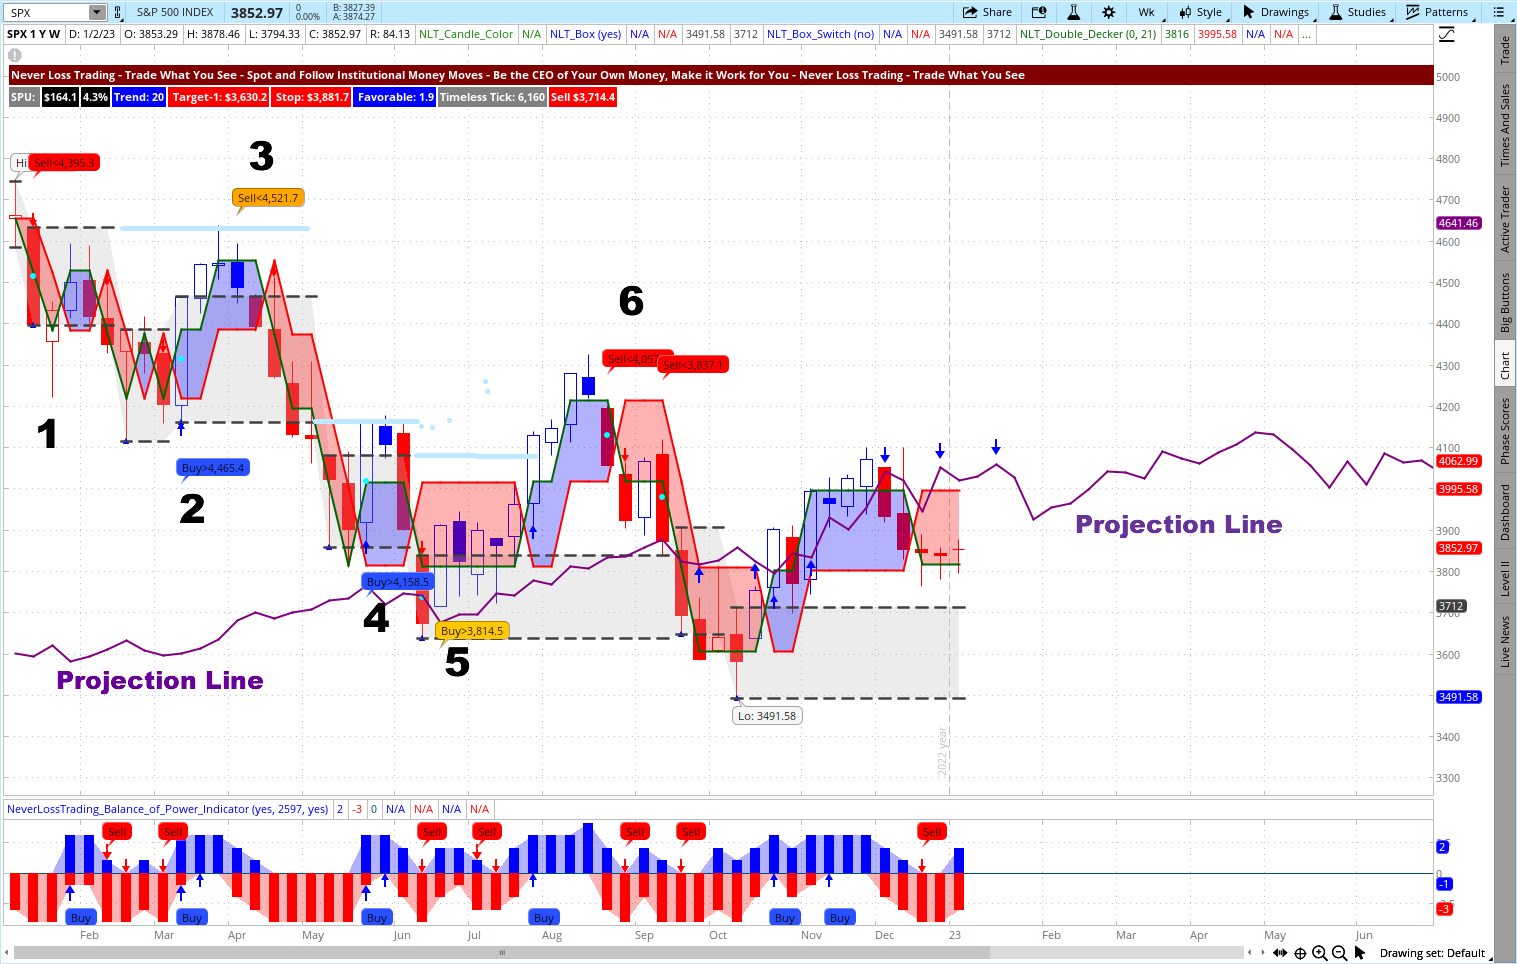
The above chart shows the S&P 500 Index development on a weekly NLT Top-Line chart. It highlights six crucial price turning points and demonstrates our bear market experience in the past year:
- Substantial market drops, highlighted by sell signals
- Upside reversals failed at system-indicated lines (NLT Box lines, drawn out in light blue
- What we call a projection line is where we assume prices to conglomerate after a strong price move, working like a magnet, attracting the price of its move to this line.
Do you have such a system on hand, helping you to make sound chart-based decisions about when to invest and how?
Let us meet online and show you live performances when you feel this could be right for you.
contact@NeverLossTrading.com Subj.: Demo
NLT Trend Catching was developed to trade multiple times in the development of up and down trends. Combining both systems gives traders a powerful combination of indicators to frequently participate in the financial markets with straightforward entry, exit and stop decisions.
XLK, NLT Trend Catching and Top-Line, 1h Chart
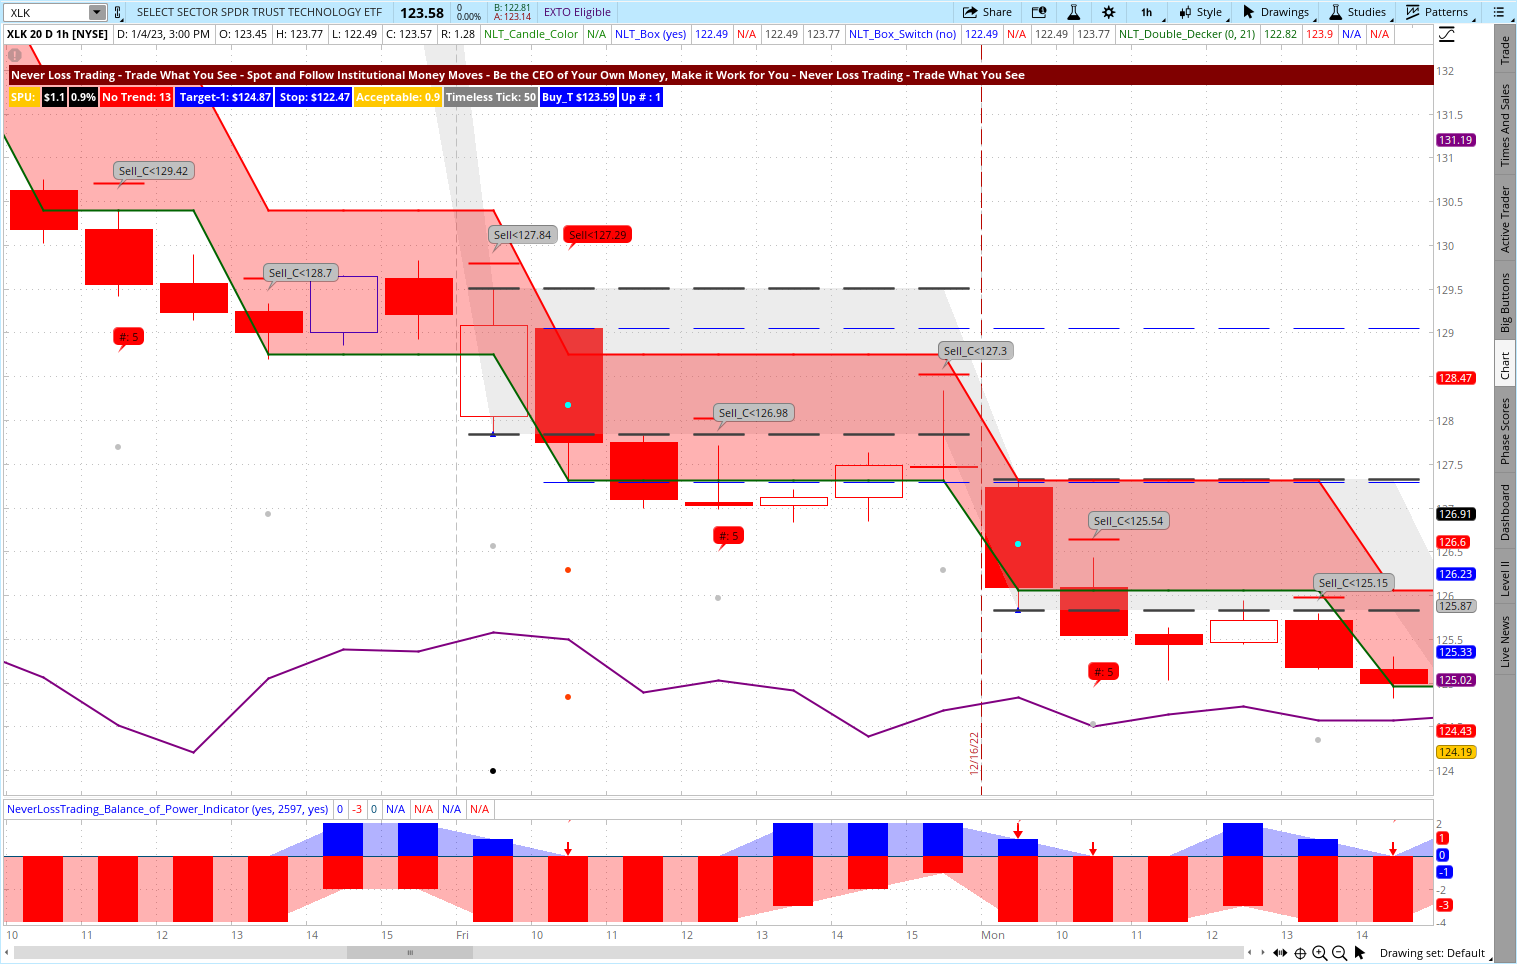
The XLK chart paints the opportunity to participate in multiple trend-following trades with the combination of the two systems. For example, if you wanted to trail your stop, the red line of the red frame was the trailing stop line.
To be part of this combination or any other of our systems, schedule a consulting hour, and we will jointly find out what suits you best.
contact@NeverLossTrading.com Subj.: Demo
Depending on the trader’s preferences, our systems will deliver according to your wants and needs. We support you with appropriate trading strategies and a business plan to follow (financial and action plan, telling how often and when to trade). Trading is a professional business, and professionals are prepared, so we do not leave everything up for chance; we work a structure for the trading success you strive for.
If you prefer day trading, here is a chart that our system generated throughout the main trading hours on January 4, 2023, for the E-Mini S&P 500 futures contract.
/ES, NLT Timeless Day Trading Chart, January 4, 2023

Multiple trading opportunities with a pre-specified risk/reward relation were painted on the chart for our day traders to act with bracket orders.
Explaining all you see on the chart would be excessive, and we prefer to do this on a demo.
The objective of trading is to approximate the probability of executing a profitable trade. A typical trader can effectively monitor, analyze and make trading decisions on a limited number of observations before the amount of incoming data overwhelms the decision-making process. Our algorithms and chart setups illuminate this limit by using computers to automate the monitoring, analyzing, and trading decisions. Overcoming emotion is one of the most pervasive problems with trading, and we help you with our system to form high-probability conclusions and apply risk-limiting strategies. Our systems have an AI component and always calibrate to actual, offering you dynamic models that work under any market condition. As our client, you do not have to learn the math behind the systems but the rules to follow.
Trading is learnable: we take a holistic approach considering all crucial elements needed to succeed: It takes multiple dimensions to turn yourself into the trader or investor you want to be, and we support you in acquiring the knowledge and skills needed.
Success Factors for Trading and Investing

NeverLossTrading stands for high-probability algorithmic trading, where you stay in command of pushing the trade opening button: target and exit are systems defined, and you will only act in situations where risk and reward are in a meaningful balance. We are happy to share our experiences and help you build your trading business. Trading is not a typical career, and you best learn from those who are long-term in this business to cope with the rollercoaster of the financial markets. We are here to help and provide feedback on what you might be doing right or wrong.
Strive for improved trading results, and we will find out which of our systems suits you best.
The markets changed, and if you do not change your trading strategies with them, it can be a very costly undertaking.
We are looking forward to hearing back from you,
Thomas Barmann (inventor and founder of NeverLossTrading)
Disclaimer, Terms and Conditions, Privacy | Customer Support

No comments:
Post a Comment