
Research Findings
In the dynamic realm of financial markets, traders continuously seek reliable indicators to navigate the complexities and uncertainties. Among the myriad tools available, NLT signals stand out by their purported ability to provide actionable insights into market movements.
This article delves into the power of combining NLT Top-Line and NLT SwingPower (our newest development) for a higher participation rate in directional price moves, and we document the mechanical performance of trading signals when confirmed.
- NLT Top-Line highlights crucial price turning points early at momentum changes.
- NLT SwingPower recognizes underlying changes in the frequency of transactions, often preseeding a solid directional price move and extrapolating a price move forecast.

In our research, we took a longer-term trading approach to investigate the trading performance of weekly chart signals.
Methodology
Stock market indexes usually have less directional price pressure than stocks; however, we want to take the challenge and pick:
- Two ETFs related to stock market indexes, SPY(S&P 500) and QQQ (NASDAQ 100)
- Three independent stocks (AAPL, UNH, and UPS) that fulfill the NLT Options Trading Requirements to trade them with the NLT Delta Force concept
We mechanically compare signal congruence and win rate between July 24, 2023, and March 8, 2024. and see how the indicators supplement each other and how frequent price moves happen jointly with the index or independently.
Analysis of Confirmed Signals
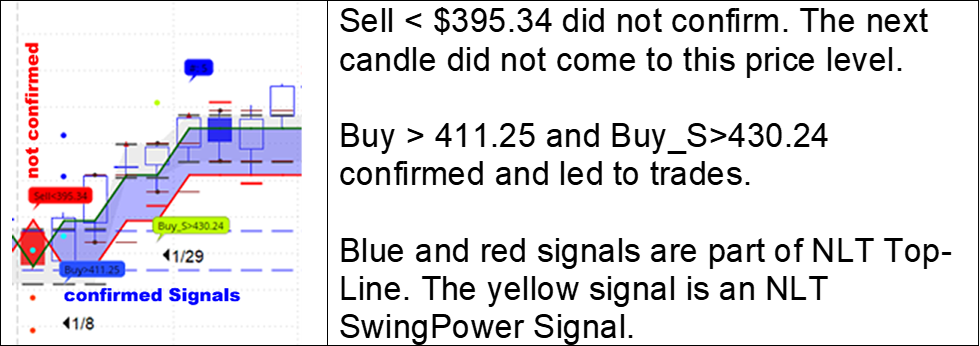
Each NLT signal spells out a price threshold: Buy > or Sell <; the next candle’s price movement must tick out the set price threshold; otherwise, we will ignore it. Dots on the charts are exit points.
Examples of Confirmed and not Confirmed Signals
After an in-depth chart analysis, we let the chart tell when to buy or sell, and we documented the following results:
The five symbols investigated showed 27 signals during the research period and were categorized into singular, collinear, and independent signals. Among these:
- 14 signals were directly related to NLT SwingPower.
- 12 to NLT Top-Line.
- 16 collinear and 11 independent signals.
- Notably, the analysis revealed a remarkable success rate, with 25 wins and only two losses recorded across all signals.
Confirmed Signals

Yellow highlights related signals, and white, independent signals.
The two systems, NLT Top-Line and Swing trading, have an independent and different basis for appraising and forecasting price moves, and the results show how well they supplement each other and allow for a higher participation rate in directional price moves.
Disclaimer: The information provided in this article is for educational purposes only and does not constitute financial advice. Trading in financial markets involves risk, and individuals should conduct their own research and consult with a qualified financial advisor before making any investment decisions.
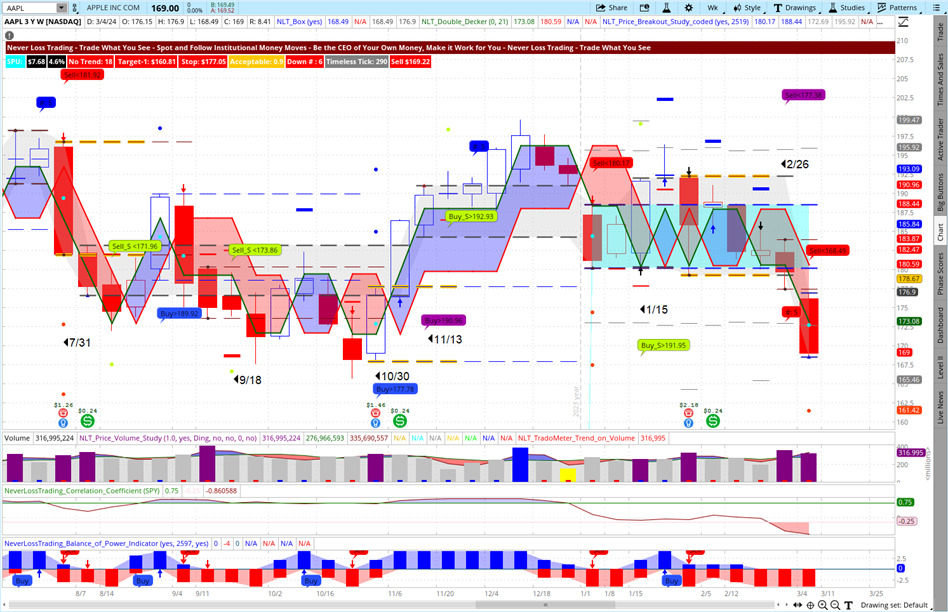
Next, we share the charts, where we printed the date of the trade initiation on confirmed signals. The three stocks picked are all derived from different industry sectors; however, our systems apply to all types of assets: Stocks, futures, and FOREX and all time frames.
QQQ

SPY

AAPL
UNH

UPS

In conclusion, our comprehensive analysis integrating the NLT SwingPower signal with the NLT Top-Line on weekly charts has yielded compelling results.
We are offering the two systems together in a bundle deal and are happy to demonstrate live how they perform:
contact@NeverLossTrading.com Subj.: Demo
All our teaching and coaching is one-on-one; hence, spots are limited, and you do not want to miss out.
We are looking forward to hearing back from you,
Thomas
Disclaimer, Terms and Conditions, Privacy | Customer Support

No comments:
Post a Comment