Spot and Trade Institutional Money Moves

Algorithmic Trading with Human Interaction for:

Day Traders, Swing Traders, Long-Term Investors

Showing posts with label Return Expectation. Show all posts

Friday, July 17, 2015

How to Stay Engaged in Your Trading – Pre-Market Movers

In our series of how to stay engaged in your trading, today, we want to refer to assets with a price move prior to the US-market opening.
Many of the US listed stocks are traded on international exchanges. Based on that, institutions already set new price points prior to the US market opening.
Never be late for a trade
In the morning, between 8:30 a.m. and 9 a.m. east, some of you receive a report called NeverLossTrading Pre-Market Movers. Listed are assets with market pressure and we prefer trading those either on a 10-Minute chart or on a 4-hour chart.
The referring trading concepts are taught in our mentorships.
Your big advantage of receiving this report: You trade assets on the move.
NLT Pre-Market Movers for July 16, 2015 (yesterday)
Pre-Market Movers July 16, 2015
What you see are stocks, futures and Forex pairs, where our scanners and indicators found price pressure, which might lead to stronger directional price moves.
As said, we prefer to trade developing price moves on 10-minute and 4-hour charts. Here our yesterday’s results, following our entry and exit rules:
NLT Pre-Market Movers Alert Results on July 16, 2015
Pre-Market Movers July 16 Results, 2015
What is the return expectation?
Prior to getting there, let us run some numbers on trading days and opportunities:
  • We have about 250 trading days.
  • At 50 out of 250 days, nothing is happening: leaves us with 200 opportunities for trading.
  • On a 4-hour chart, in average, we are about two days in a trade.
  • With two days in a trade, this gives us 100 opportunities a year to participate in trades.
  • About 40% of the listed opportunities fulfill the set trade conditions.
  • When trading a 10-minute chart, all positions opened will be closed the same day.
  • To open and close about three positions per day, you need to find 600 trading opportunities a year.
  • When we trade on a daily chart, the average time in a trade is four days; hence, we assume to take 50 trades per year.
As a result, you need to develop 250 – 600 trading opportunities per year either on your own or you rely on a proven alert system like NLT Alerts.
Return Expectations, at winning two out of three trades:
Stock Return Calculation
On a return expectation, the 4-hour trade runs at par with daily trade, trading frequently at 10 minute charts, has a 2.4 times higher return expectation.
When you want to be part of learning to find and trade high probability trade setups, schedule your personal consulting hour:
Call +1 866 455 4520 or contact@NeverLossTrading.com
Subscribe to our Pre-Market Movers or one of our other NLT Alerts…click.
If your aim is to achieve higher returns, leveraged products like Stock Options, Futures, and FOREX will be the right choice for you and we are happy to give you personal insights.
If you are not yet part of our trading tips and free webinars, please sign up here and we keep you up-to-date….sign up here.
We are looking forward to hearing back from you,
Good trading,

Saturday, August 2, 2014

What return can you expect when putting your money in the financial markets: Stock Market, Currencies, Commodities, and Treasuries?

Our answer: It depends on the time frame you plan to stay in your investment.

Let us take an example of an average stock:

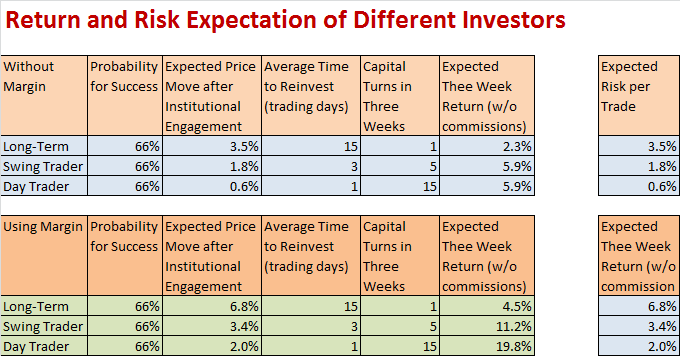
When institutional money starts flowing in or out, you can expect an average price move of about 1.8% of the share value in the next 1-5 days. If you are a long-term investor, expect about a 3.5% price move in the next 1-5 weeks. If you rather open and close your trade in the same day, expect about a 0.6% value change in 1-5 hours.

With a median time in the trade of three bars, this means:
  • Long-term Investments: 3.5% return in three weeks.
  • Swing Trading: 1.8% return in three days.
  • Day Trading: 0.6% return in 3 hours.
This picture changes when utilizing margin (factor four for day traders and factor two for swing traders and long-term investors) or leverage by trading the option of the underlying stock (about a factor 20, depending on the underling and implied volatility).

However, let us continue the stock trading example, assuming: Your trading system gives you two wins out of three trades; you constantly reinvested and you allow the price move a wiggle room of the expected return, then this will be the expected calculated returns:
Return and Risk Calculation for different Trader or Investors
The above table shows that the day trader, when using margin can expect the highest return and is risking the least amount of money per trade, while the long-term investor is taking a risk above the average expected return. Swing Traders in both examples have a positive expectation between risk and reward.

Why do so many people prefer long-term investing?

Our answer: This is what you been thought investing in; thus you prefer long-term holding of Mutual funds, 401(k), and broker held assets or ETF’s.

Make a change, learn to engage your money with the odds (reward over risk) in your favor: NeverLossTrading is a premier trading education institution teaching you how to benefit from utilizing algorithmic trading, where you trade with the odds in your favor, constantly engage your money and strive for above market average returns. We offer multiple mentorship classes that are tailor made to your trading style as a day trader, swing trader or long term investor. Two of our most liked programs;
If you want to find out which program suits you best, contact us for an individual consulting hour:
Call +1 866 455 4520 or contact@NeverLossTrading.com

In case you are not yet subscribed to our free trading tips and market reports, sign up here:
http://www.neverlosstrading.com/Reports/FreeReports.html 

We are looking forward to hearing back from you.

Good trading,

Thomas