Spot and Trade Institutional Money Moves

Algorithmic Trading with Human Interaction for:

Day Traders, Swing Traders, Long-Term Investors

Showing posts with label long-term trading. Show all posts

Saturday, February 17, 2024

The Art of Trading: A Pillar of a Fulfilling Life

 In pursuing a fulfilling life, one must prioritize three fundamental aspects: relationships, health, and financial stability:

  • Nurturing positive relationships while steering clear of toxic ones
  • Prioritizing physical and mental well-being
  • Strategically managing finances

Those are vital components to achieving overall happiness and contentment. While each dimension is crucial, in this discourse, we shift our focus to financials, recognizing its significance alongside the other pillars of a satisfying existence.

At the core of financial stability lies the imperative of generating income and investing wisely to produce sustainable returns. Regardless of one’s income level, a prudent strategy is to set aside a portion—ideally 20%—and channel it into the market for investment. This practice’s essence lies in securing one’s financial future and harnessing the power of compounding interest, arguably one of the most ingenious inventions in human history.

If you have investments in the market through any form of account, we are committed to providing you with essential knowledge pillars to fortify your financial future.

NeverLossTrading is not a vow of infallibility in trading; instead, it embodies the art of seizing high-probability price turning points, aiming for consistent income by skillfully averting drawdowns.

Knowledge is Power

At NeverLossTrading, we recognize the importance of empowering private investors with the knowledge and skills needed to thrive in today’s markets. We offer tailor-made systems and education programs to equip you with the tools to make informed trading decisions as:

  • A Day Trader (opening and closing positions the same day)
  • Swing Traders (holding positions for up to a couple of days)
  • Longer-term Investors (holding positions for weeks or months)

Institutional investments dominate the landscape, and we developed systems that help you spot, track and act with the big money instead of against it.

Trade what you see: let the chart tell when to buy or sell!

Our key offerings Include:

  • Personalized Coaching: Our seasoned mentors provide one-on-one coaching sessions tailored to your unique trading goals and skill level.
  • Proprietary Trading Systems: Gain access to proprietary trading systems and indicators designed to identify high-probability trading opportunities across various market conditions.
  • Ongoing Support: Beyond education, we offer ongoing support and guidance to help you navigate changing market conditions effectively.

Trading and investing are not mere hobbies but valuable skills that, when mastered, can yield significant returns. By adopting a systematic approach to trading and investing, you can quickly mitigate risk, leverage returns, and outperform professional fund managers.

Let us share examples for day trading, swing trading and longer-term investing, where you decide when to enter and exit positions with the help of a NeverLossTrading chart.

Day Trading

People prefer day trading for its potential quick profits from short-term market fluctuations – avoiding overnight risks, all positions will be closed at the end of the trading day.

One of our day trading concepts is to aim for a consecutive weekly income goal and stop trading when attained – participating in one or two trades per day.

You will learn high-probability chart setups by combining time-based happenings with NLT Timeless charts and act less frequently for higher average income. The concept works for all asset classes, and we choose futures trading to share the principle.

At 14:21 ET on February 14, we initiated a long trading position with the /ES (E-Mini S&P 500 futures contract). This decision was prompted by a buy signal indicating that the price had surpassed the Buy > $4,999.50 threshold, supported by floating indicating a breakout from a containment area with upward pressure. The trade reached its target at 14:21, as indicated by the dot on the chart, while the red crossbar denotes the system’s predetermined stop level. With one futures contract traded, we realized a profit of $250. While there were previous signals leading to targets, we focus on this specific instance for discussion purposes.

Operating our systems and interpreting charts effectively requires adhering to specific rules that are comprehensible through learning and practice.

E-Mini S&P 500 Futures Trade February 14, 2024
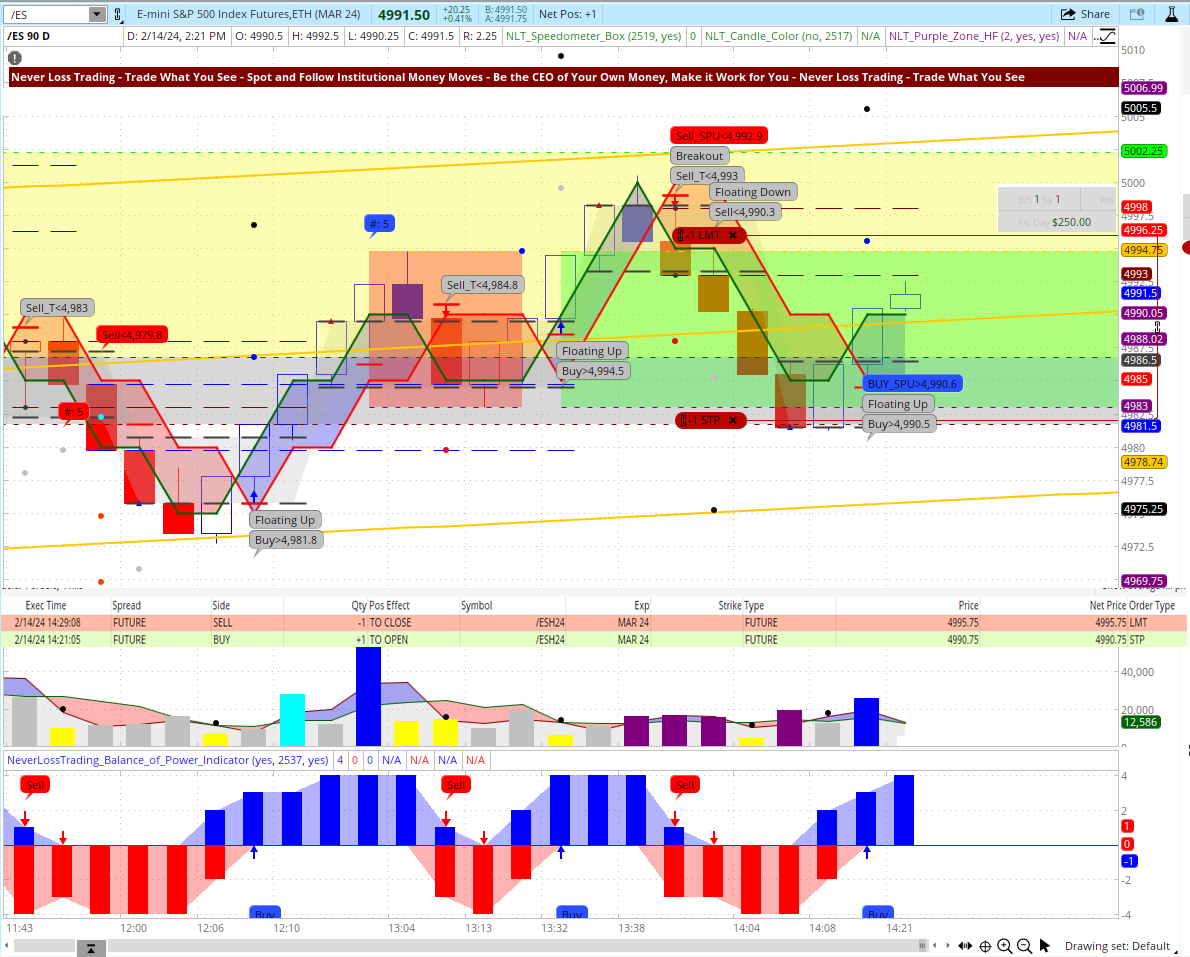
This trade reached the weekly budget of producing $1,000 of day trading income, and it was time to fold trading. We will teach you how we strive for constant income through our concept of less trading is more income: – = +, a different approach for successful day trading.

Swing Trading

Swing trading appeals to those seeking to capitalize on intermediate-term price movements, often holding a position for a few days rather than weeks.

Intel (INTC) is a very recent example. For February 12, our NLT Alerts indicated for intel a buy signal (orange signal on the chart from February 9, 2024). The threshold to enter the trade was $43.55, with a target of $49.99, trading for a 3.3% return on cash.

INTC, NLT Swing Trading Chart
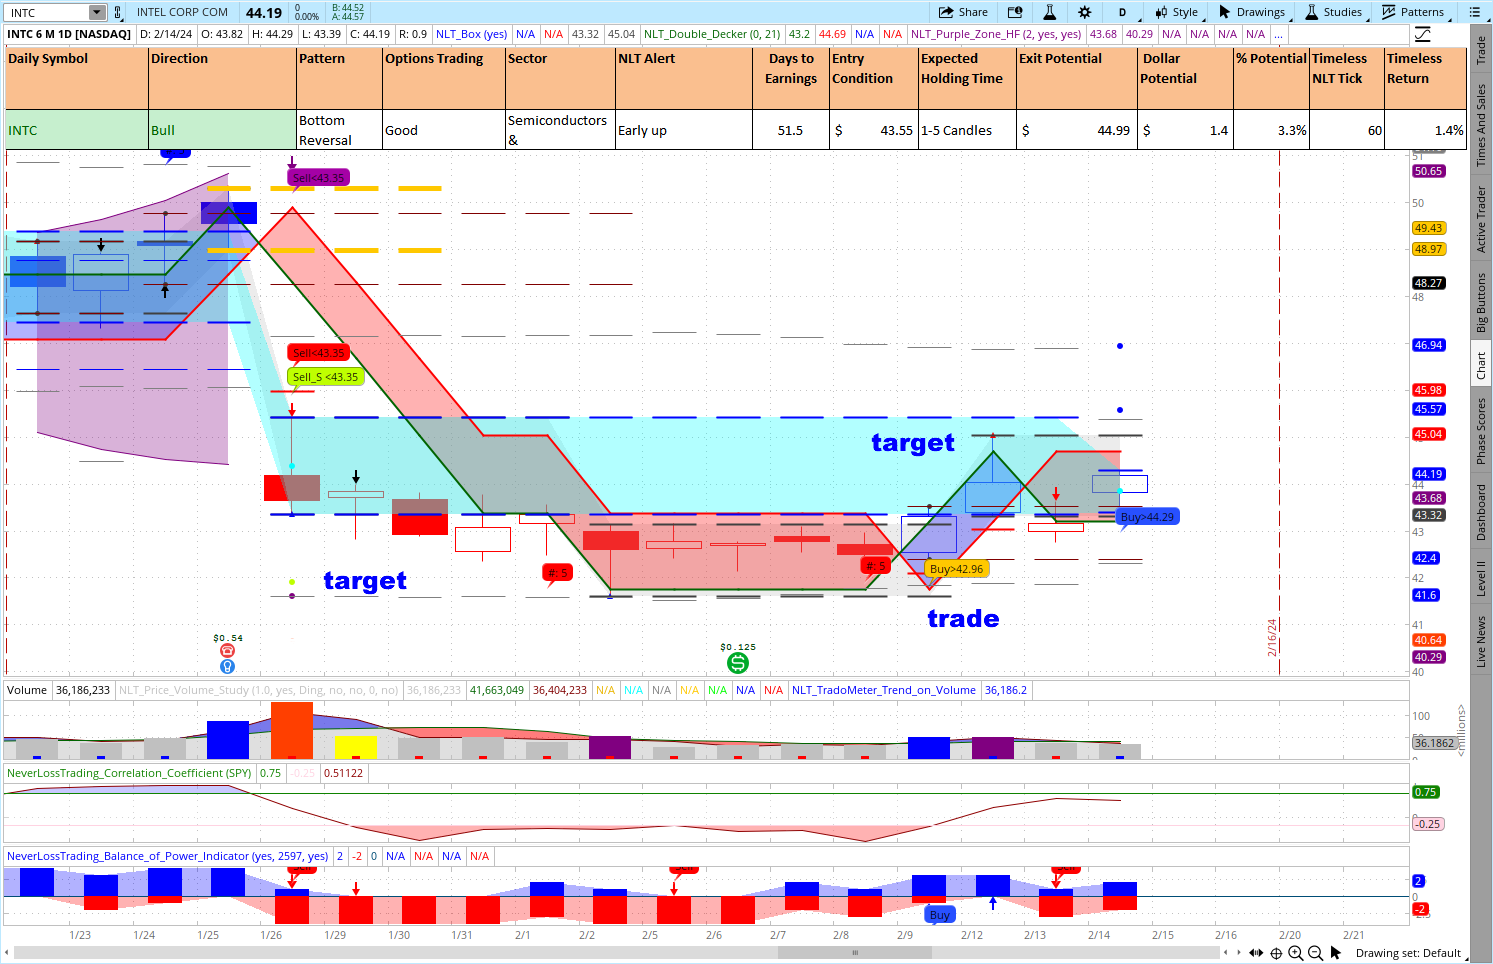
Hence, a buy-stop order with a bracket was set pre-market, filled and reached its target. In this case, all in one day. When looking to the left, on January 29, a short trading opportunity was confirmed and came to target on February 2, 2029.

We could undoubtedly add trade over trade, but I wanted to pick some recent examples to demonstrate how our system paints trading opportunities on the chart and how to implement them.

Longer-term investing is favored for its potential for sustained growth and the ability to ride out market volatility, aiming for wealth accumulation over time.

Long-Term Investing

We take longer-term trading decisions from weekly charts and pick Microsoft (MSFT) to demonstrate how to put signals in action.

MSFT Long-Term Investing

From left to right:

After an NLT purple zone occurs, we do not open trades as long as such a zone is present. NLT Top-Line Charts paint upward momentum in blue and downward momentum in red; when red and blue mix, purple indicates no directional price pressure.

Then you see multiple buy signals along the blue upward framed price move that all came to target (dot on the chart). The actual candle does not possess a signal. With the help of this chart, you decide once a week what you do, and you pre-program entries, exits, and stops.

Offer

We equip traders with practical tools and methodologies to identify high-probability trade setups, helping them make informed decisions based on market trends and price action.

Subscribe to receive our trading tips.

Executing trades at the right time can be challenging, especially in fast-moving markets. NeverLossTrading offers techniques for precise trade entries and exits, allowing traders to capture optimal returns. With its focus on high-probability setups and systematic approach, NeverLossTrading helps traders improve their trade execution and timing, maximizing their profit potential.

We have a special offer for you: ask for our 2024 startup.

The financial markets are dynamic and ever-evolving, requiring traders to stay updated and continuously learn. NeverLossTrading promotes a culture of continuous learning, providing educational resources, webinars, and personalized mentoring. Traders gain access to a wealth of knowledge and expertise, empowering them to adapt to changing market conditions and enhance their trading skills.

To succeed in trading, you best work with an experienced coach. Our #1 competitive advantage is the support and customer service we offer. Veteran traders have been through more ups and downs than you can imagine. So, experienced pros have probably experienced whatever you’re going through. Suppose you are ready to make a difference in your trading. We are happy to share our experiences and help you build your trading business. Trading is not a typical career, and you best learn from those who are long-term in this business to cope with the rollercoaster of the financial markets. We are here to help and provide feedback on what you might be doing right or wrong. Strive for improved trading results, and we will determine which of our systems suits you best. The markets changed, and if you do not change your trading strategies with them, it can be a very costly undertaking. Hence, take trading seriously, build the skills, and acquire the tools needed. Trading success has a structure you can learn and follow.

contact@NeverLossTrading.com Subj. Demo, and we will find out which system package suits you best.

Good trading,

Thomas Barmann (inventor and founder of NeverLossTrading)

www.NeverLossTrading.com

Disclaimer, Terms and ConditionsPrivacy | Customer Support

Monday, April 20, 2020

Longer-Term Trading in Volatile Times

Can one trade longer-term price developments in times of COVID-19?

To answer this question, let us define longer-term trading first.
By our definition, longer-term trades take their signals from weekly and monthly charts, assuming to hold positions for multiple weeks or months.

The key to longer-term trading as it is to shorter-term trading:

Finding assets in demand or supply, and trading along with their price development with a risk-limiting strategy.

We generated a video where we are explaining the details in a ten-minute presentation: watch it here…click.

Risk-limiting is the keyword!

When you are just long or short stock, you are not trading risk limited: stocks can lose 50% of their value in a very short period of time. Check out BA, for example: The share dropped 50% of its value in a matter of two months.

In trading, we predict price developments, but cannot control them:

We work under a probability assumption, but we can control the risk we take per trade.
However, risk control is easier said than done. We offer multiple strategies in our mentorships, teaching you to execute risk-limiting trades that are applicable for all account types: Cash, IRA, Margin Accounts.

How to find and follow a potential price move?

It is the duty of your system: It shall help you to find underlying changes in supply and demand, paint those on your charts, and to give you market scanners that let you find those opportunities without the need for going through hundreds of charts.

Let us start out with a monthly chart example where the NeverLossTrading Top-Line system speller out multiple directional trading opportunities by upper- and lower study indicators.

AAPL Monthly NLT Top-Line Chart: October 2017 to April 2020
You see five highlighted situations that we analyze in detail for you.
SituationActions
Situation-1Long trade by the price threshold: Buy > $190.37, being surpassed in the next candle. Trade for a maximum of five bars or to the price target. The trade started in an NLT Light Tower and ended there (candle with the cyan dot).
Situation-2No trade, not supported by the lower study.
Situation-3Long trade for a maximum of five bars or exit at the NLT Box Line.
Situation-4Long trade for a maximum of five bars.
Situation-5Short trade to targe.
Watch the video for further details and examples...click.

Trade as mechanical as possible with clear cut rules. Learn how to apply this:
To learn and participate in such opportunities:

Call: +1 866 455 4520 or contact@NeverLossTrading.com

Subscribe to our free trading tips, reports, and webinars.
Good trading!

Disclaimer, Terms and Conditions, Privacy | Customer Support

Saturday, February 29, 2020

Quantitative Analysis for Trading and Investing


With the help of quantitative analysis, mathematical models can be built for evaluating underlying changes in supply and demand, extrapolating high probability price move signals for you.
We want to provide you an intro into the world of quantitative analysis by a free eBook, where we measure the influence of success factors on the return on capital (ROC) achievable.
This image has an empty alt attribute; its file name is intro-mutidimensional-arrows.png
We share in this article how to consider multidimensional decision-making models for finding and executing financial decisions with stocks, options, futures, FOREX, and share in some examples how trading and investing decisions can be provided for you.
For getting those key determining success factors into your knowledge and skillset, schedule your personal consulting hour:
Call +1 866 455 4520 or contact@NeverLossTrading.com
We offer multiple systems and will find out what suits you best. By working one-on-one, spots are extremely limited.
Subscribe to our free trading tips, reports, and webinars.
We are looking forward to hearing back from you.
NeverLossTrading
A division of Nobel Living, LLC
401 E. Las Olas Blvd., Suite 1400
Fort Lauderdale, FL 33301

Friday, April 1, 2016

Futures Trading is Now!

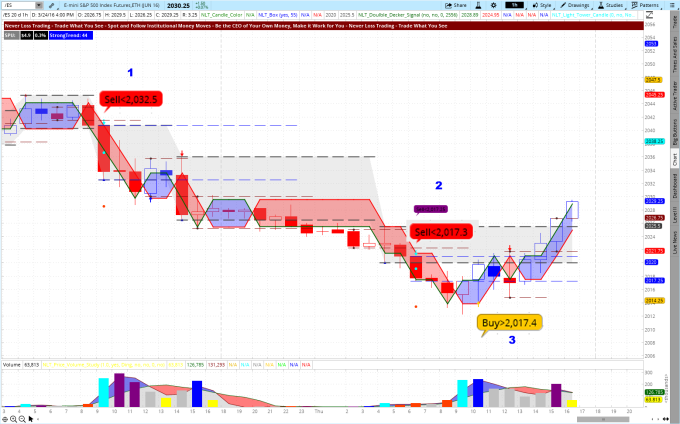
Futures trading is often labeled as high risk; however, if you do not use protective stop orders to manage your risk, trading in general becomes high risk. In our leading trading system: NeverLossTrading Top-Line, red lines on the chart help you to determine and trail stop levels, while we often keep our stop at bay until the first part of a trade comes to target.
E-Mini S&P 500 1-Hour Chart for March 23/24, 2016
March 23 and 24 Emini S&P 500
The above chart shows you three trading opportunities, where on the red signals, dots on the chart determine the first exit; for yellow signals, we trade to the next line border and in any case, we only trade, when the candle following the signal candle surpasses the set price threshold. Example (Situation-2) Sell<2 4-point="" a="" an="" and="" are="" at="" candle="" desired="" development="" entry="" exit="" filled.="" for="" gain="" in="" is="" level="" means="" next="" of="" or="" order="" p="" place="" price="" reached="" sell-stop="" the="" this="" trade="" was="" win.="" with="" you="" your="">
When you are working with protective stop orders, futures all of a sudden can become lower risk than stocks, here are some reasons why:
  • Our preferred futures markets are open close to 24 hours a day, which means the overnight gap risk is relatively low. Those markets only close for a short settlement period each day, but then open up again and trading resumes.
  • The major futures markets we focus on at NeverLossTrading are some of the most liquid markets in the world, which means they are as close to a fair trade as there is and you don’t have to worry about slippage that much, though it can happen; however, if you like to focus on a specific future fitting your specific requirements and purpose, we are surly supporting you with our systems and sound knowledge.
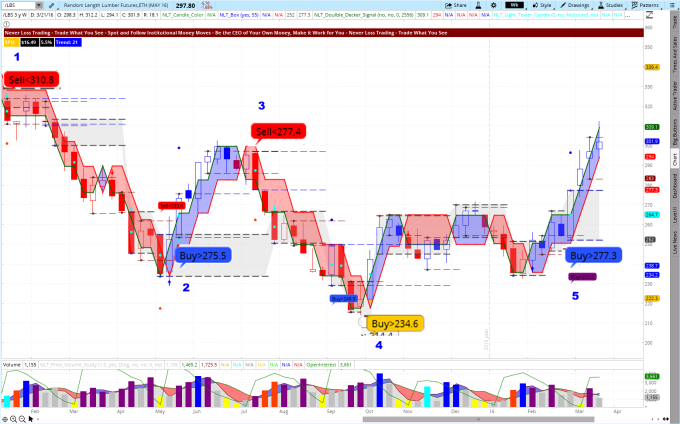
Let us share an example, where we helped a trader who wanted to hedge his lumber production, allowing him to sell at constant prices. We used a weekly chart and below you see those trade situations magnified where the trade direction was confirmed by the next candle surpassing the set price threshold:
Random Length Lumber Futures on the Weekly NLT Top-Line Chart, 2015, YTD 2016
Random Lenght Lumber NLT Top-Line
When trading a futures contract, you need to be aware of the value of the instrument you are trading and thus, determine a meaningful price changes to trade for:
The E-Mini S&P Futures Contract currently trades around $2,000. With a related value of $50 per point, you are controlling with one futures contract $100,000 of value. Many and in particular beginning futures traders want to predict the price move with a $50 accuracy and love trading for a 1-point gain or loss. This requires a 99.95% accuracy or a prediction above 4-sigma (a range of four standard deviations). We can only congratulate you if you can do this accurately, but recommend most of our new students to not focus on such short-term trading tasks, by having a very, very little chance for making money and rather focus on trading for bigger targets.
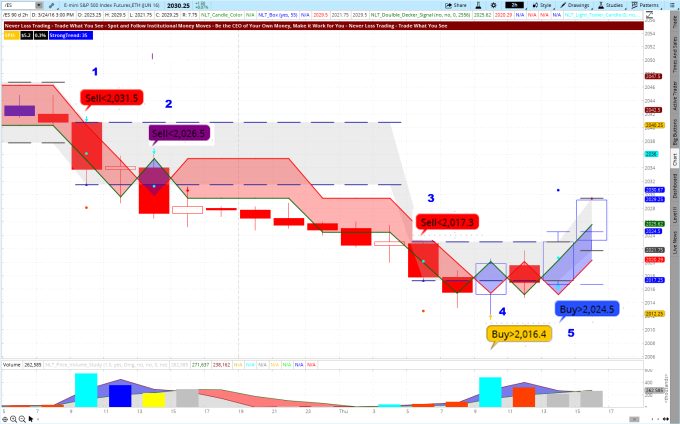
E-Mini S&P 500 2-Hour Chart for March 23/24, 2016
March 23 and 24 Emini S&P 500 2-Hour Chart
The above chart shows you five trade situations that were confirmed and all of the came to target with an average gain of $225 per contract. This is high probability trading and if you like to be part of this:
Call: +1 866 455 4520 or contact@NeverLosstrading.com
Can you make money trading futures short-term?
Yes, but do not solely rely on one time frame: have a business plan that allows you for participating in bigger price moves, giving you more appropriate returns, than trying to work yourself up point by point, with the risk of constantly being ripped apart by trading in the natural volatility price move of the instrument you are trading.
Instead of scaling down in the time frame to trade, let us show you how to even utilize longer-term charts in your trading.
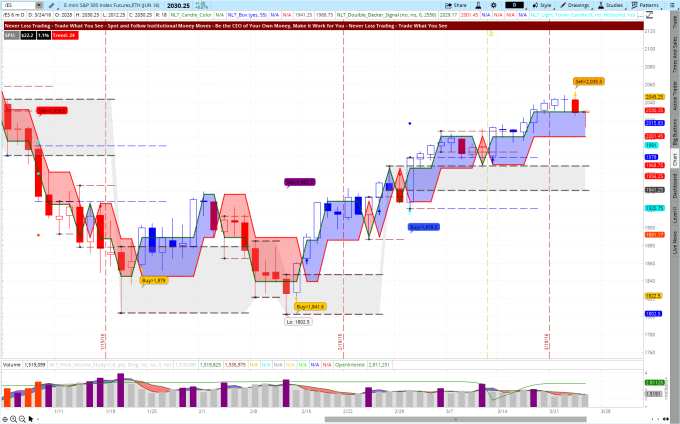
E-Mini S&P 500 Daily Chart for January 1- March 24, 2016
March 24, back to January 4, 2016 Emini S&P 500
In case you are not ready to take the associated futures trading risk required to trade from daily charts, we teach you in our mentorships, how you can participate in bigger price moves of the underlying by only accepting risk in 100-dollar increments.
We offer a wide variety of NLT mentorships: Take a look…click and let us know for which system you like to schedule a personal and live demonstration for:
Call: +1 866 455 4520 or contact@NeverLosstrading.com
In our mentorships, we focus on one-on-one training and coaching: always prepared, highly effective, and all recorded; so you can repeat what you learned.
Surely, you can combine learning futures trading with stock trading, options trading, FOREX trading.
Prepare yourself for a better trading future.
If you are not yet part of our free trading tips, reports, and webinars...sign up here. 
We are looking forward to hearing back from you,
Thomas