Spot and Trade Institutional Money Moves

Algorithmic Trading with Human Interaction for:

Day Traders, Swing Traders, Long-Term Investors

Showing posts with label trading chart. Show all posts

Saturday, August 22, 2026

Budget Trading: Week Two

Price Turning Points and Patterns

If you’re joining us for the first time: Budget Trading is the simple idea that a day trader’s edge comes as much from knowing when to stop as from knowing when to enter. Set a realistic dollar target before the session starts, trade a small number of well-defined setups to reach it, and close the book the moment it’s hit, rather than pushing for one more trade. We train NLT traders toward a first goal of $1,000 a week on a single contract of E-Mini S&P 500 Futures, Crude Oil Futures, or Gold Futures, focusing on two trades a day instead of ten, because less trading is more.

Our systems and strategies also work for swing trading and long-term investing, and we will explain this in future articles. In the meantime, you can find multiple examples on our blogs.

Last week’s piece walked through what that discipline looks like in practice. This week’s field report picks up exactly where that one left off, with a new set of trades, and adds a wrinkle worth its own spotlight: the same chart pattern showing up twice in the same session, on two different instruments.

Four Trades, One Week

The week of August 17–21, 2026 produced four qualifying trades towards the weekly budget. Knowing when not to trade is just as important as knowing when to trade, so we let the system dictate the buy and sell decisions. With no qualifiers on Monday or Tuesday, we stayed patient and stepped in on Wednesday, Thursday, and Friday, using NLT Timeless Charts, where candles are built from system-defined price ranges. That approach keeps risk and reward in a more balanced relationship at every point, allowing us to trade mechanically with bracket orders at key price turning points rather than holding positions in hopes of more. We print the accepted signal, the entry and exit timestamps, and the result on the chart examples for you to check and compare.

E-Mini S&P 500 Futures Trade on August 19, 2026

Our first trade is a classic top-reversal setup, supported by several signals that guided our decision-making:

  • A price expansion of more than 3 SPUs, combined with a top-reversal signal setup.
  • A strong signal combination confirmed by volume.
  • Entry into the NLT red zone, where price-move congruency is typically high.
  • We entered short at 9:01 a.m. ET, and the trade auto-closed at 9:36 a.m. ET for a profit of $375.

We understand that not all of the reasoning is immediately visible on the chart. That is why we train NLT users one-on-one, so they can learn how to let the chart tell when to buy and when to sell.

E-Mini S&P 500 Futures Trade on August 20, 2026

Our second trade is what we call a bullish cup breakout, supported by two independent signals:

  • A second roll to the upside from a bottom.
  • A strong signal combination confirmed by volume.
  • NLT red zone trade, where price-move congruency is typically high.
  • We entered short at 9:31 a.m. ET, and the trade auto-closed at 9:35 a.m. ET for a profit of $325.
  • The bracket order on the chart shows the target and stop for the trade.

Not at budget yet; we needed at least another trade to reach the set goal. However, we never trade for the trade; we only do so at favorable, high-probability chart setups.

Friday: The Same Constellation, Twice

Fridays don’t always produce a trade under this approach; some weeks the budget is already made and the book is closed early. This particular Friday was different; it produced two more qualifying trades, one on Crude Oil Futures and one on the E-Mini S&P 500, and both were built on the same relationship of candlestick movements. Not a coincidence of two traders liking the same shape, but the same signal-and-confirmation constellation appearing independently on two different charts within hours of each other.

It isn’t the instrument that produces the setup. It’s the relationship between candles, and that relationship doesn’t care which market it shows up in.

This is, in a small way, the clearest possible demonstration of why NLT’s approach is built around reading relationships between candles rather than memorizing a shape on one chart. A pattern that only exists on one instrument, in one context, isn’t an edge; it’s a coincidence waiting to fail. A pattern that repeats across unrelated markets on the same day, confirmed each time independently, is the kind of signal worth building a trade and a budget around.

E-Mini S&P 500 Futures and Crude Oil Futures Trade on August 21, 2026

On Friday, we triggered a short crude oil trade in the NLT Red Zone at 9:07 a.m., and it reached its target at 9:50 a.m. While that trade was still active, we also opened a short E-Mini S&P Futures trade at 9:33 a.m., which closed two minutes later at 9:35 a.m. The E-Mini trade contributed $287.50, while the crude oil trade added $490. The Budget was made, and we stopped to trade: In both cases, the timestamp reflects a double entry: the E-Mini order was initially entered without a bracket, then deleted and re-entered, while in crude oil we had strong conviction and doubled up on the order. Both trades shared the same core setup:

  • NLT Red Zone with a strong volume-supported signal.
  • A short entry toward what we call the Euro-Channel border, a key price attraction point.

Tallying the Week

Four trades, four instances of the same process: a confirmed signal, a sized risk, an exit at target or at the day’s backstop, and a stop the moment the number for the day was reached. That’s the entire mechanism behind the weekly budget, repeated with enough consistency that a repeating pattern across markets becomes something to notice and trust, rather than something to chase after the fact.

For a trader working toward that first $1,000-a-week milestone, a week like this one is exactly the kind of evidence worth paying attention to: not a single lucky trade, but the same disciplined process, applied four separate times, holding up across two different futures markets on the same day.

New to Budget Trading?

This piece stands on its own, but if you’d like the fuller picture, last week’s article walks through the budget framework in greater depth: the overtrading trap, the $1,000-a-week target, the path from micro contracts to prop-firm capital, and the two-trades-a-day rule that makes it all sustainable. Either way, the invitation is the same: learn the setups, trade the session, and close the book once the day’s number is made.

Ready to Day Trade like a Pro?

Learn one-on-one which NLT Setups to take or spare.

📩 Contact us: contact@NeverLossTrading.com

Subject: Day Trading Consultation

Sign up for our free trading tips.

Good trading,

Thomas F. Barmann

www.NeverLossTrading.com

Disclaimer, Terms and Conditions, Privacy

Saturday, November 22, 2025

Take-Trade-So!

System-Defined Entries and Exits

Just like tic-tac-toe, trading success is about making the right move at the right time.

Remember the simplicity of tic-tac-toe? Two players, nine squares, and clear rules that determine winners and losers. Trading doesn’t have to be more complicated than that.

With NeverLossTrading’s innovative Indicators, we’ve transformed the complexity of market analysis into a straightforward, three-step decision framework that any trader can master.

Today, we feature the New NLT Switch Indicators, which integrate flawlessly with NLT Top-Line.

Translating the Game

Take-Trade-So!

TAKE: The first square in your winning pattern. Our Indicators scan multiple timeframes and confirm when all conditions align for a high-probability entry. Green lights across entry signals, risk parameters, and volume confirmation mean it’s time to TAKE the setup. No guesswork, no emotional hesitation—just clear, data-driven signals.

TRADE: You’ve made your move, now manage it. The middle phase is where NLT Indicators truly shine, monitoring momentum, trend strength, and position health in real-time. Like controlling the center square in tic-tac-toe, maintaining awareness of your active TRADE through our dynamic indicators keeps you in control of the game.

SO! Victory or strategic retreat—either way, you exit with precision. When the NLT Indicators signal a reversal, target achievement, or stop-loss trigger, you act. SO stands for “Switch Out or Over,” your clear command to adjust or close the position—acting, no holding and hoping, no watching profits evaporate. You exit or apply trade repair when the system tells you the game has changed: Never Stop Loss Trading gave us the brand name, which teaches how to hedge or adjust positions or portfolios rather than accepting the stop loss. We shortened the name a little.

Traditional trading analysis can feel like playing tic-tac-toe blindfolded against multiple opponents. Charts overflow with contradictory indicators, news creates noise, and emotions cloud judgment. The Take-Trade-So! framework eliminates this chaos. Each square on your decision grid has a purpose, each indicator has a specific job, and every trade follows the same proven pattern.

See this chart example, which includes the new NLT Switch Indicators that are launching (light green):

IBIT (Bitcoin ETF) on the NLT Timeless Multi-System Chart

The beauty of this system lies in its reliability. Just as tic-tac-toe has mathematically optimal moves, the NLT Indicators identify market conditions with the highest probability of success. You’re not gambling on gut feelings or chasing hot tips. You’re following a systematic approach that removes emotion from the equation and replaces it with algorithmic precision.

Whether you’re trading stocks, forex, futures, or options, the Take-Trade-So! Methodology adapts to your market. The NLT Indicators recalibrate for different instruments and timeframes, but the fundamental framework remains constant. Learn it once, apply it everywhere, and watch your consistency improve.

In tic-tac-toe, the player who thinks ahead wins. In trading with NeverLossTrading’s NLT Indicators, the trader who follows the system wins. Take-Trade-So! It’s not just a catchy phrase—it’s your roadmap to confident, profitable trading decisions. The game is simple when you know the rules.

The question is: are you ready to make your first move?

📊 Watch our NLT Switch Intro video.

📩 Contact us:

contact@NeverLossTrading.com Subj.: Demo

To receive a PDF version of the newly introduced NLT Switch, email us at

contact@NeverLossTrading.com Subj.: PDF Switch

To stay connected, sign up for our free trading tips.

Good trading!

Thomas F. Barmann

www.NeverLossTrading.com

Disclaimer, Terms and ConditionsPrivacy | Customer Support

Saturday, June 15, 2024

Advance Your Game by Risk-Based Trading Decision

At NeverLossTrading, effective risk management is the cornerstone of successful trading. One of the most crucial aspects of risk management is adjusting your investment size according to the probability of different trading setups. This approach ensures that you are trading unquestioningly and making calculated decisions based on the statistical likelihood of success.

Risk in itself might be understood as a single entity; however, it results from multiple integral components that define risk-based trading decisions. These components include:

Elements of Risk-Based Trading Decisions

Risk Tolerance: This is the level of risk an individual trader is willing to take. Understanding your risk tolerance is crucial in making informed trading decisions. A swing trader should allocate between 1% and 5% of their capital to each trade, investing about 80% and keeping 20% for potential hedges.

Risk Integration: Incorporating risk into every aspect of your trading strategy involves considering risk in every trade you make and ensuring it aligns with your overall trading plan. A trading plan should have two components: An action plan explaining when to trade, a financial plan spelling out how often to trade, and formulation of return expectations. At NLT, we formulate a business plan for trading success with our clients.

Risk Assessment: Continuously evaluating the potential risks associated with each trade. This assessment helps in understanding the potential downsides and planning accordingly.

Risk Mitigation: Developing strategies to minimize risk. At NeverLossTrading, we teach how to repair the trade and turn potential losers into winners when prices reach the stop-loss level, and this was the basis of our brand name; however, never stop loss trading was a bit lengthy.

Risk Integration: Ensuring that risk considerations are an integral part of your trading system and not an afterthought means embedding risk management practices into your trading routine.

Trade Indication: Here, we combine the elements of signal strength with risk-reward appraisal as an integral part of the trading decision.

Trend Appraisal: This sounds simpler than it is. No, we do not draw lines between points and decide; we check for specific repetitive price patterns to define if we trade with or against the short-term trend.

Understanding Risk-Based Lot Sizing

Risk-based lot sizing involves appraising trading situations according to their probability of success and then adjusting the size of your investment accordingly. This method allows you to maximize gains when probabilities are high and minimize losses when the market conditions are less favorable.

Here’s a detailed look at how we implement this strategy at NeverLossTrading:

Probability Appraisal and Investment Adjustment

Our strategy involves evaluating setups based on their probability of success and adjusting the lot size (investment amount) accordingly. Below is a matrix showing how we approach different setups with varying probabilities:

How to Use the Matrix

Identify the Setup Category: Determine which setup category your trade falls into based on the potential price move indication, e.g., Power Tower, Swing Power, Trend, etc.

Determine Market Condition: Assess whether you are trading with or against the short-term Trend. At NLT, we define short-term trends by specific price patterns, called bullish or bearish cups.

Select the Setup: We like to trade when price indications correlate with breakout patterns like NLT Box Breaks, Cyan Zone Breaks, and Earnings Range Breaks. To read more about this, check our latest article on this blog.

Adjust Lot Size: Adjust your lot size based on the probabilities given. For example, if trading a Power Tower set up with a short-term trend at a Cyan Zone Break, you would allocate your trade size to the maximum risk tolerance.

Practical Application

For instance, let’s say you identify a Power Tower setup with a short-term trend at a Cyan Zone Break; you would allocate a maximum lot size. Conversely, if you identify a Swing Power setup against the short-term Trend in an Earnings Range, you would adjust your lot size to 79% of your max risk tolerance, reflecting a lower probability than the former setup.

Advantages of NeverLossTrading’s Approach

Precision in Trading: Using statistical probabilities, we reduce guesswork in trading.

Optimized Risk Management: Adjusting lot sizes based on probabilities helps manage risk more effectively.

Systematic Approach: Our strategies systematically evaluate and execute trades, ensuring consistency and discipline.

Enhanced Decision-Making: Our tools and indicators help traders identify critical price turning points, aiding in better decision-making.

Examples

Trade what you see by letting the chart tell when to buy or sell.

The following examples will show trade indications with buy or sell thresholds, and we only act when those are surpassed in the price movement of the next candle, ensuring that critical market participants trade in the same direction. Dots on the chart identify trade exit levels and red crossbars’ potential stops. Crosslines express borders of price containment areas, and we find a higher likelihood in the trade situation when the price moves out of such containment.

SBUX, Risk-Allocated Trading Decisions

On the earnings report, Starbucks missed expectations; the stock dropped, and our indicator painted an NLT Cyan Zone as critical support and resistance levels to engage trades border to border and at channel breaks when NLT Signals are confirmed.

Our indicators pained eight trading opportunities between 5/1 and 6/10/24:

Situation-1: the direction was not confirmed, and there was no trade.

Situation-2: no trade against the channel border, expecting buy orders at this level.

Situation-3: NLT Early-Up signal indicating a robust directional change, and the trade came to its target at the opposite border of the NLT Cyan Channel: 94% risk allocation, by this signal’s favorable risk/reward setup.

Situation 4: The target is outside the channel borders, not trade.

Situaion-5: Strong signal at channel break at a short-term up move: 100% risk allocation.

Situation-6: The signal was not confirmed, and we will not enter into a trade at the exit level of a prior signal.

Situation-7: No trade against the channel border.

Situation-8: A trade with the trend and a 73% risk allocation by not directly breaking the NLT Cyan Zone border.

IBM, Risk-Allocated Trading Decisions

The IBM chart shows four potential trade indications:

Situation-1: Two NLT signals show a potential for a strong reversal and for the price to pull back to the NLT Cyan Zone. The trade was confirmed, and by being a trade against the prior trend at an NLT PowerTower, we allocated 67% of the maximum risk.

Situation-2: Early-up signal, but by the NLT Cyan Zone Channel border being in the way of the trade, we passed.

Situation-3: NLT SwingPower Signal confirmed at a channel break with the newly developing short-term up trend, indicated by the Early up signal and price move prior; we allocated 85% of the maximum risk to this opportunity.

Situation-4: We are already in the trade, but if not, this signal allows for a late entry with the trend and a 73% risk allocation.

If you want to learn to make rule-based trading decisions at high-probability price move points, contact us for a demo, and we find out which system combinations suit you best.

contact@NeverLossTrading.com Subj.: Demo

As an NLT Top-Line user, you can scan the markets on your own for trading opportunities at crucial price turning points. However, we also support you with NLT Alerts, which list assets ready for critical price moves. We even integrate the chart situations for you and offer you a week of free alerts, with no strings attached.

contact@NeverLossTrading.com Subj.: Free NLT Alerts

Only informed trading decisions will lead you to produce the returns you expect to make from the markets, and we are here to support you one-on-one in forming critical trading decisions.

Conclusion

Trading is inherently risky, but using a structured approach to evaluate and adjust based on probabilities can significantly enhance your chances of success. At NeverLossTrading, we equip our traders with the knowledge and tools to make informed decisions, ensuring that every trade is backed by solid analysis and strategic planning.

Join us to learn how to trade smarter, not harder, by making the Trend your friend and managing your investments precisely.

contact@NeverLossTrading.com Subj.: Demo

To receive our trading tips, subscribe here.

Working one-on-one spots are limited, so do not miss out.

We are looking forward to hearing back from you,

Thomas

www.NeverLossTrading.com

Disclaimer, Terms and ConditionsPrivacy | Customer Support

Saturday, April 27, 2024

The Art of Market Timing in Trading

In the world of trading, timing is everything. Every move in the market presents an opportunity, but those opportunities can easily slip away without the right timing. As the saying goes, “If you never open a position, you never have an open position to trade.” This underscores the importance of identifying and executing potential trades at the right moment.

Here’s where NeverLossTrading comes in. With its cutting-edge technology and sophisticated analysis tools, NeverLossTrading equips traders with the ability to master market timing like never before. By leveraging its proprietary indicators and strategies, traders can precisely identify optimal entry and exit points, maximizing their profit potential while minimizing risk.

One of the critical advantages of NeverLossTrading is its focus on comprehensive market analysis. Rather than relying on gut instinct or guesswork, NeverLossTrading employs a data-driven approach to identify high-probability trading opportunities. Its advanced algorithms analyze market trends, price movements, and key indicators in real-time, allowing traders to stay one step ahead of the competition.

But timing isn’t just about knowing when to enter a trade; it’s also about knowing when to stay out. With NeverLossTrading’s sophisticated risk management tools, traders can avoid unnecessary losses by sitting on the sidelines during uncertain market conditions. By waiting for the right opportunities to present themselves, traders can ensure that every trade they make has the highest possible chance of success.

In addition to its advanced timing capabilities, NeverLossTrading offers a range of educational resources and personalized coaching to help traders hone their skills and maximize their profits. From live trading sessions to in-depth tutorials, NeverLossTrading provides traders with the knowledge and support they need to succeed in today’s competitive markets.

So, suppose you’re tired of missing out on profitable trading opportunities or getting caught on the wrong side of the market. In that case, it’s time to take control of your trading destiny with NeverLossTrading. With its unparalleled timing capabilities and comprehensive support, NeverLossTrading empowers traders to trade confidently to achieve their financial goals like never before.

Our software is paining trading opportunities on the chart for you:

Trade what you see; let the chart tell when to buy or sell.

To demonstrate how this imperative works in different situations, we share some examples:

  • Longer-term trading: weekly chart based.
  • Swing trading: daily chart-based.
  • Day trading: NLT Timeless Concept.

NLT trading decisions are indicator-based, where the system defines a price threshold: buy > or sell<, and we enter into a trade when this threshold is confirmed in the price movement of the next candle. In addition, at entry, the system defines the exit (dot on the chart).

Longer-Term Trading Examples

When accepting NLT Signals from weekly charts, the expected time to hold an open position is one to ten weeks, with a statistical peak of three weeks.

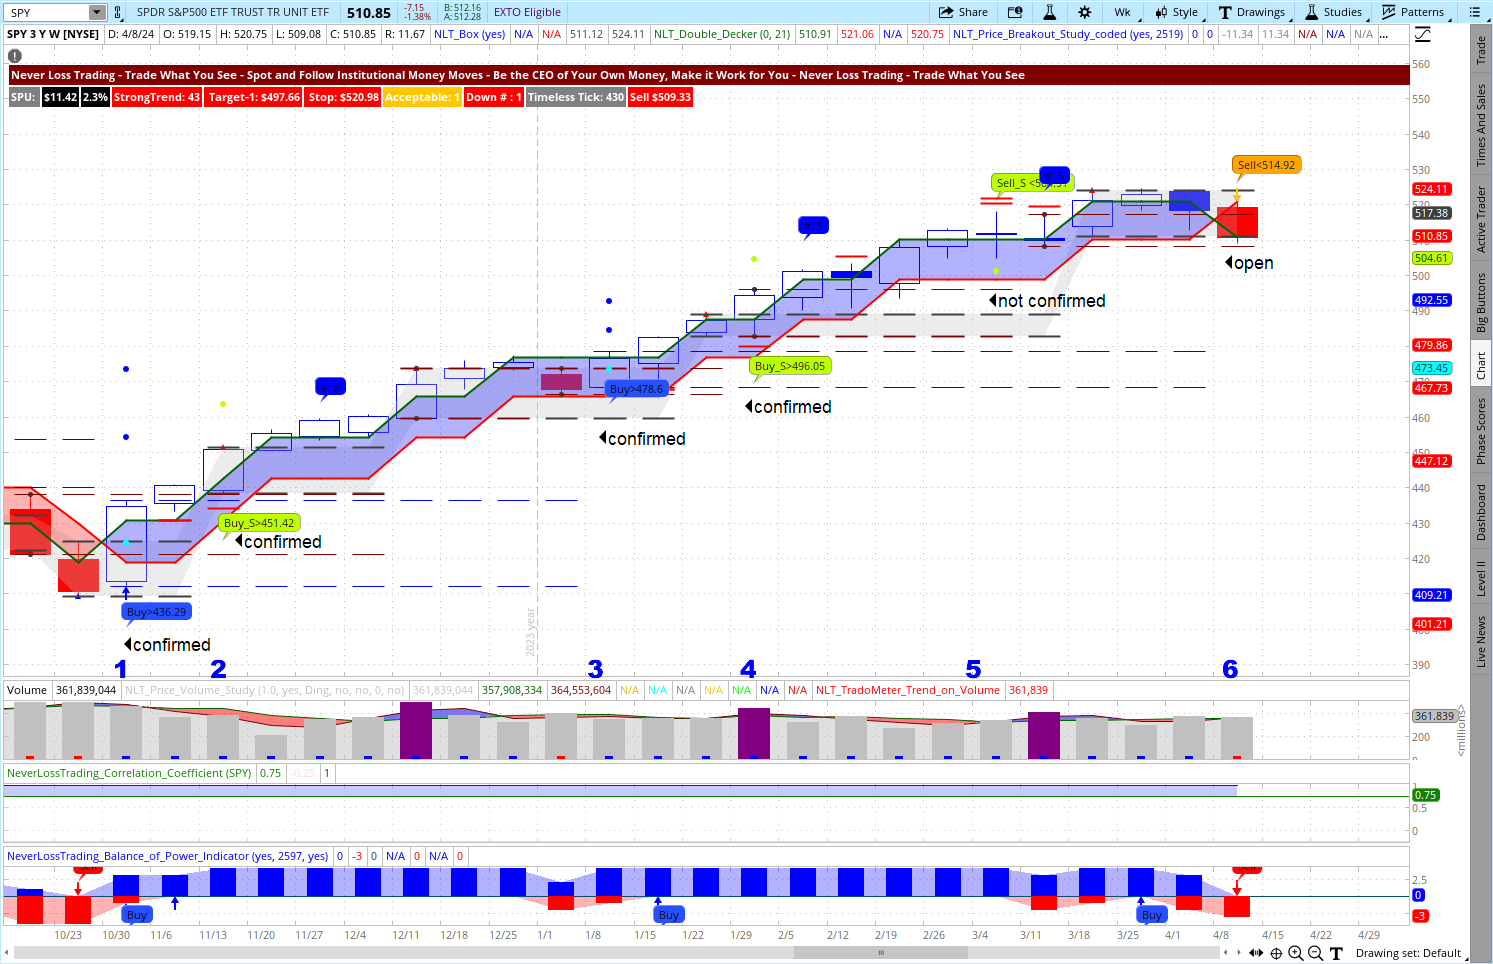
To demonstrate the strength of our systems, we pick SPY, ETF of the S&P 500 stock market index, and check the most recent market timing of the NLT indications between mid-October 2023 and mid-April 2024.

SPY, NLT Weekly Chart

The SPY chart shows four confirmed trade situations, one not confirmed, and one open signal.

Situation-1(11/13/23): Confirmed NLT PowerTower signal with two target dots to be reached in one to ten weeks.

Situation-2 (11/13/23): NLT SwingPower signal, adding to the directional move of the prior signal.

Situation-3 (1/8/24): Confirmed NLT PowerTower signal with two target dots.

Situation-4 (1/29/24): NLT SwingPower signal, pointing out a further upward move.

Situation-5 (3/4/24): NLT SwingPower signal, but the direction is not confirmed by the price move of the next candle not reaching the price threshold of selling < $ 504.91.  

Situation-6 (4/8/24): NLT Early down signal will only validate when the low is ticked out in the price move of the next candle – and it happened.

Swing Trading Example

Here, we decide from daily charts with an expected holding time for open positions between one and ten trading days and a culmination point at three days.

To demonstrate the strength of our system, we pick BRK-B, Berkshire Hathaway, between 2/28 and 4/12/24 and highlight if the price direction indicated is confirmed or not. The following chart shows six potential trade indications, four confirmed and two not (signals 4 and 5). The confirmed indications came to their system-defined target: dot on the chart, which closed the trade based on the system’s timing.

BRK/B NLT Daily Combined System Chart

Day Trading Example

The NLT Timeless concept enables traders to diversify their strategies and capture broader market movements by identifying trading opportunities across various price frames and asset classes, allowing decisions at multiple price increment levels.

NLT day trading decisions are based on a couple of rules, and we best start when not to accept a signal:

  • In an NLT Purple Zone, because of the ambiguity of price direction.
  • When an NLT Box Line cuts the way to target short, indicating supply or demand levels.
  • There is no entry at the exit level of the prior signal.

We enter a trade when the spelled-out buy> or sell < price threshold is ticked out in the price development of the next candle. If this does not happen in the price move of the next candle, we will delete our order.

The trade target is highlighted by a dot on the chart and specified by the system.

We now take a recent example for the E-Mini S&P 500 Futures Contract on April 8, 2024,  between 3 a.m. and 1:30 p.m. EST, highlighting and discussing eight trade situations.

E-Mini S&P 500 Futures Contract April 8, 2024

Situation-1: A confirmed short signal came to target two after two candles, and we do not consider the second signal on the way down (down moves are framed in red, up in blue).

Situation-2: A confirmed long signal needed five candles to reach the system set target.

Situation-3: A confirmed short signal came to the target.

Situation-4: A dashed NLT Box Line cuts the way to target short, and we do not accept the trade.

Situation-5: A confirmed long signal came to the target. All signals have their tops at the red dashed line, which was not infringed on the way to the target.

Situation-6: No trades in the NLT Purple zone and no trades at exit levels.

Situation-7: A confirmed short signal that reached its target.

Situation-8: A confirmed long signal came to the target, and we did not consider the next signal after the trade initiation candle.

We do not always claim to have all winning trades, but we offer high probability setups above 68% by combining NLT Systems.

Conclusion

Whether your preferred trading style is, regardless if you are a novice trader or an experienced pro, NeverLossTrading has the solutions you need to navigate today’s markets confidently. With our comprehensive range of trading tools and education, you’ll be well-equipped to master the art of trading, striving to achieve consistent profits.

When you are ready to trade and invest in high-probability setups, ask us for our system bundle, and we work with you in a live session to find out what suits you best.

contact@NeverLossTrading.com Subj.: Demo

All our teaching and coaching is one-on-one; hence, spots are limited, and you do not want to miss out.

To receive our free trading tips, subscribe here.

We are looking forward to hearing back from you,

Thomas

www.NeverLossTrading.com

Disclaimer, Terms and ConditionsPrivacy | Customer Support

Monday, March 12, 2018

Trade and Invest Mind-Based – Not Emotional

We are all driven by emotions; however, when it comes to trading and investing, you should give yourself rules on which you act and not believes.
Intro NeverLossTrading Rule Based Decision Making
What are the dominant emotions driving private investors? Fear and Greed.

The fear of losing, paired with the greed of missing out on an opportunity.

When the Bitcoin was on the hype, I had many who asked for a quick tip – and my answer was: stay out; when the average person starts knowing about an opportunity, it is over and somebody needs to buy at the high – let it not be you.

On a recent advertisement for a trading system that is around since long, the following trade proposal was propagated for AAPL, trading with Vertical Put-Spreads:
  • Maximum profit: $1,100
  • Maximum loss: $1,900
When we calculate the outcome based on different probabilities over 10-trades, you will immediately see that the odds are not much in your favor, even so, the trade was proposed based on the idea that you make money if the share price goes up, moves slightly down, or goes sideways.

10 TradesWin/Loss 50:50 60:40 65:35
Reward1100-4000-1000500
Risk1900   

Sure, AAPL is a great company with products we love, but we want to encourage you: stop falling in love or being emotional with investments. At a 65% probability to predict the future, you should not only reach breakeven, you should make money!

A simple basic rule for making money trading: The odds of the trade setup need to be in your favor and you need a system that helps you to predict the future with a high probability.

There are not risk-free trades, and the idea that you can find trades that have a more than two-times the reward, compared to the risk to take, are rare: about 5% to 10% of the opportunities we record. Hence, you are doomed to somewhere trade in the area of a 1:1 reward/risk.

How to make money this way?

By following a system that gives you high probability trade setups ≥ 65%, applying clear cut money management and risk management rules.

Sounds simple, doesn’t it?

It all starts with a system that records the price action of now and proposes when money is flowing in or out of an asset. For you to be part of the directional move, the system shall measure the potential price expansion, the statistical volatility (where to place the stop) and the maximum time in the trade: rule-based trading and investing.

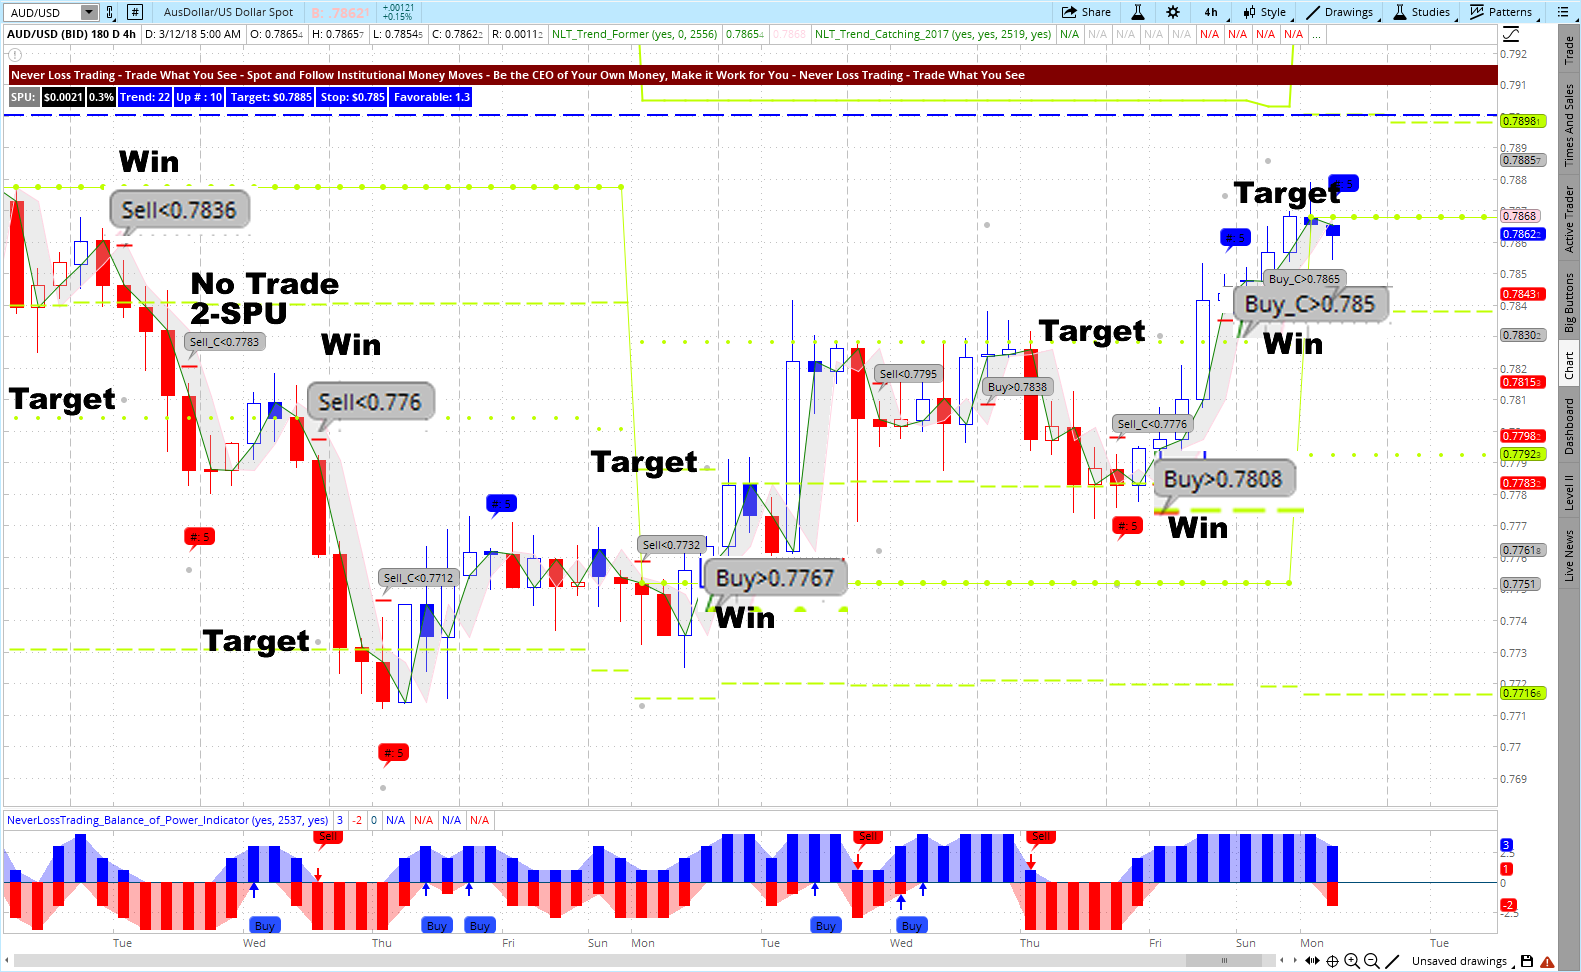
The following examples show, how we initiate trades with buy-stop orders or sell-stop orders when the formulated price threshold is surpassed: Sell<0 .7836="" a="" additional="" apply="" at="" available="" best="" by="" candle.="" chart.="" development="" dot="" e.g.="" find="" gray="" in="" is="" next="" of="" on="" one-on-one="" p="" price="" red-cross-bars.="" rules="" stop="" surely="" target="" teach="" the="" times.="" we="" which="" your="">
AUD/USD NeverLossTrading TrendCatching Example
AUD_USD March 12, Example for NLT TrendCatching.png
Each of the highlighted trade situations allowed for an about 25 pip price move to target at a similar risk.

Let us demonstrate rule-based trading on a stock example:

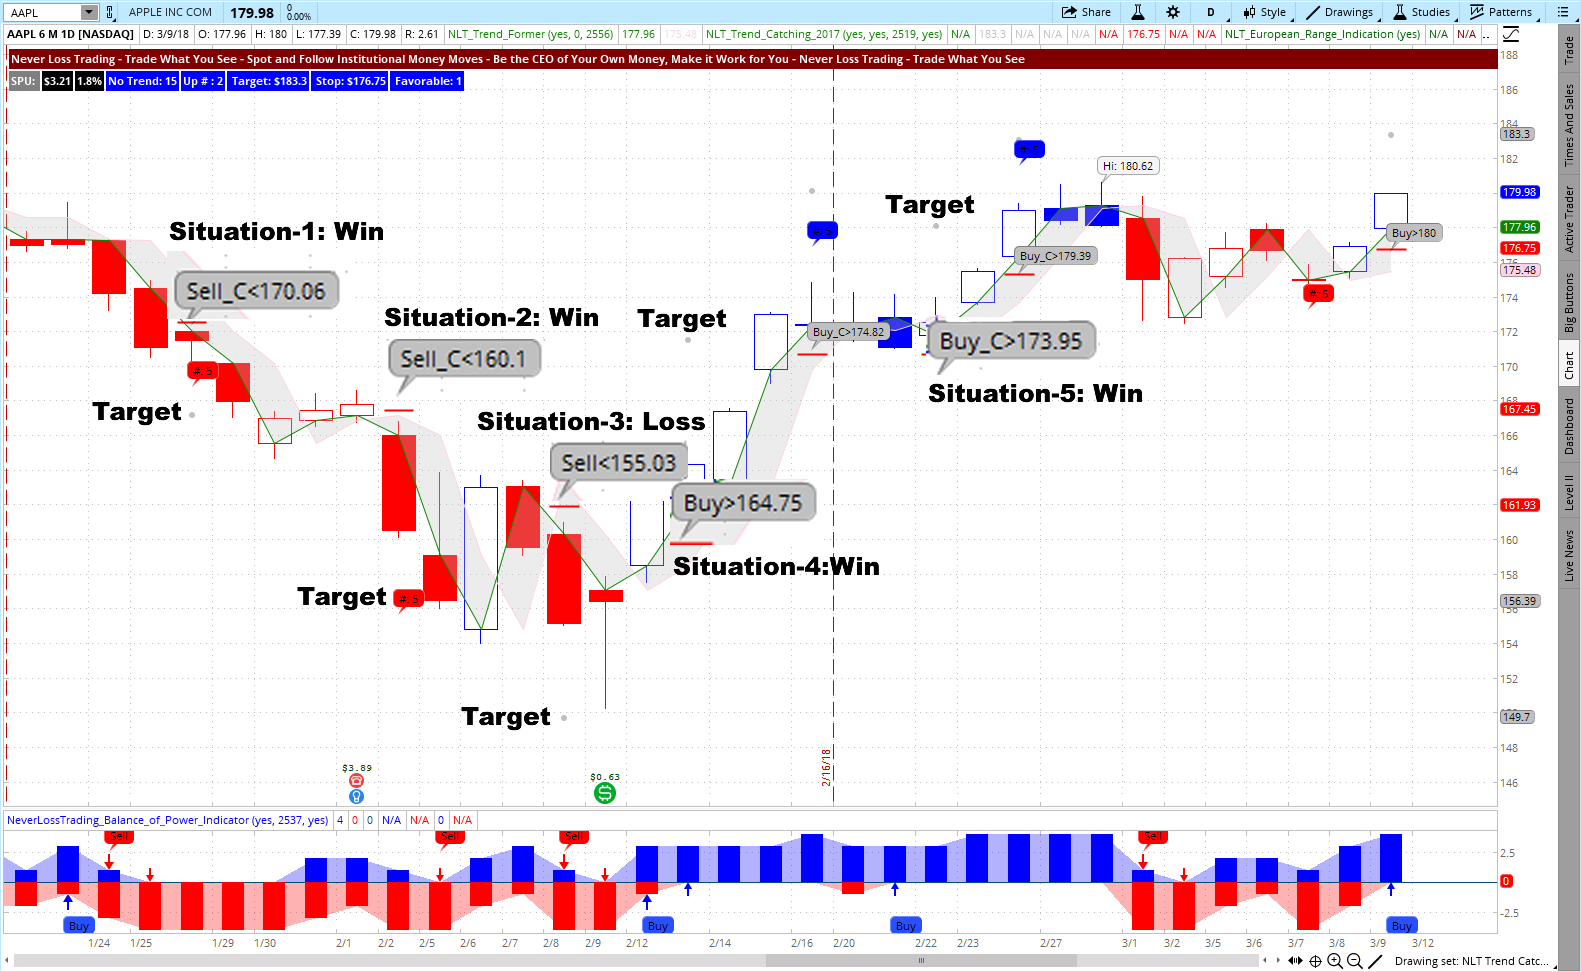
AAPL NeverLossTrading Daily TrendCatching Chart
AAPL March 12, 2018.png
In five trade situations, we had four winning trades and one loss: high probability!

At each situation, the trade target was formulated and so was the stop. Only trades that were according to our reward/risk rule were accepted.

When you want to learn rule-based trading, we are happy to work on a live demonstration with you, where you can experience how our systems work at your preferred assets and time frames.

Call: +1 866 455 4520 or contact@NeverLossTrading.com

If you are not already signed up for our free trading tips, reports, and webinars…sign up.

We are looking forward to hearing back from you,

Thomas

Disclaimer, Terms and Conditions, Privacy | Customer Support