Summary:Find and execute stock trades in today’s market environment. Suppose you hold a solid portfolio of stocks in an IRA or other account and care about your financial freedom and well-being; read on and experience how to make a difference!
The typical stock trader follows the imperative: make the trend your friend. Since 2009 we have had a strongly up-trending market, but this reality changed starting in January 2022.
The market is choppy, and those who trade at crucial price turning points have multiple opportunities for producing returns with trades to the upside and downside.
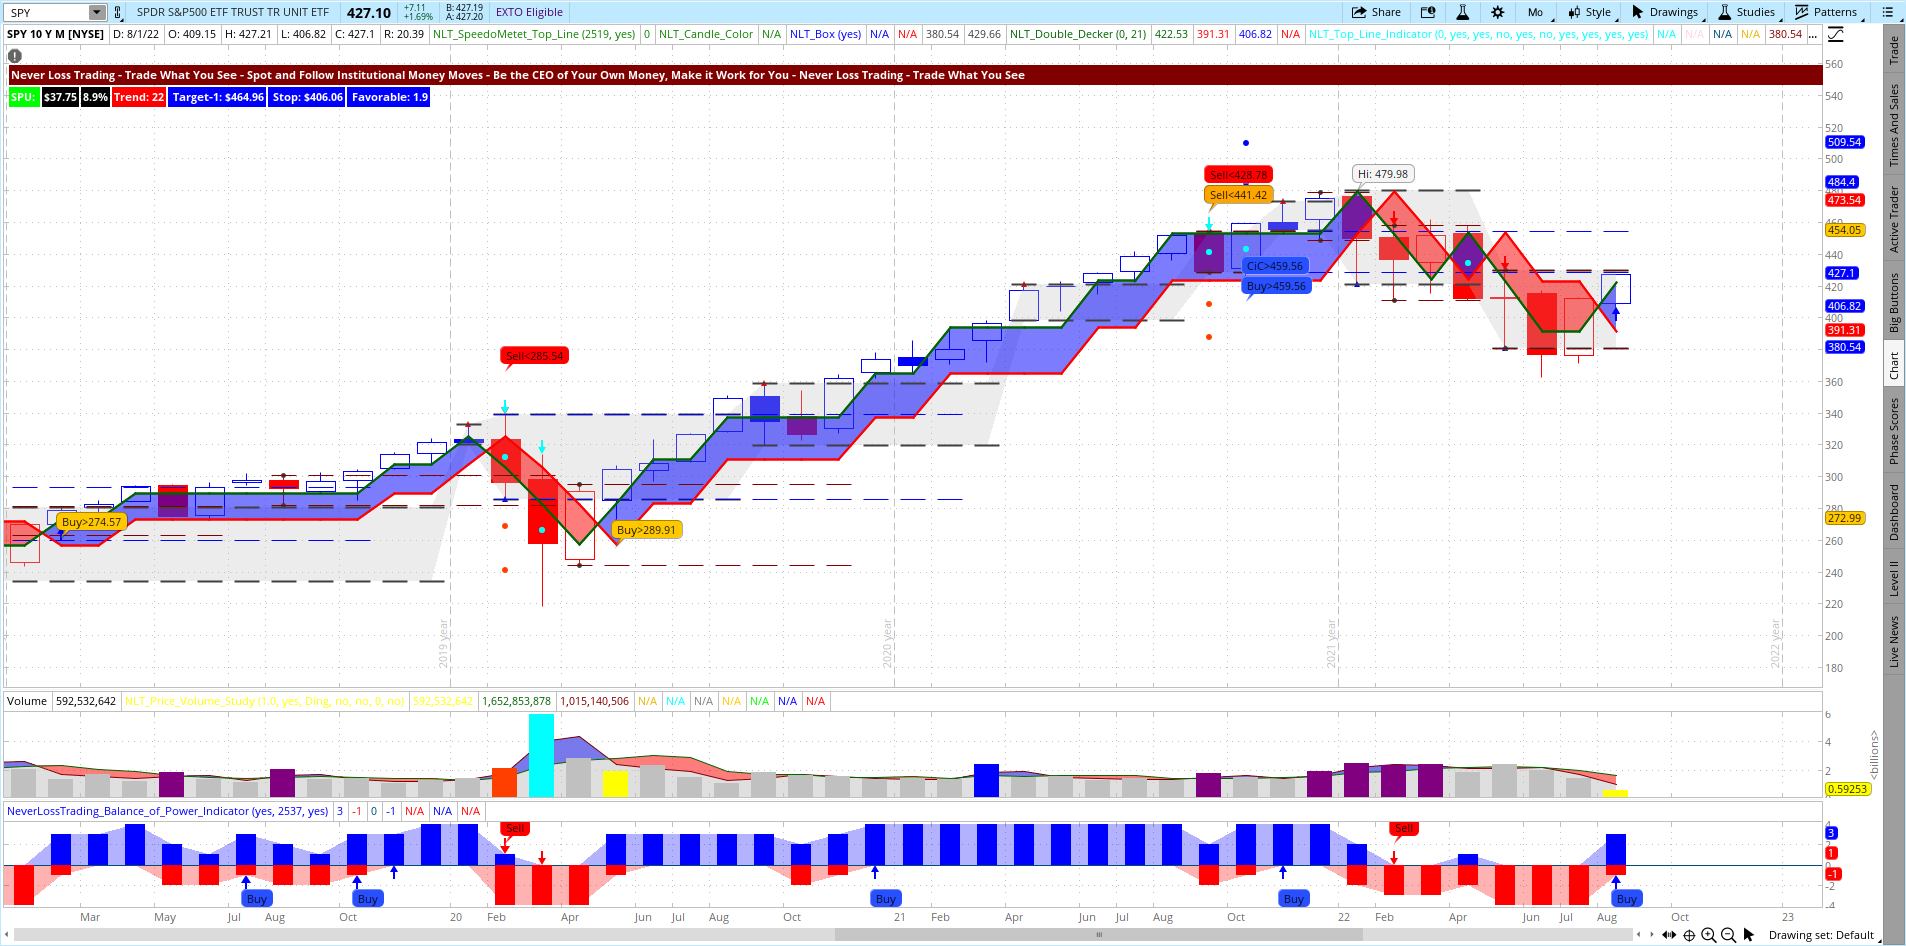
SPY (ETF of the S&P 500) Monthly NLT Top-Line Chart
The chart above shows how our system finds crucial price turning points and if you want to follow an evolving trend, use the red line of blue or red frame around the price move.
In essence, you need a system that supports you in making sound decisions based on market reality. Finding and acting at crucial price turning points is not common knowledge; however, it is learnable, and we offer concepts and a step-by-step approach to follow.
Let the system tell you when and what to do, and your trading and investing endeavors will be more beneficial long term. We provide more than ten years of experience in helping people decide right from the chart when entering and exit positions and what to do to be your money manager, aiming to beat the index and the average money manager achievements.
You can control what you can measure; however, many stock traders never set measurable goals, praise their winners and neglect losers. So make a difference and learn a new trading approach!
Let me give you an example of a straightforward way of acting based on the NLT Top-Line chart:
Indicators spell out buying- and selling opportunities: Buy > and Sell <. Buy and sell indications need to be confirmed in the price continuation of the next candle.
Red lines on the chart signify stop lines.
Many private investors prefer technology shares. The QQQ is an excellent index that contains the major US technology companies, like AAPL, AMZN, TSLA, and MSFT, to name a few. We take a weekly chart in our example.
Our chart’s color up moves in blue and down movements in red; when the market is undecided, the chart shows an NLT purple zone, mixing red and blue, and we do not initiate trades in this zone by a lack of directional commitment.
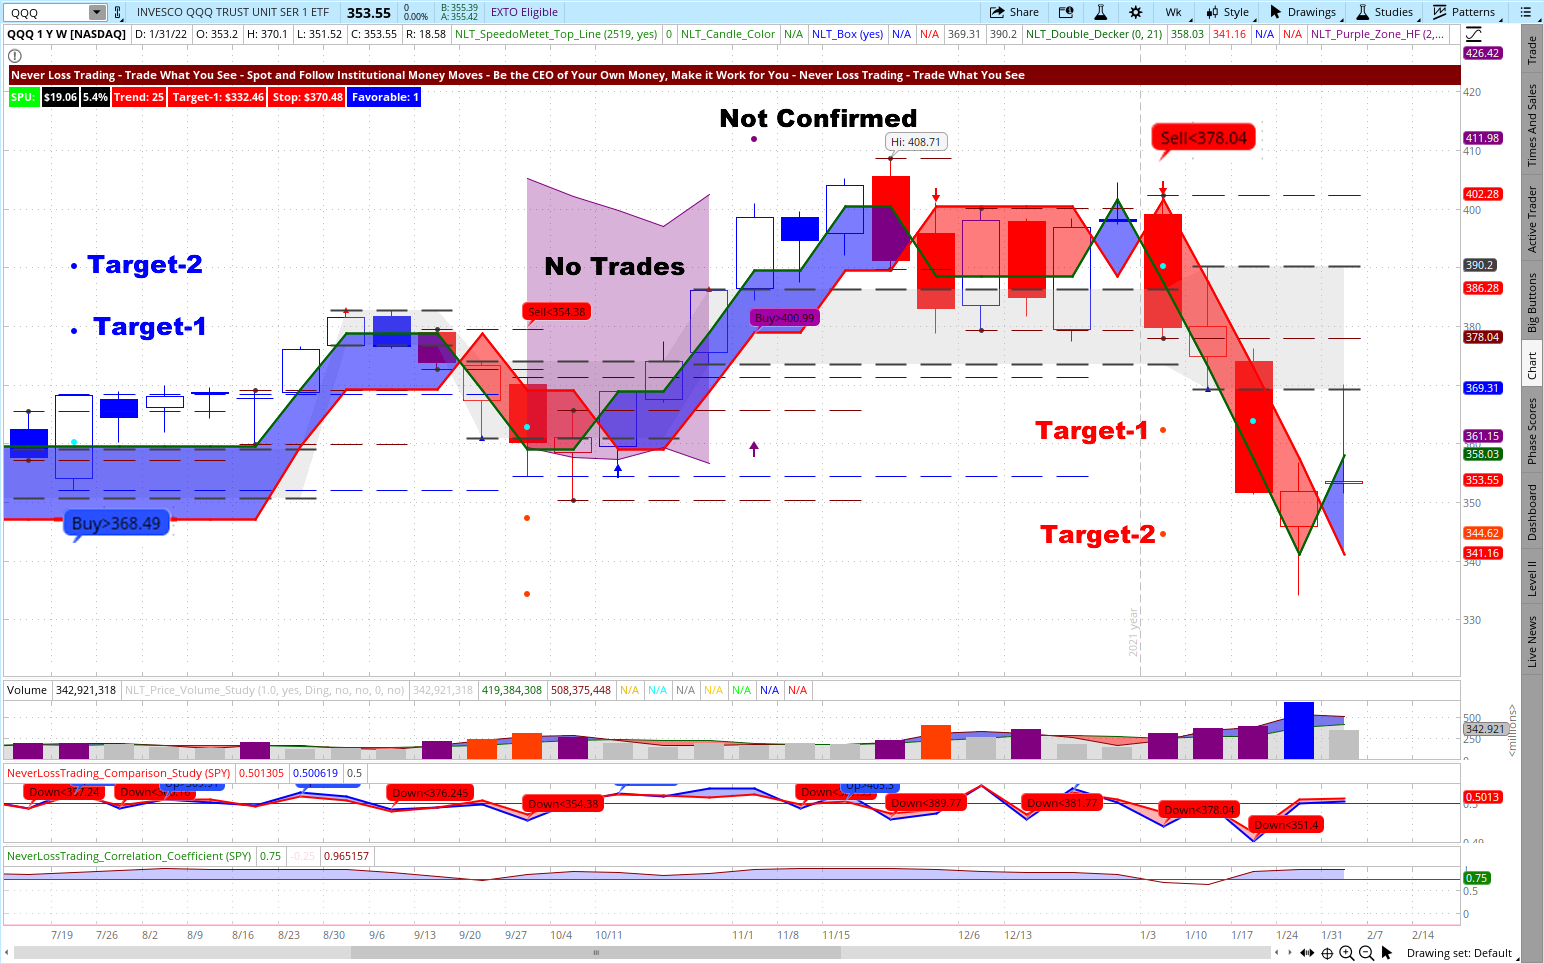
QQQ on a Weekly NLT Top-Line Chart
Let me explain the chart action from left to right:
Buy > $368.49: the signal was confirmed in the price movement of the next candle, and a long position opened. Two target points were formulated, and after Target-1 was reached ($390.50), we closed the position and produced a 6% return on cash invested.
If you just held your position, hoping the market comes back, the QQQ shares in this example would be at $350 and had produced a -5% drop.
Compare the two scenarios: The investor who decided based on our system produced an 11% difference in return. When you applied allowed trading methods to participate in the downside move, it offered an additional 9% gain – and we are talking about six months.
At this point, you might want to throw the argument:
“It is not permitted to short stocks in an IRA.”
True; however, we share the concept of how you can follow downwards moves with options trades allowed in your IRA; you only need to submit paperwork to obtain options level two for your IRA account.
On a $100k account, acting along with the signals, a $15,000 gain was possible compared to a $5,000 loss with a buy and hold strategy.
My question to you:
Are you ready to learn the rule of such a system to put them in action to trade when the market moves?
We are more than ten years in business, working one-on-one with people to apply our systems and strategies:
Best situations to trade on
Strategies to apply
Position-sizing
Money management
Discipline
Financial and business plan and more…
Adult learning works best one-on-one, considering your risk tolerance and affinity to specific assets like stocks, options, futures, and FOREX. This way, you can learn at your best available days and times.
Let us present four trading examples, expressing how trading is best done in a mechanical way and manner:
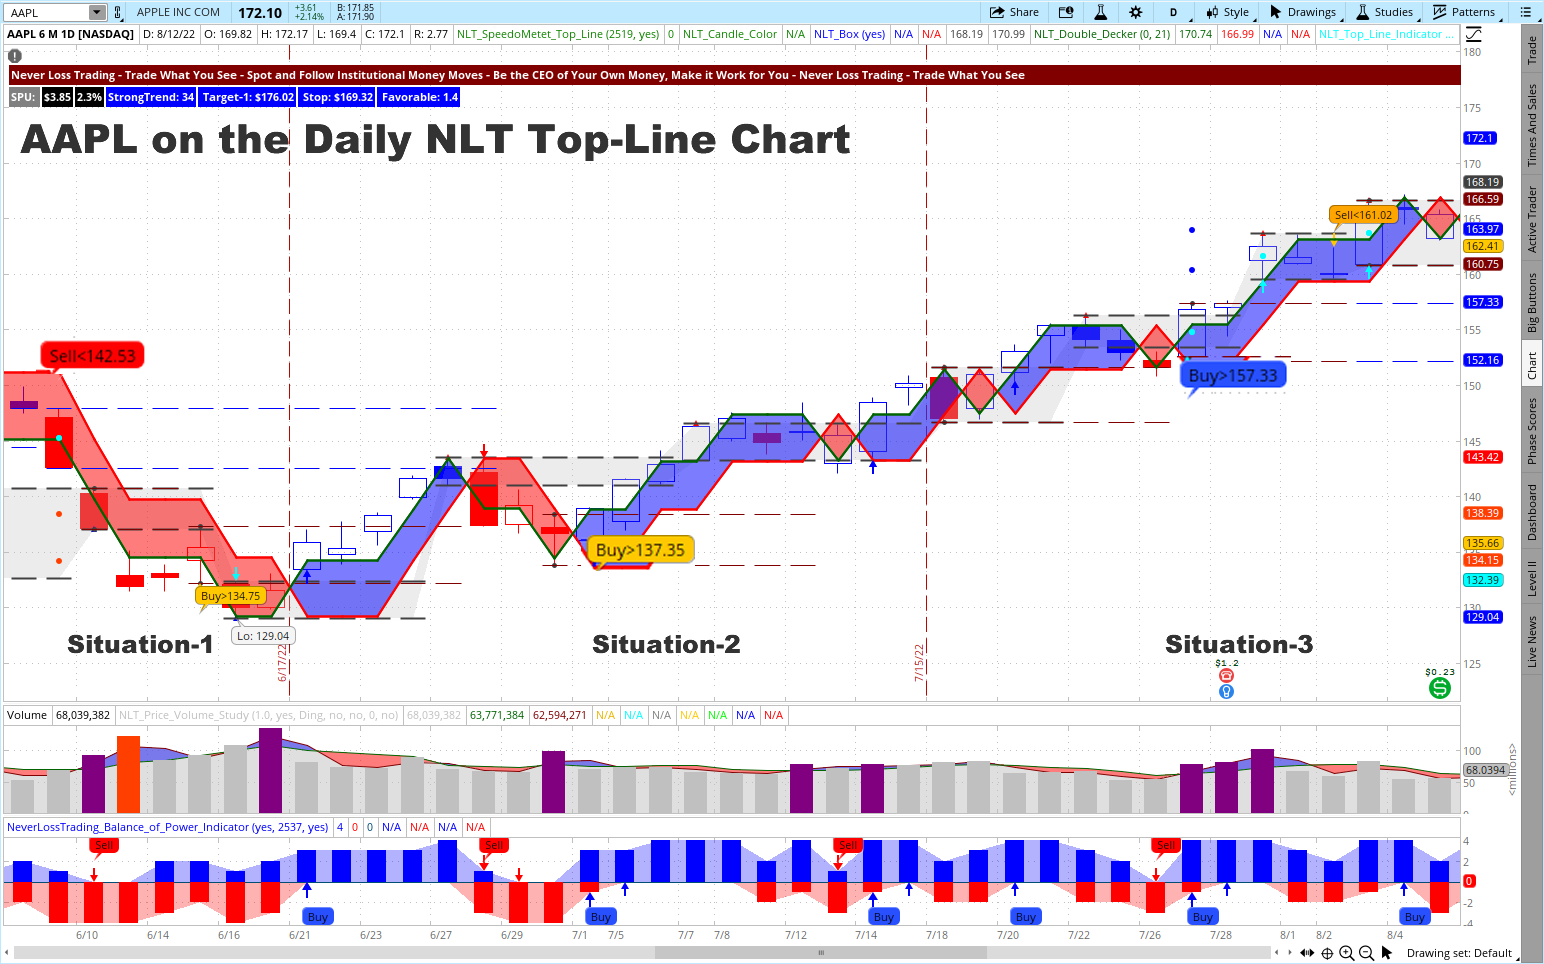
AAPL swing trading from a daily chart, June to August, 22
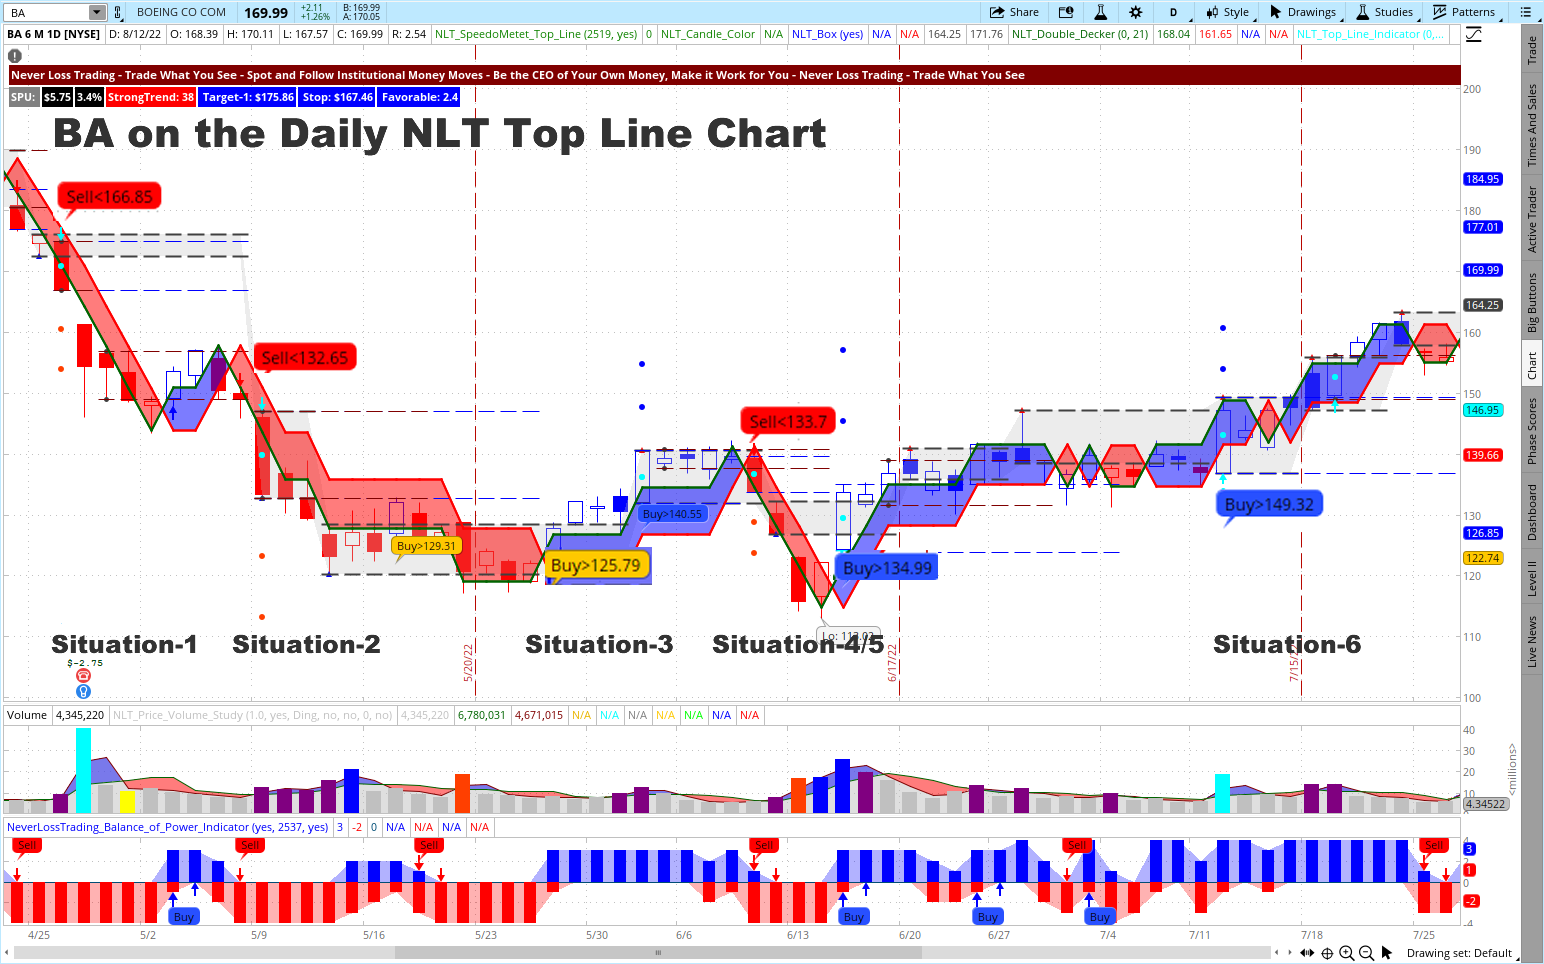
BA on a daily chart, April to July, 22
LULU on a chance in command price point, July 2022
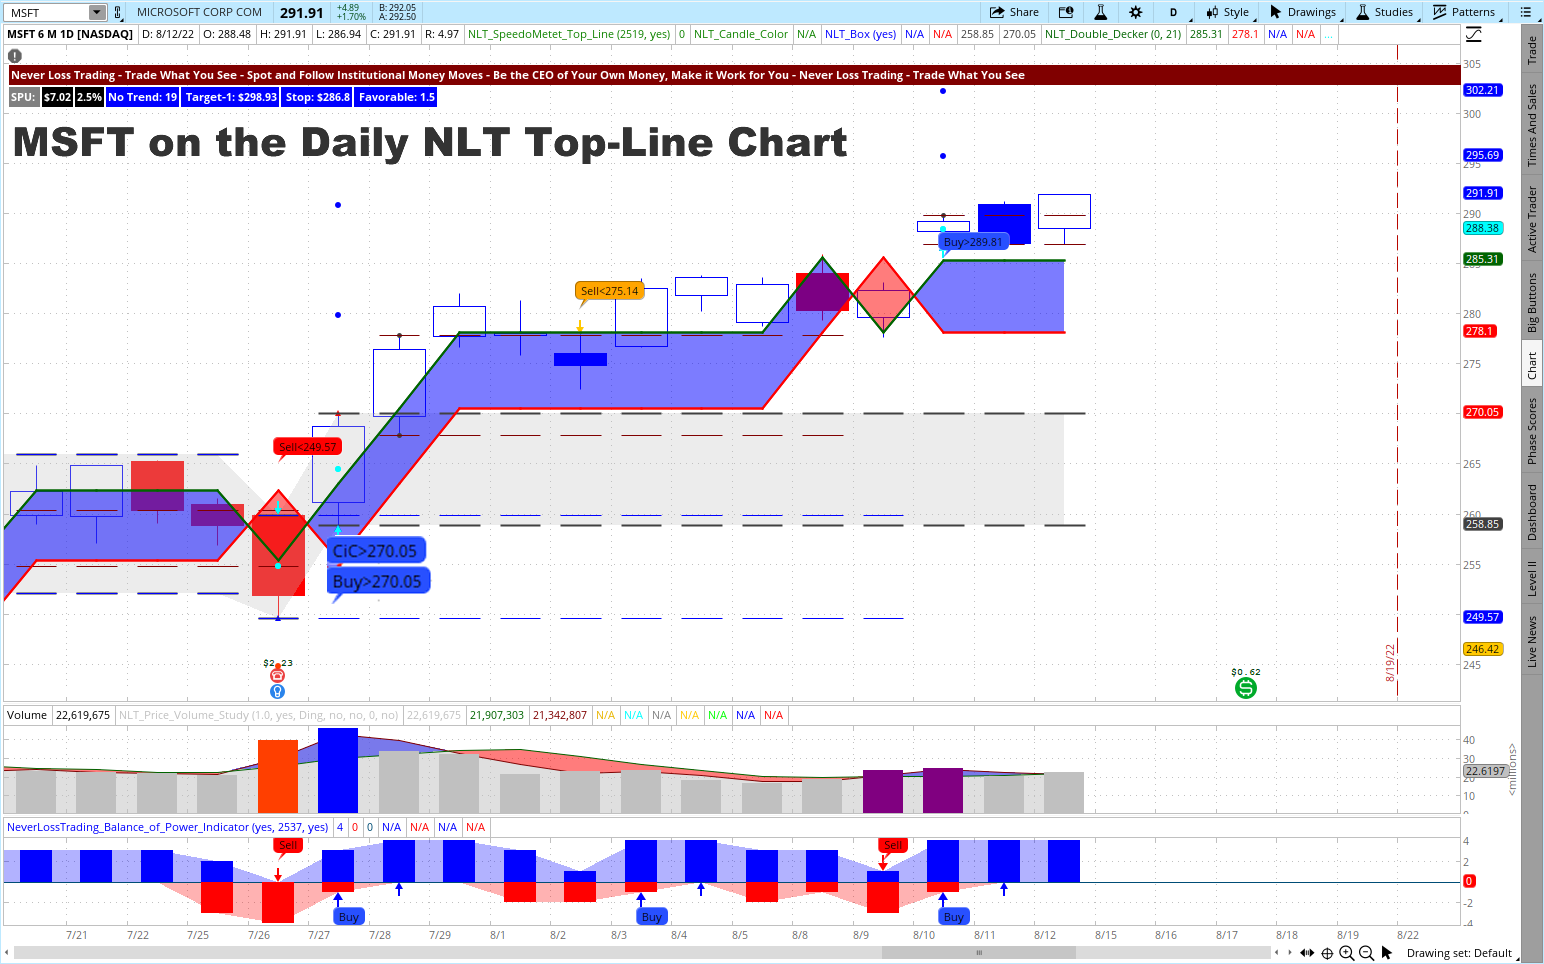
MSFT on a change in command price point, July 2022
If you want to see how our systems work in a live situation, schedule an online meeting with us:
You see two more orange signals on the chart, which were not confirmed in their price direction and thus not considered.
As you see, we trade at crucial price turning points for pre-defined price moves, exit the trade and re-invest when our scanners find the next trading opportunity.
Swing Trading Example 2
The chart shows six confirmed trading opportunities, three long and three short selling opportunities: By the concepts we teach, you can participate in both price directions with risk-limiting strategies.
Question: how do you find those trading opportunities?
NLT Top-Line has its scanners and watch list indicators so that you can scan the entire market, sectors or stock lists of your choice.
We also provide you with the NLT Stock Alerts, where those opportunities are highlighted for you with specified entry, exit, and stops. The NLT Alers are sent out daily in the early morning hours so our subscribers can be ready to enter conditional orders and trade without needing to be in front of their computers.
Here is an example of the NLT Stock Alert for July 28, 2022:
The three stocks highlighted had specified entry price levels to use conditional buy-stop orders to trigger when the entry price level was reached on July 28, 2022.
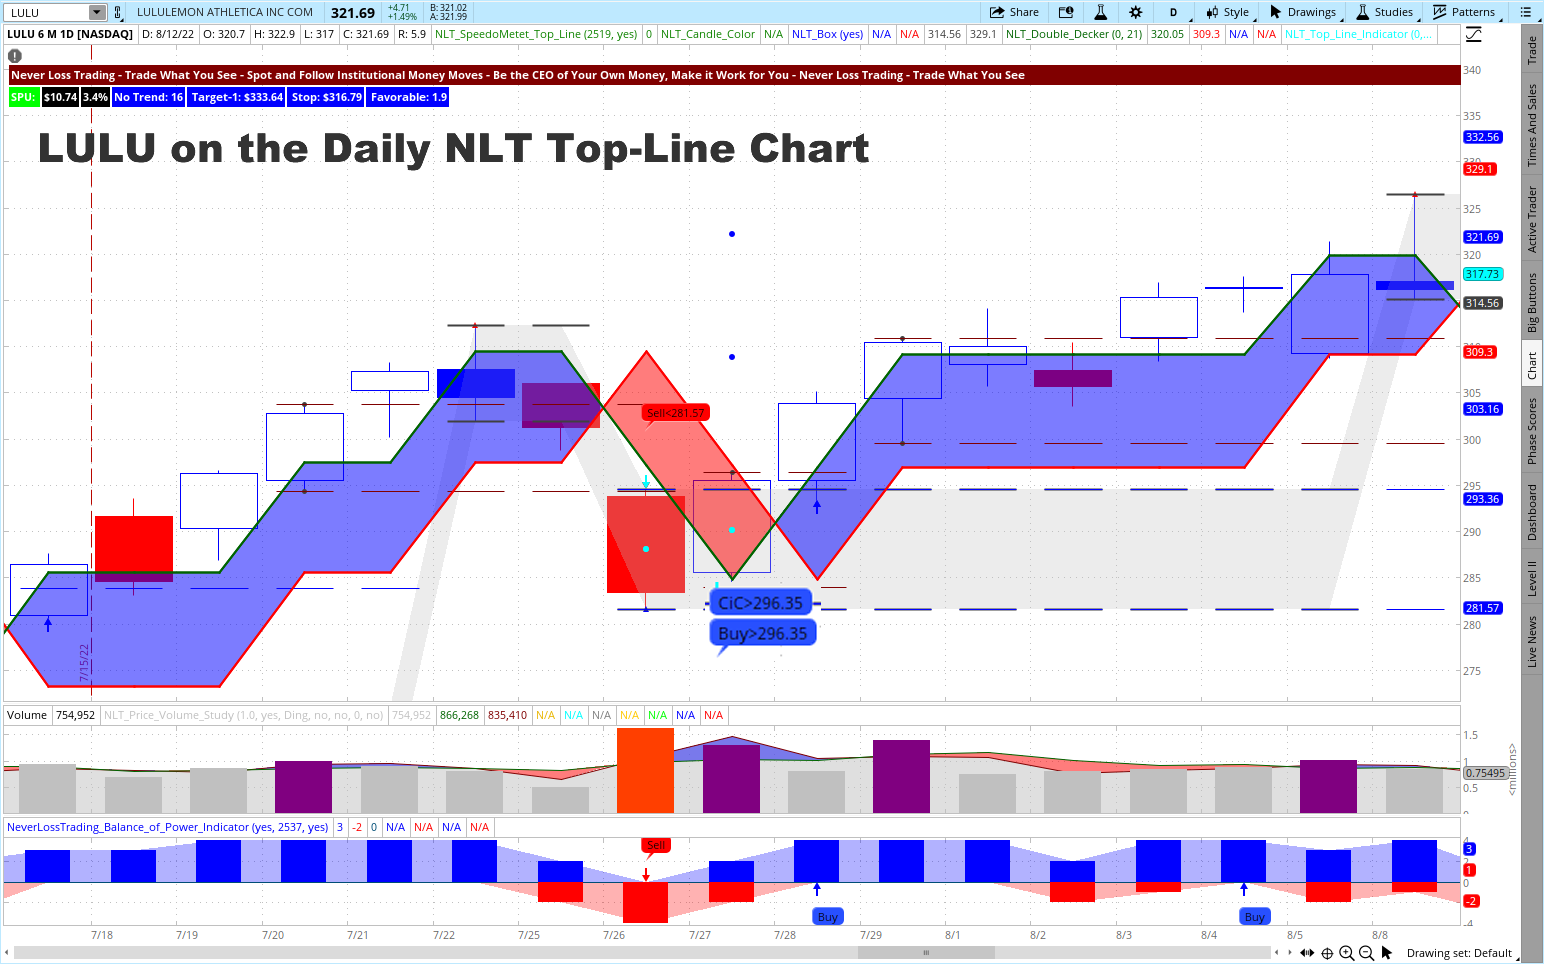
Let us take LULU and check on the trade situation and price development:
Swing Trading Example 4
End of the day, July 27, the chart printed the buying opportunity with a price threshold of Buy > $296.35 and CIC, wich stands for a situation we call “Change in Command.” The system signaled that buyers took over from sellers, indicating that we have a price situation with a very strong price move potential to the second dot on the chart ($322 or a return on cash of 8.7%). The expanded price target was reached on 8/8/2022.
MSFT had a similar situation to LULU and reached its target-2 on 8/12/22 for a 7.6% return on cash.
Swing Trading Example 4
The price threshold for MU: Buy > $62.39 was not reached in the price development of the candle on July 28, 2022, and no trade was conducted.
We offer a summer special for NLT Top-Line and are ready to share more examples with you in a personal session:
On the NLT Alerts, we highlight stocks with favorable options conditions. Thus they allow, aside from trading the stock, to combine stocks with options or trade the stock options with the NLT Delta Force Concept so that you can participate in the price movement of the underlying for a fraction of the investment and with high leverage.
We have over ten years in the trading education business, teaching one-on-one at your best available days and times, and we are trading our account day-by-day and helping clients lets us provide long-term experiences and support.
Customer service and tailored mentorships are our virtue. Following this principle, we provide:
Server-installed Software
Real-Time Data
System-Defined Entries, Exits, and Stops
Position-Sizing
Time-in-a-Trade
Trading-Strategies
Risk-Handling
Business Plan (financial- and action plan)
Own scanners to find investment opportunities
Watch list indicators for finding changes in supply and demand on multiple time frames
Basing your trading and investing decisions on defined rules is learnable, and we are here to support you!
Follow our free publications and webinars…sign up here, and we are looking forward to hearing back from you,
Summary:What is the best behavior and action to prepare for trading and investing? Get insights into what is needed to change your outlook and results or decide not to trade! What we share can be life-changing, and it takes a moment of reading and comprehending.
In many disciplines in life, one can get through with mediocre results:
You achieve a high school diploma
Graduate with a bachelor’s degree or even master
Get a job that pays your bills
In trading or investing, mediocre performance or attitude guarantees long-term losses.
The issue with trading: even a great attitude and discipline can substantially hinder achieving your goals.
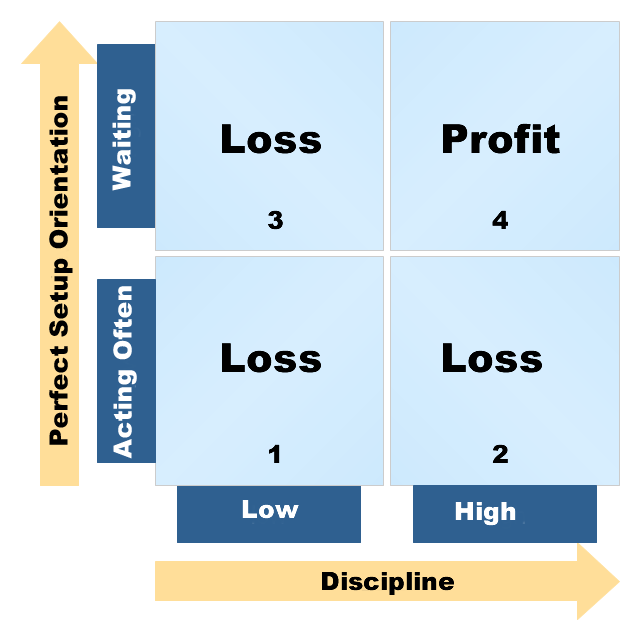
We best explain by a graphic that relates the abilities of:
Waiting for the perfect setup, instead of acting at every possibility
Having the discipline of being prepared for the trading day and acting when it matters
Knowledge is another dimension, but we leave that aside at this point and spin a two-dimensional matrix considering the two behavior variables and four quadrants:
Behaviour Matrix of Traders/Investors
Quadrant-1: Traders with minimal discipline and preparation operate at frequent trade setups and have no other chance than producing constant losses. We often meet people who are not prepared to make fast trading decisions but dedicate themselves to deciding from one or five-minute charts.
Quadrant-2: Highly disciplined and prepared persons with frequent transactions still produce losses because they accept trade setups that are not highly probable, and as a result, their losses outweigh the gains. In this quadrant, we find highly skilled people that are successful in other disciplines but not trading or investing.
Quadrant-3: By applying little discipline, traders in this quadrant miss opportunities and act on lower likely chances when their time allows instead of when the market allows. The result is higher losses than gains.
Quadrant-4: This is what it takes: the solid discipline of preparation and the patience to wait for the perfect setups to act, considering system probability and the overall market development. We will fill this with life now.
The probability of your system and the control of your behavior both influence your trading results.
Here are some of the determining factors we will further investigate:
System and Behavior Components
System
Behavior
High probability≥ 65% Specified entries, exits, stops Trading at Price Turning Points Risk-Limiting Strategies
Structured Prepared Repetitive Disciplined
Most traders forecast price moves around the 50% to 55% level, using an old-fashioned decision-making basis that does not propel for today’s markets. So let us calculate the difference between a model with a 55% probability and one of 65% and estimate the expected likelihood of winning six or more out of 10 trades. Here are the results:
A 65% system gives you a 75% chance to predict and win six or more out of ten trades.
A 55% only gives you a 50.4% chance for six or more winners (random predictability).
You know now why we propagate high over low probability.
Trading success could have a simple equation: when you show higher wins than losses and win more often than you lose, everything is set and done to make money long-term.
However, easier said than done.
The above equation would sponsor the behavior of accepting minor losses and letting your winners rise.
Unfortunately, beginning traders fall into this trap: set tight stops, try to let their winners run, and still lose.
Why does that happen?
To capture an entire or part of an evolving price movement, you need to leave enough wiggle room to avoid getting stopped in the natural statistical price volatility of the asset you trade.
Let me give you an example with the following assumptions:
Your system identifies a price move potential for $10
The likelihood of the setup is 65% (high probability)
The natural price behavior fluctuates with a $10 tolerance.
If you only allow for a $1 risk by setting a tight stop, you will always get stopped and never bring the trade to target. After being stopped ten times, you most likely will not push the trigger on the next opportunity and seek a new system.
Opposite to the base assumption, a tight stop setting is a tangible way to lose money constantly.
This triggers the question:
How much wiggle-room to leave when trading?
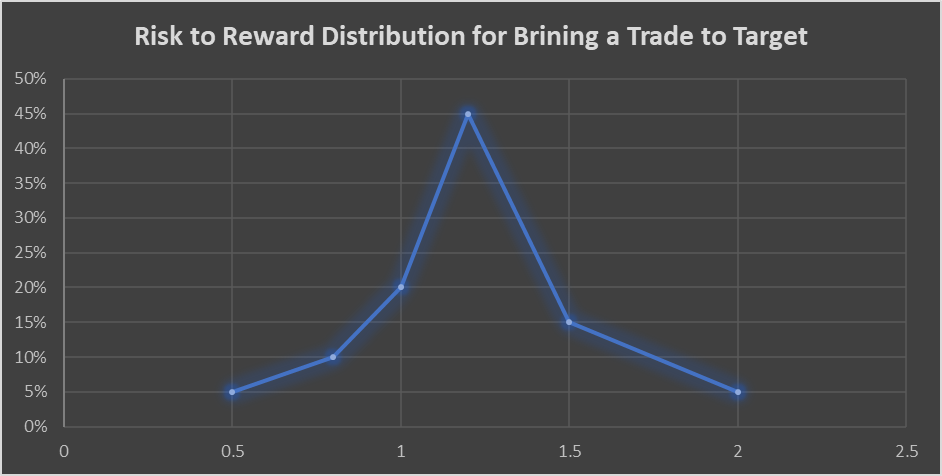
We built a quantitative model, and here are the research results:
Study Results of Risk/Reward Relations
If you leave a 1.2-times wiggle room, you have an 80% chance of getting your trade to the specified target.
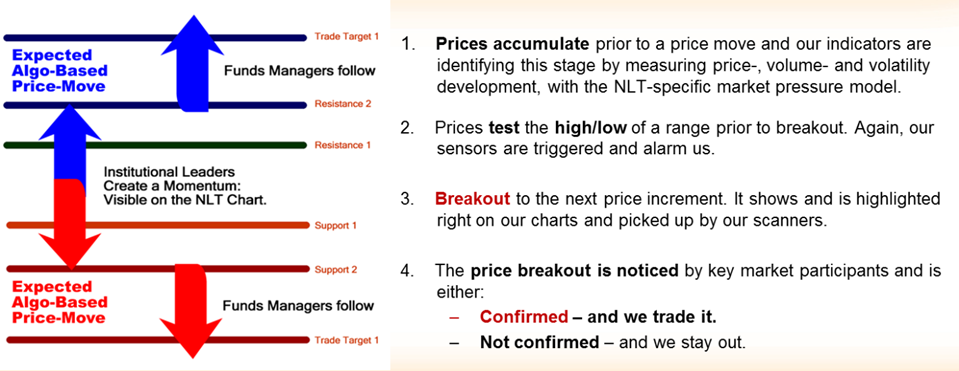
Ok, we now know where to set the stop; however, what is mostly missing is a proven model to forecast a price movement in distance and time, so you can relate the stop setting to it. Most forecasting models fail because the price movements in the financial markets are generally not normally distributed; they happen erratic and are best described by a leader and follower model, where the crowd follows the leaders!
We built a model based on an erratic price distribution and Mandelbrot math to replicate the actual happening in the financial markets.
NeverLossTrading Price Move Model
Theory: Key asset holders will have a solid need to re-balance their inventories. Thus, at a particular price expansion, they will either float- or shorten supply, which will result in an opposite directional price move that will then take away from our profits. Knowing this, we pre-calculate how far the expected price move will reach, and there we take profit, assuming it will retrace or reverse after.
Hence, we let the market and institutions appraise the asset price journey and latch on, entering and exiting positions faster than institutions can.
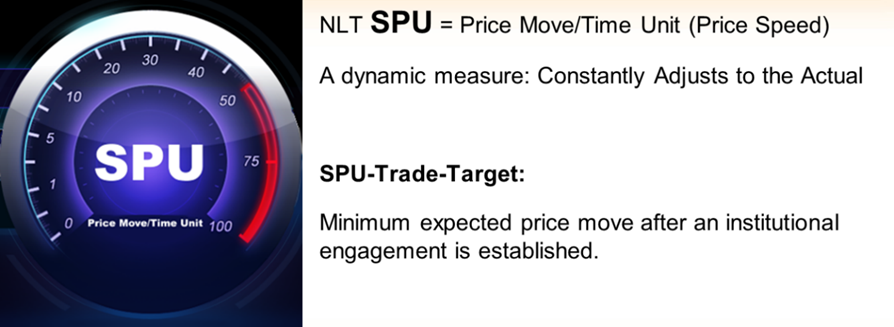
Our tool to calculate the expected price move is the SPU = Speed Unit, and it indicates how far a price move shall reach until it comes to an end.
With our systems, you can operate with conditional buy-stop and sell-stop OCO orders (one-cancels-the-other). Without the need to be in front of your computer for the orders to execute. You enter by price thresholds, ensuring that other market participants have the same directional assumption as you do and exit at the SPU target or adjust the trade at the stop.
NeverLossTrading SPU Model
By a change in the frequency and amplitude of the price movement over time, we specify indications to act on high probability price turning points, applying mechanical rules rather than leaving room for interpretation.
Takeaways
Operate with a system that gives you a 65% or higher likelihood of forecasting price movements at critical price turning points.
Let your system extrapolate the price movement for where to take profit.
Define your stop by a maximum of 1.2-times the reward you are striving for.
After setting system requirements, what behavior and preparation are critical to strive for a constant income?
Important Behavior Components:
In trading, your system is supposed to tell when to buy or sell. However, there is nothing to do at times, and not-successful traders feel they did nothing if they did not trade, while successful traders accept the fact.
Successful traders consider more factors in their trading decisions. Opposite to this, novice traders tend to act overconfident and impulsively. They take more significant risks without looking at the bigger picture and tend to urge revenge trades after they booked a losing trade: now it has to work, period!
Successful traders create greater financial returns by acting less frequently and holding positions to the system-specified target. On the other hand, novice traders often tend to cut their trades to targets short (anticipating it could turn in the opposite direction).
Traders that make money are more likely to deliberate before placing a trade and don’t enter until their belief in the trade is high, often waiting for multiple indicators to be in sync and then act. Generally, they don’t take sub-optimal setups as often as novice traders, producing a higher winning percentage.
Most retail traders are more prone to refusing to admit when they are wrong and hold on to losing trades longer than they should, hoping that they will turn around. On the other hand, pro-traders tend to admit mistakes more quickly and are more willing, and they tend to adhere to a strategy more strictly and are better at cutting losses.
Many retail traders tend to seek entertainment in trading, where they like to act on very short-term happenings, not considering that by the pure setup of the trade, considering slippage and commissions, they trade for action and will never make a return. However, successful traders are faster convinced and apply a meaningful approach to act at situations and setups where the odds are in their favor.
Conserving capital is essential in trading, and the available data suggests that trading pros tend to be more risk-averse than the average private trader. As a result, they trade less often and execute less risky strategies.
Pro-traders may also be more likely to focus on a smaller asset base, allowing for more knowledge gathering and better management of trades with fewer areas to watch.
Some researchers consider most retail traders to act more competitive, contrary to pro-traders that avoid getting caught up in the adrenaline rush of the moment and focus instead on their eventual spending goals.
Successful traders have already experienced that trading is not easy and therefore are more determined to succeed, including dedicating time to practicing strategies and finding a mentor whose advice they feel comfortable heeding.
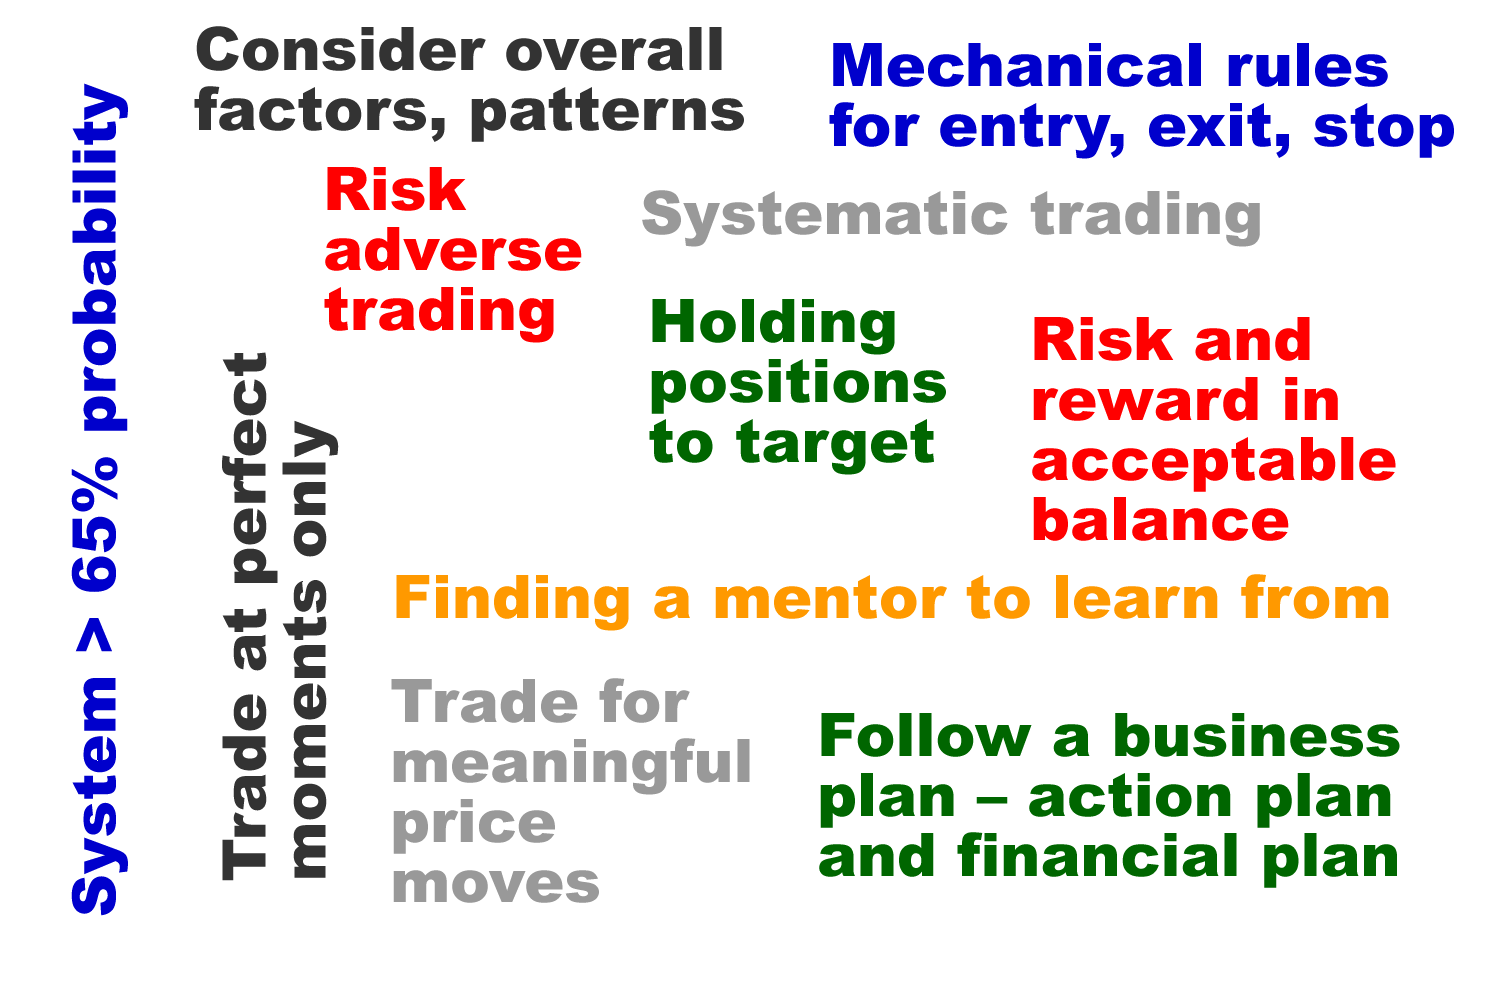
Let us put our findings into a graphic:
Crucial Trading Success Factors
In Summary:
Trade with a high probability system gives you mechanical rules for trade entry, exit, stop, or adjustment.
Have a business plan for trading that you stick to, containing an action plan (when and how to trade, when not) and a financial plan (assets, timeframes, return opportunities and the financial goal).
Analyze the situation well and take only fewer, high quality/high probability trades.
Do not add to losing positions and hold your winners to target.
Our mentorships help you have all this in place, but you still need to work with your inner nature, knowledge base, preparation, and acting.
Our coaching programs teach how to use our system indications in combination with strategies and the needed behavior to strive for trading success.
In the NLT Timeless concept, we help you to specify all critical trading elements at the spot, with entry conditions, exit, and stop in place, at acceptable risk/reward constellations. It takes five decision-making components down to one: when to enter.
Let us start with a timeless, time-based chart with a swing trading perspective.
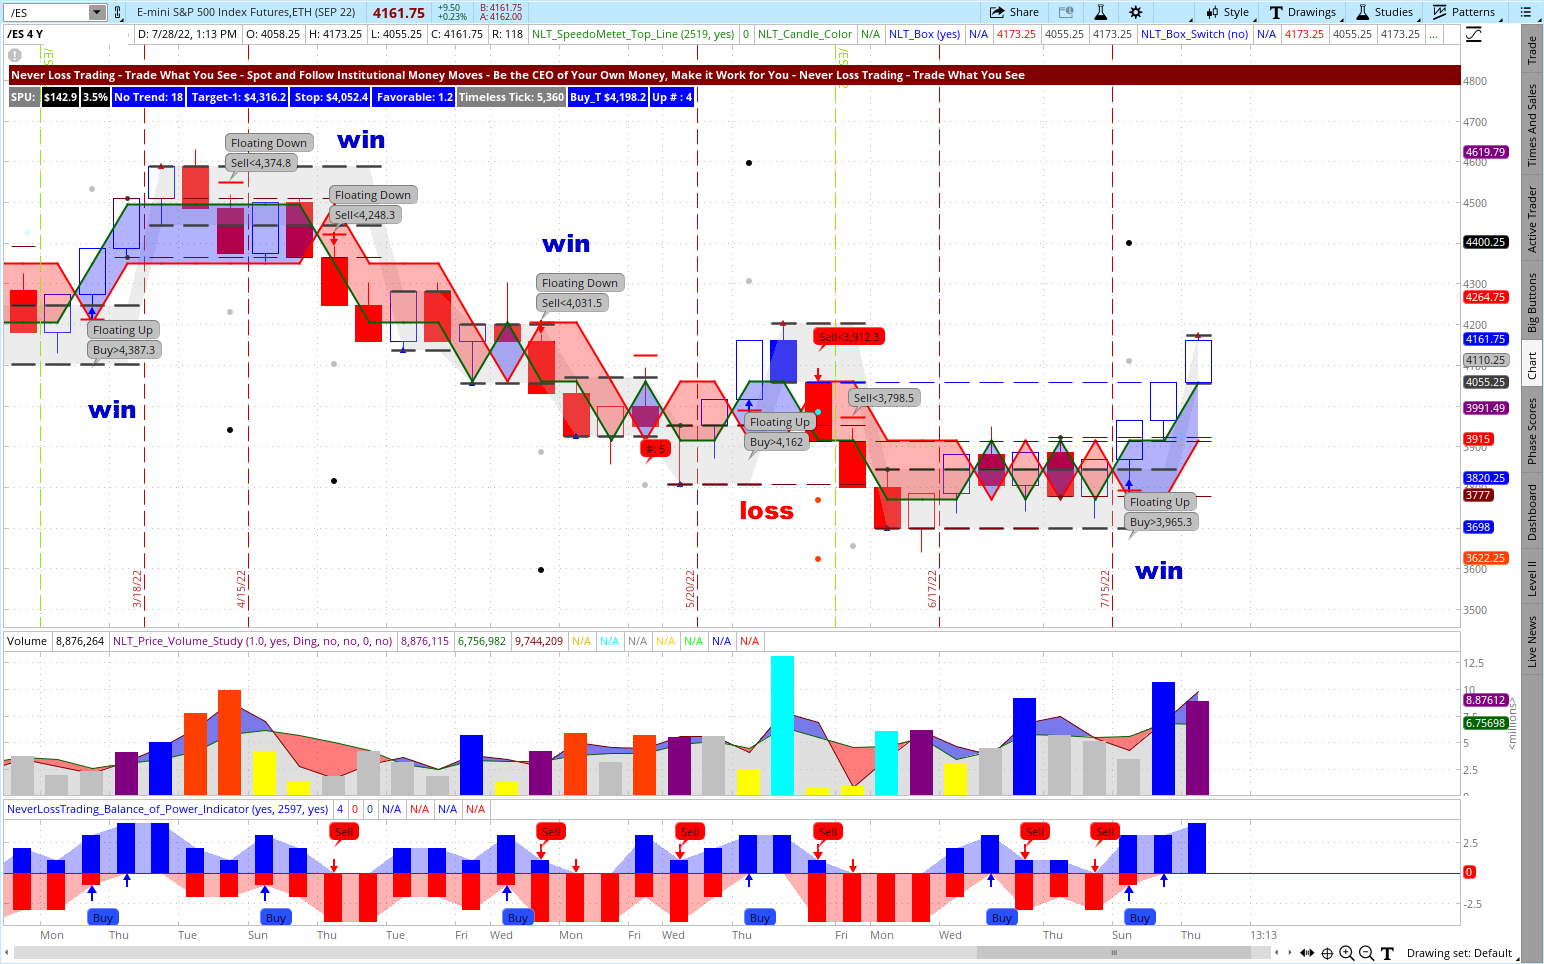
On the NLT Timeless example, we pick the E-Mini S&P 500 Futures Contact: Each highlighted price move represents a value change of the underlying contract of about $7,500.
/ES Swing Trading Chart March – August 2022
We are considering mechanical rules (accepting each signal), and the above chart showed five critical price turning points in the last four months. Four were winners, one a losing trade.
Explaining all details you see on the chart would be an undertaking outside the borders of this publication, and we are happy to hold an online meeting with you to demonstrate what the system can do for you:
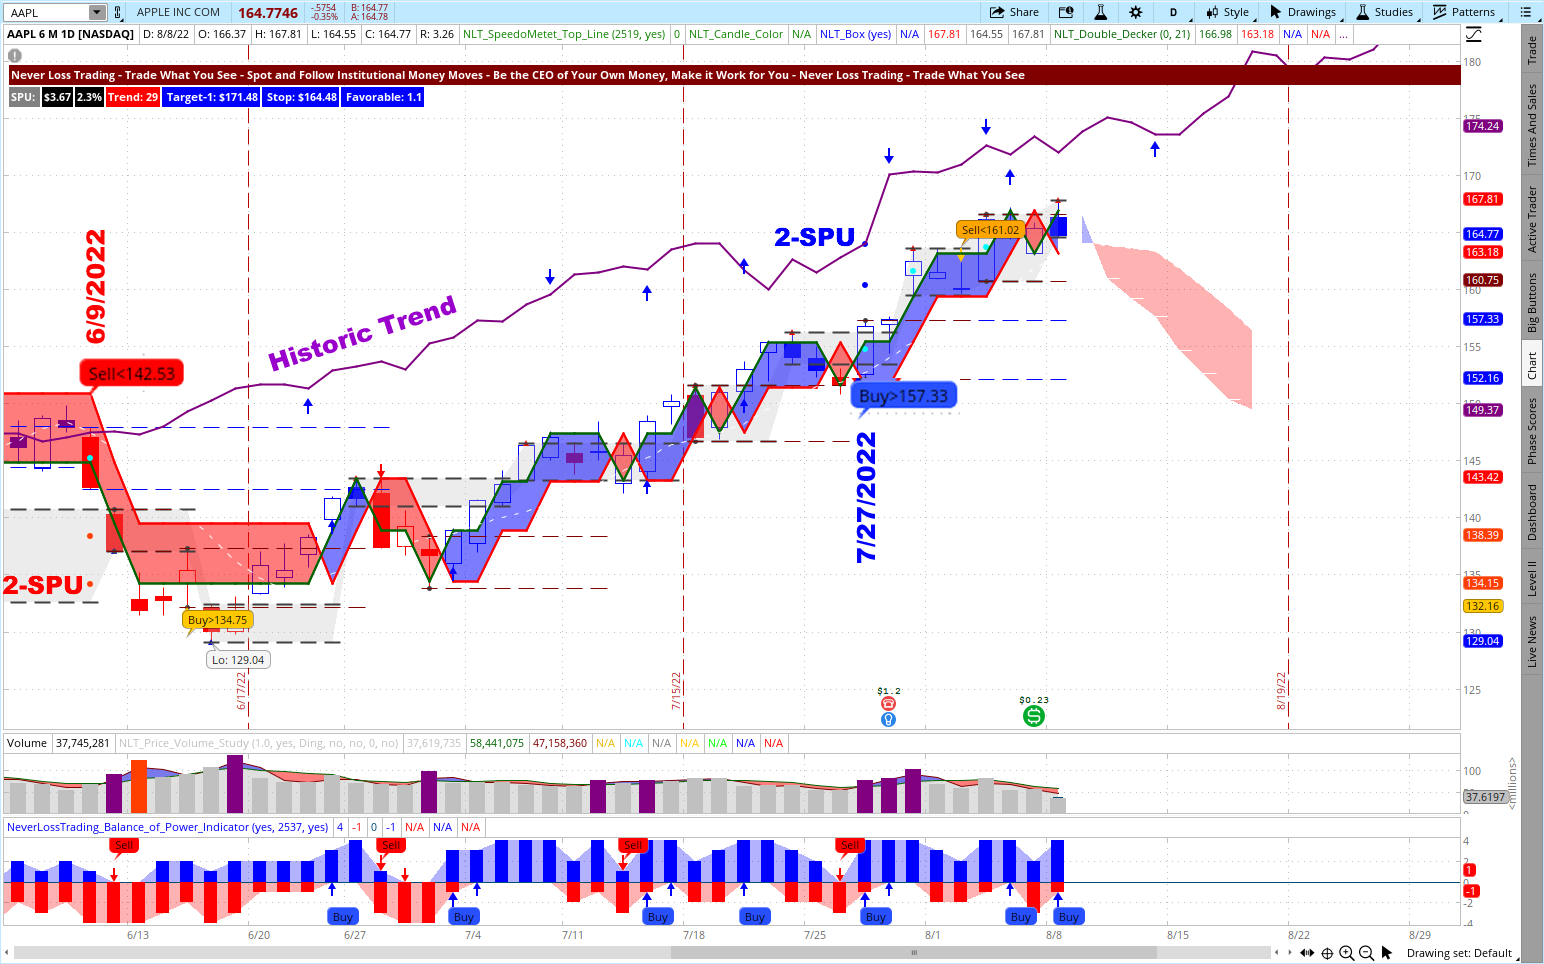
Next, we pick the stock of Apple Inc. to demonstrate how the NLT Top-Line indicators show crucial price turning points on daily charts:
AAPL Daily NLT Top-Line Chart June to August 2022
On the chart, we highlighted two solid trade situations: June 9, with a short signal, and July 27, 2022, with a long signal. The signal direction was confirmed in both cases, and the price development followed the historical trend. We printed a sign at the 2-SPU price level on the chart: this is where our system proposed to take profit.
In the day trading chart example, you see a signal combination that follows the NLT Timeless concept:
A system-defined price base forms each candle
Time is no critical element; only price change is tracked and defines entry and exit in a transaction.
We put a combination of NLT Top-Line, Trend Catching, and Timeless Indicators on the chart. Our focus is to look and act on two happenings, whatever comes first:
A sign that shows a floating print means the price is trading towards open space with less resistance
Signals showing a breakout sign signify that the price leaves a prior price containment
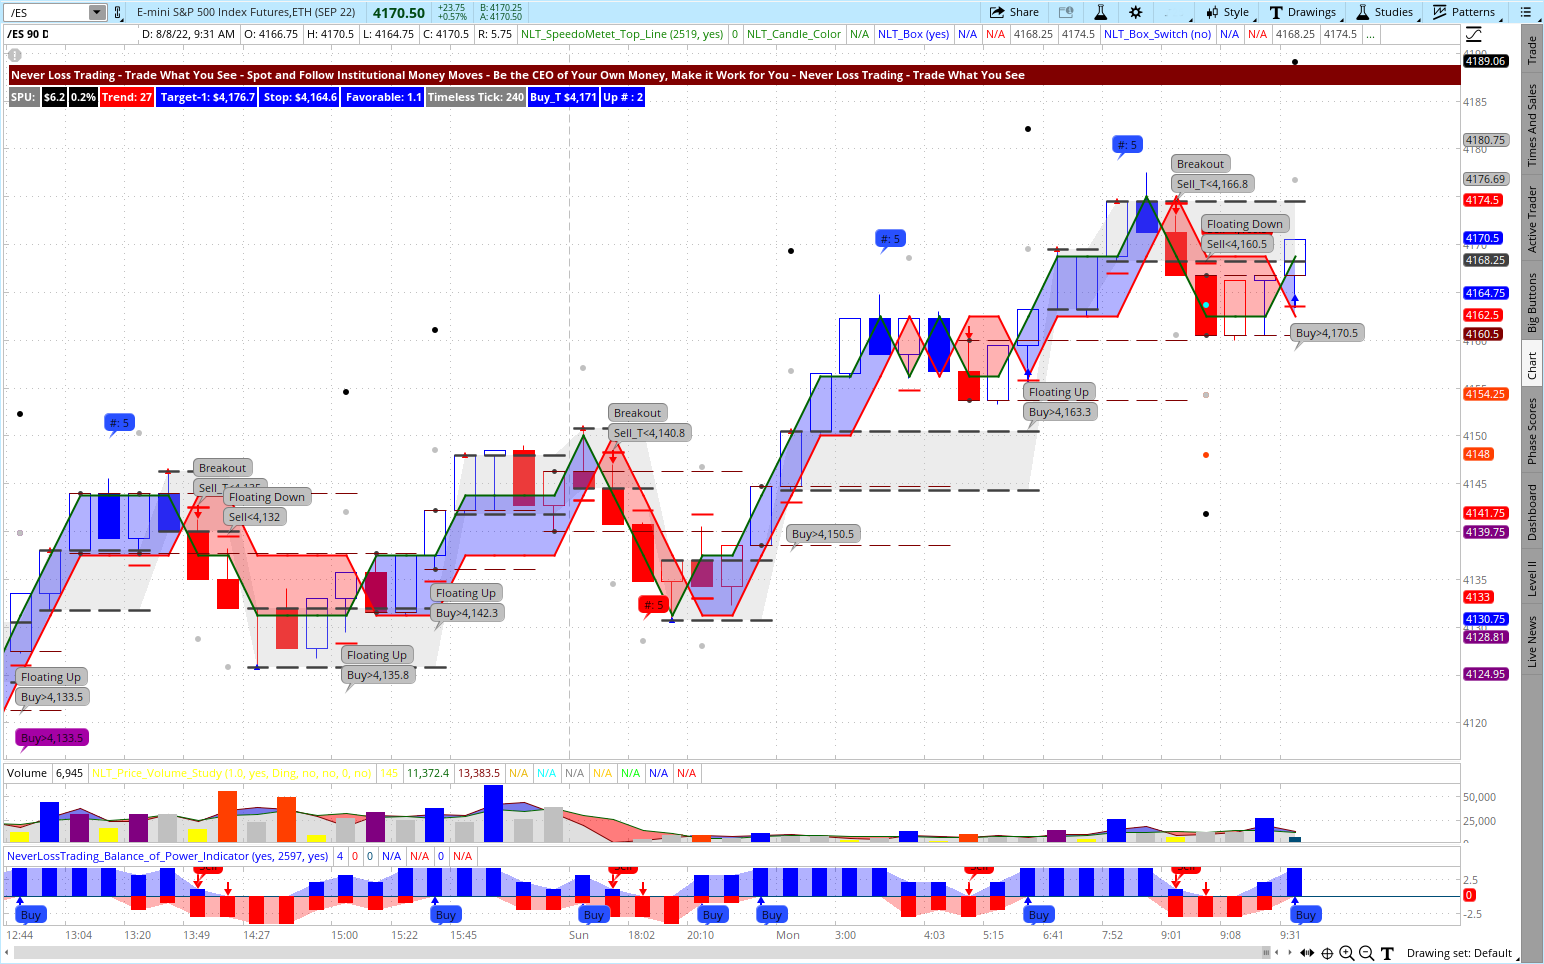
E-Mini S&P 500 Day Trading Chart August 5, 8, 2022
You see multiple signals and signal combinations, where we take a mechanical approach. Check the chart and find six price turning points to act on:
The dot on the chart is the exit
The red crossbar signifies the stop
When you are in a trade to target, disregard the same directional or opposite-facing signals
The system only prints signs where risk and reward are in balance with the system probability of having a positive expectation value
With the NLT Timeless concept, we help you put five trading decisions in one spot:
Acting on buy-signals above the set price threshold through buy-stop orders
Acting on sell signals below the set price threshold through sell-stop orders
NLT Timeless Trading is only one way of putting our systems into action. We work one-on-one with our clients and develop tailored strategies that fit your circumstances, wants and needs. To experience how our systems work in real-time, schedule an online meeting with us:
After sharing the importance of a solid system, let us bridge over to behavior:
Do not come to trading with a work attitude. Making money in trading requires an intelligent attitude: Cash in your profits and leave the risk to somebody else!
Prevent overtrading
Stick to a business plan for trading success: action plan (when to trade and when not), financial plan (how often to trade, what to expect).
We have over ten years in the trading education business, teaching one-on-one at your best available days and times.
Trading our own account day-by-day and helping clients lets us provide long-term experiences and support. Customer service and tailored mentorships are our virtue. Following this principle, we provide:
Server-installed Software
Real-Time Data
System-Defined Entries, Exits, and Stops
Position-Sizing
Time-in-a-Trade
Trading-Strategies
Risk-Handling
Business Plan (financial- and action plan)
Own scanners to find investment opportunities
Watch list indicators for finding changes in supply and demand on multiple time frames
Basing your trading and investing decisions on defined rules is learnable, and we are here to support you!
Schedule your consulting hour! Working one-on-one spots are extremely limited: Do not miss out!
Let us share an overview of learning elements to take away from our training and coaching sessions, which vary based on the system you choose, from four to twenty hours of teaching.
Summary of learning elements:
Acting with a system probability > 65%
Mechanical rules for entry, exit, stop
Trade at perfect moments only
Consider overall factors, patterns
Risk and reward in an acceptable balance
Risk-averse trading
Holding positions to target
Do not add to losers
Stick with a trading strategy. Follow a business plan – action plan and financial plan
Trade for meaningful price moves
Systematic trading
Having a mentor to learn from
To succeed in trading, you best work with an experienced coach and learn much about trading. Our #1 competitive advantage is the support and customer service we offer. We work one-on-one with you to specify what we teach to your specific wants and needs; hence, if your knowledge base is not expanding rapidly, you are doing something wrong.
Ongoing education and mentoring are crucial to longevity in this business.
Veteran traders have been through more ups and downs than you can imagine. So whatever you’re going through, experienced pros have probably experienced it already.
If you are ready to make a difference to your trading:
We are ready to share our experiences and help you build your trading business. Trading is not a typical career, and you best learn from those who are long-term in this business to cope with the rollercoaster of the financial markets. We are here to help and provide feedback on what you might be doing right or wrong.
Strive for improved trading results, and we will find out which of our systems suits you best.
We are happy to hear back from you,
Thomas Barmann (inventor and founder of NeverLossTrading)
Summary:Successful traders distinguish potential price moves that are random happenings from price moves that can be forecasted with a high probability. The science or art is in detecting signals and staying away from Noise.
More than 85% of all financial market transactions are institutional decision-based. Therefore, big money decides the direction and if a price-movement-initiation spotted is followed or countered. Hence, the market creates signal patterns that are detectable and predictable with a high probability. As a high probability situation, we specify a 65% or above predictability of the happenings to continue in the forecasted price direction.
Trade Signals, Not Noise
Let us take a signal transmission model: Filtering technology helps to detect the signal and filter out Noise. Even when a signal is distorted, models like the Hamming Distance help to identify the underlying movement and fill in what is missing to forecast the content to a specified target.
At this point, it might sound abstract; however, it builds a crucial part of our algorithmic trading systems with an AI component. For programming such a system, you first describe the natural happening, and such, we formulate some of the observations to take:
How do financial market transactions take place?
Who are the decision-makers, and what is the basis of their decisions?
How and when do price moves start and end?
Next is to find a mathematical model to replicate the actual market happening. Let me give you some examples:
We are assuming a Markov-Chain-Happening: forecastable action in a predictable frame of activities, instead of considering a Finetti relation of a random happening.
Mandelbrot iterations help us to consider the action of now: The result of each market action is used as the starting value for the next iteration. The values are checked during each iteration to see whether they have reached a critical “trade” condition or “bailout.” If a trade condition is found, the calculation is stopped, and a potential signal is drawn on the chart, spelling out the next price value to be reached and the statistical volatility to get to the examined target value without a high likelihood of getting stopped.
Filtering technology to express higher over lower likelihood happenings
Price expansion calculation and stop, considering the actual statistical volatility of the happening.
What we explain above and more happens in the background, and we wanted to invite you into our thinking. However, you do not need to understand and learn all this. Still, we wanted to express that simple moving average calculations, or similar iterations will never be able to provide high probability trade setups. So we calculated the difference between a model with a 55% probability to one of 65% and estimated the expected win rate of 10 trades by a Bernoulli experiment to win six or more trades out of ten. We explained how to put together an experiment with marbles, but let us take a shortcut here:
A 65% system gives you a 75% chance to predict and win six or more out of ten trades.
A 55% only gives you a 50.4% chance for six or more winners (random predictability).
You know now why we propagate high over low probability for retail traders.
We offer several systems: TradeColors.com is our beginner system and is included in all other systems. In this publication, we like to share a combination of NLT Top-Line, Trend Catching, and NLT Timeless Indications.
NLT Top-Line has multiple price charts and lower study indicators for trading at crucial price turning points:
Strong Price Turning Points: NLT Power Towers stand tall and point a direction (blue and red, buy> and sell<)
Tops and Bottoms: NLT Early Buy or Sell, pointing out more considerable directional price moves (orange buy>, sell<)
End of Purple Zone. We color up-moves in blue and down moves in red; when a time of ambiguity in price direction (purple buy> and sell <).
Strong money in our outflow, showing institutional engagement (lower study)
Correlated or uncorrelated to the overall market move (lower study)
Historical price projection to understand what others expect (upper and lower study)
and more
NLT Trend Catching differentiates
Trend Initiation Signals (gray buy > and sell <)
Trend Continuation Signals (gray Buy_C and Sell_C)
Balance of Power: Buyers or sellers in Charge (lower study)
Why to combine those systems?
For a higher participation rate: more trades and accuracy with indicators that take a different market cut by not being correlated.
NLT Timeless Day Trading Examples /ES
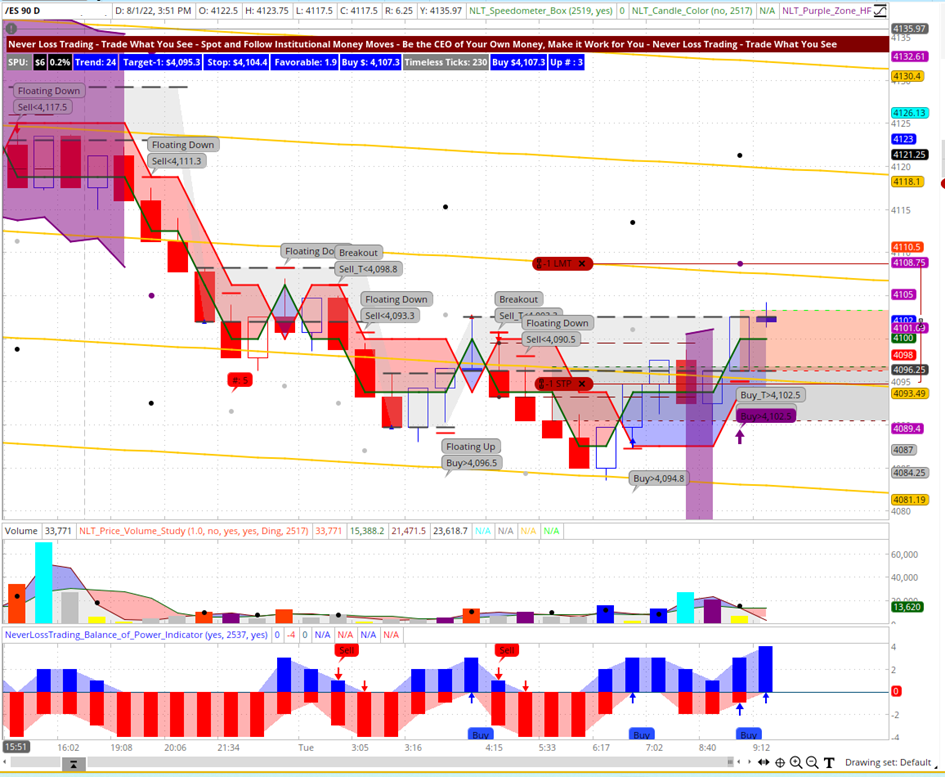
E-Mini S&P 500 on the NeverLossTrading Timeless Day Trading Chart
At the time of writing this Article: August 2, 2022, this was the chart situation on the NLT Timeless Chart (candles form price-based, not time-based). There are six trade situations to discuss:
We are taking a mechanical approach considering every opportunity when a signal appears on the chart.
The gray or purple dot on the chart specifies the target
The red crossbar is the stop
During your training, you will learn not to consider every situation painted on the chart. In this example, we accept all signals, with the condition to not enter, except for an opposite-facing candle signifying a new trade potential.
Situation-1: After a purple zone, indicating price ambiguity, and we do not consider signals, an end of NLT Purple Zone signal (NLT Top-Line), combined with an NLT Trend Catching signal announced a short potential that came to target two candles after entry: win.
Situation-2: NLT Trend Catching Signal: Sell_C<$4100.80, confirmed trend continuation entry to target (gray dot, reached in three candles): win.
Situation-3: Bottom reversal signal (and you will learn not to take this signal: in a downtrend, the first leg long is wrong!). However, we take a mechanical approach here: losing trade.
Situation-4: Short signal with a floating indication: Floating is part of the NLT Timeless Concept and specifies a situation where the price moves into open space and such has a high likelihood to come to the target: win.
Situation-5: Gray Buy signal that came to target.
Situation-6: End of Purple Zone buy signal, and at the time of writing this publication, the trade was open, but we took it, and it came to target: win.
Here is the trade entry photo of the account where we trade one /ES contract or never take an equity trade with a higher than $400 risk.
For day trading, we always operate with bracket buy-stop or sell-stop orders. The order is only filled when a pre-defined price level is reached and automatically stops and targets in place.
In our trading chart, we also consider price-volume happenings, and the colors on the volume bar tell a story of higher-level engagement on highlighted bars. The price-volume study is part of NLT Top-Line, and we run a summer special for the system combination, which we are happy to share with you in a demo.
Following specific rules in trading is essential, leaving only very little room for discretionary decisions. Very little interpretation:
Trade What You See!
Let the chart tell when to buy or sell!
By the way, the brand name NeverLossTrading does not promise never to lose a trade; it derives from the concept of trade repair and Never Stop Loss Trading was a bit lengthy.
The following example shows an NLT Timeless Swing Trading example:
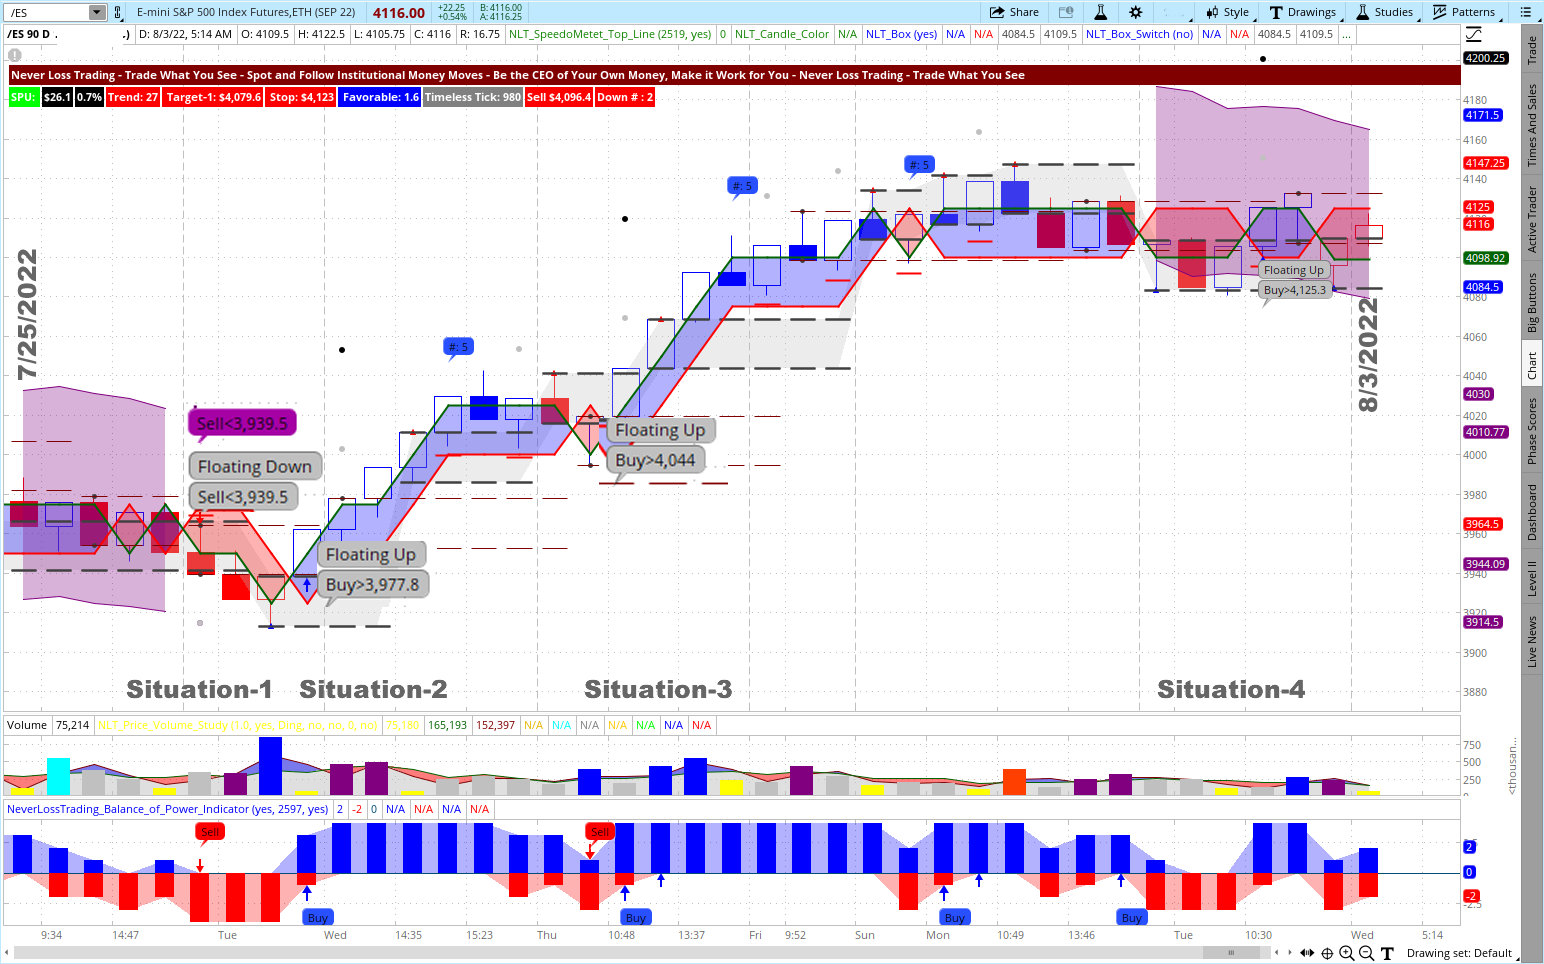
NeverLossTrading Timeless Swing Trading Chart
NLT Timeless Swing Trading Chart
The chart shows NLT trade indications between July 25 and August 3, 2022, describing four situations we now explain:
Situation-1: After directional price ambiguity, the NLT Top-Line End of Purple Zone signal and the NLT Trend Catching Sell signal pointed down, and the trade direction was confirmed and came to target by reaching the gray dot on the chart.
Situation-2: A bottom was found, the buy signal confirmed, and an upside trade was initiated. The first target was at the gray dot. If you want to trail your transaction, use the red line of the blue frame and exit at the black dot or 3-SPU level.
Situation-3: A trend-continuation signal after a short retracement and another uprun to target or to be trailed with the red line the black dot: 2-SPU level.
Situation-4: on August 1, 2022, an NLT Purple zone opened and told us not to initiate swing trades until it was over.
In our prior publication, we used the same chart with continuation signals switched on, and you will see more swing trading opportunities along with the price movement.
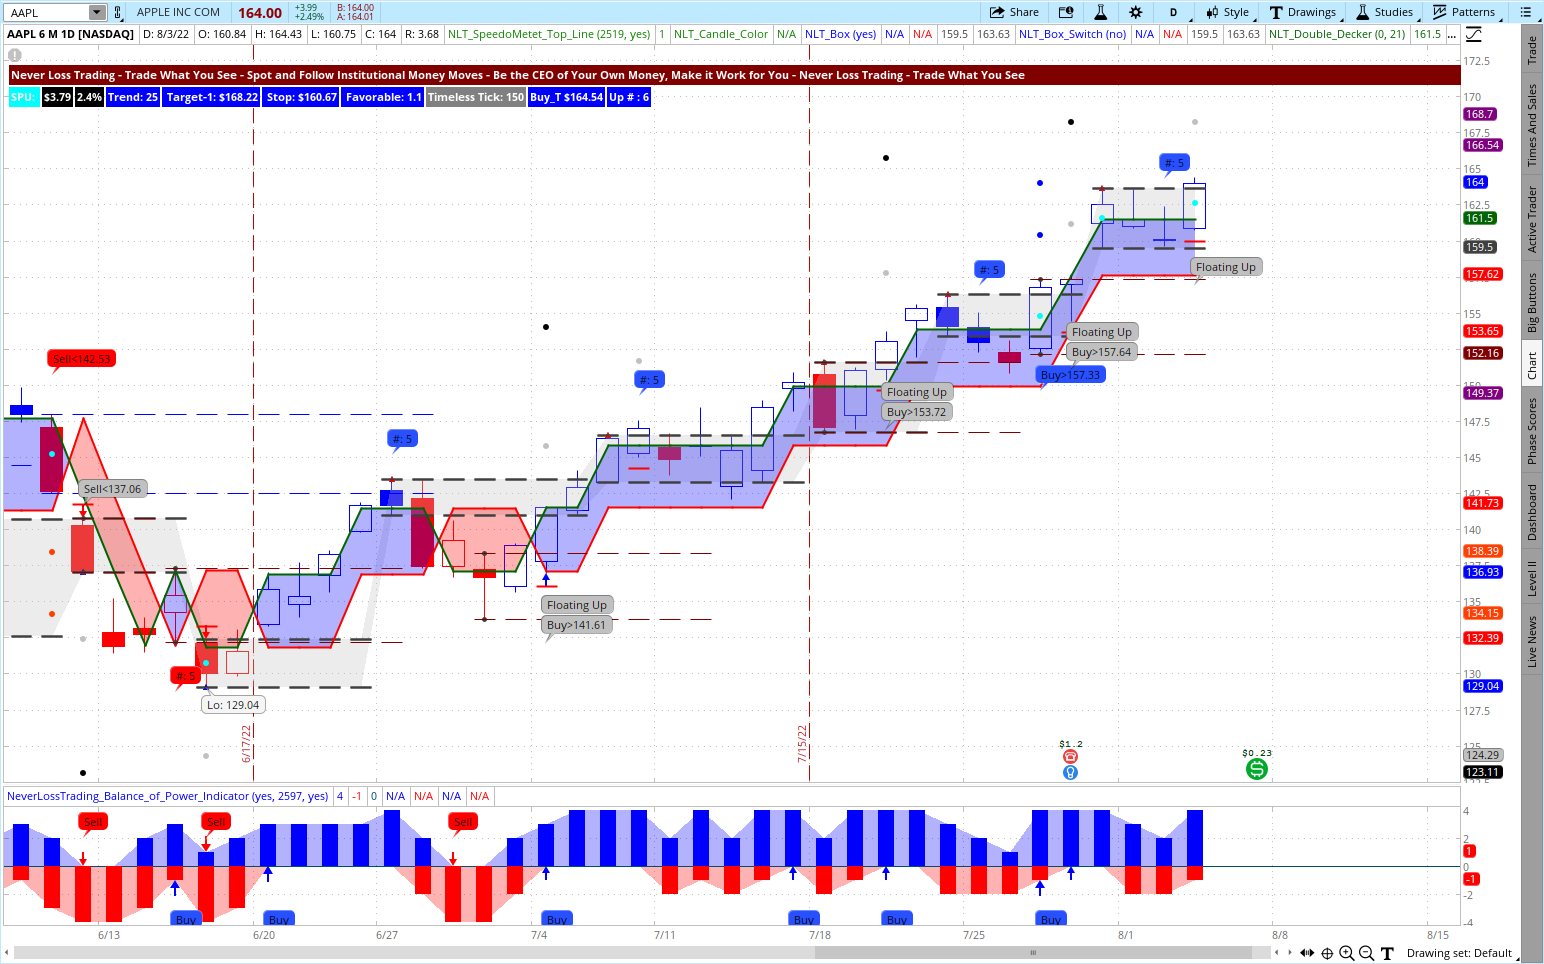
After the NLT Timeless examples, let us dive into time-based trading: We use the same indicators and pull up a price chart for Apple Corp. (AAPL) from June 8 to August 3, 2022.
Do you see four or potentially five trading opportunities (one short – sell signal in red – and three long opportunities – buy signals in gray and red)?
If yes, you understand what we mean by letting the chart tell when to buy or sell; if not, challenge us for a free demo:
AAPL Daily NLT Chart: NLT Top-Line and Trend Catching
The trade situation on the chart is not magnified, leaving it up to you to test what you see.
Only if you have a solid decision-making base, supported by a system that helps you to identify high probability trade setups, will you have the chance to trade for constant income from the financial markets as a time-based or timeless trader. You can learn both concepts in our mentorships and more.
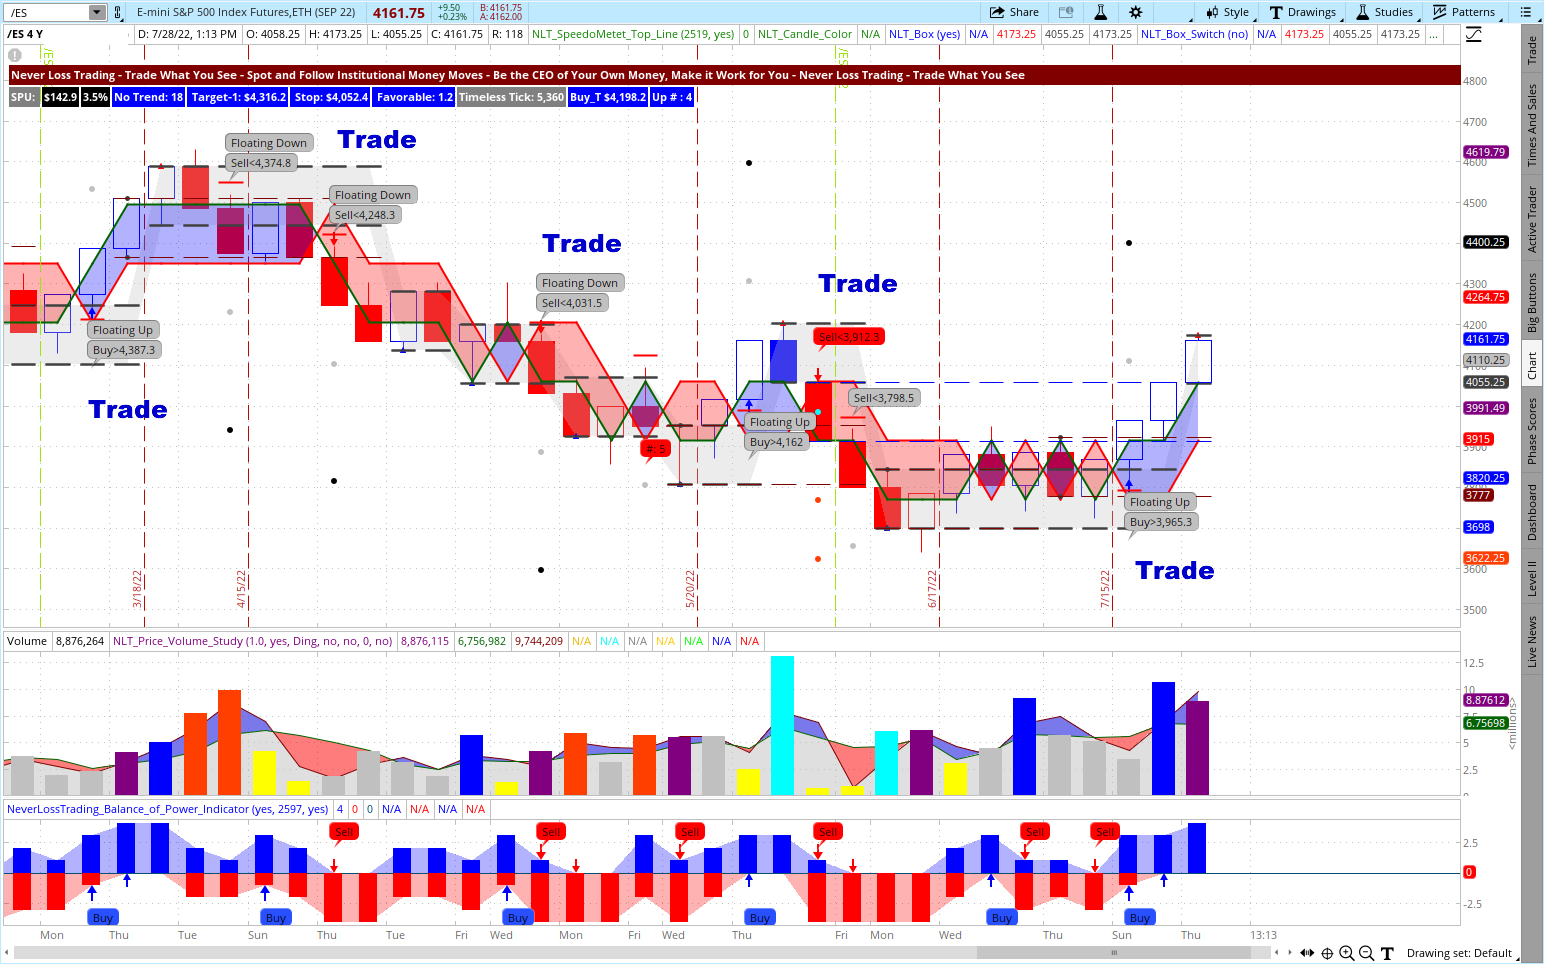
Here is a longer-term timeless chart, and please check yourself which situations to take:
NLT Timeless Longer-Term Chart March to August 5, 2022
NLT Longer-Term Timeless Chart
Even if you went long at the one trade we would never have taken, the chart would have given you five winning and one losing trade: we call high probability. Each trade was good for a price change of the underlying /ES futures contract of $7,500, with an associate risk, if you traded the /MES, 10% of it, $750.
We know and acknowledge that every trader is different. Hence, we tune our systems and teach to your specific wants and needs, supporting you to turn yourself into the trader or investor you want to be, teaching one-on-one at your best available days and times.
Let us share an overview of learning elements to take away from our training and coaching sessions, which vary based on the system you choose, from four to twenty hours of teaching.
Summary of learning elements:
Acting with a system probability > 65%
Mechanical rules for entry, exit, stop
Trade at perfect moments only
Consider overall factors, patterns
Risk and reward in an acceptable balance
Risk-averse trading
Holding positions to target
Do not add to losers
Stick with a trading strategy. Follow a business plan – action plan and financial plan
Trade for meaningful price moves
Systematic trading
Having a mentor to learn from
We also help you to journal your trades. Such a journal provides excellent feedback on how you are developing, and you find a perfect example in this article on our Blog: How to Control Your Trading Results
To succeed in trading, you best work with an experienced coach and learn much about trading. Our #1 competitive advantage is the support and customer service we offer. We work one-on-one with you to specify what we teach to your specific wants and needs; hence, if your knowledge base is not expanding rapidly, you are doing something wrong.
Ongoing education and mentoring are crucial to longevity in this business.
Veteran traders have been through more ups and downs than you can imagine. So whatever you’re going through, experienced pros have probably experienced it already.
If you are ready to make a difference to your trading:
We are ready to share our experiences and help you build your trading business. Trading is not a typical career, and you best learn from those who are long-term in this business to cope with the rollercoaster of the financial markets. We are here to help and provide feedback on what you might be doing right or wrong.
Strive for improved trading results, and we will find out which of our systems suits you best.
We are happy to hear back from you,
Thomas Barmann (inventor and founder of NeverLossTrading)