Spot and Trade Institutional Money Moves

Algorithmic Trading with Human Interaction for:

Day Traders, Swing Traders, Long-Term Investors

Showing posts with label SPY. Show all posts

Tuesday, December 27, 2016

Inertia in Trading

Newton's first law of motion - sometimes referred to as the law of inertia: An object at rest stays at rest and an object in motion stays in motion with the same speed and in the same direction unless acted upon by an unbalanced force.
nerwtons-las-graphic
Unfortunately, Newton’s law of inertia accounts for many traders and investors, who never progress to the next level; boxed into their own paradigms:
  • I only trade /ES Futures and SPY.
  • I am trading from a 1-minute chart.
  • I am only participating in upside opportunities by trading from an IRA.
  • I am not profitable, but I only trade 3:1 opportunities.
Unfortunately, it is our human nature to repeat behavior patterns; even so they did not lead to the desired results.
When at times, we are telling new students that one definition of insanity is:
“Doing the same over and over and expecting different results”.
When this is said, everybody has a good time and smiles, until realization kicks in:
  • Who is telling you that you can only trade /ES and SPY: Do those prices even move?
  • Why to consider a 1-minute time frame: You are trading in the middle of volatility, with the odds in your disfavor?
  • You can trade both strategies, long or short from any account; you just need to know the applicable trading strategies?
  • How do you know in advance a 3:1 opportunity arises; however, if this worked for you, why do we have a reason to talk?
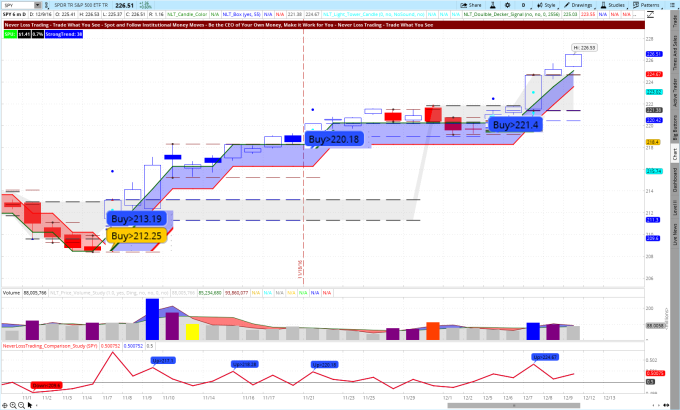
Did your system invite you recently to the following long opportunities?
SPY Daily NLT Top-Line Chart, November 1 – December 9, 2016
spy-november-1-to-december-9-nlt-top-line
In our mentorships, we teach you the details of how to enter with multiple trading strategies when the spelled out price threshold: Buy > $221.40 for example is surpassed in the candle following the signal candle. Why is that important?
You want to trade confirmed directions, where institutional leaders initiated a move and the market follows. This way you can work with buy-stop and sell-stop orders, allowing you to pre-program your orders without the need for sitting in front of your computer at trade entry and exit.
Take a look at the NeverLossTrading Price Move Model:
Price Move Expectation
How does it look at lower time frames?
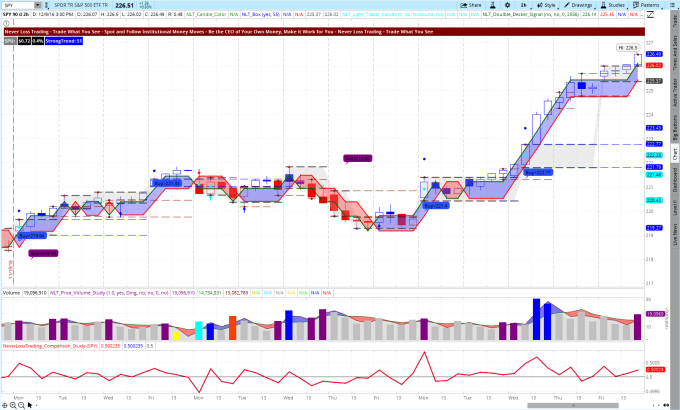
SPY 2-Hour NLT Top-Line Chart, November 18 – December 9, 2016
spy-2-hour-chart-november-18-to-december-9-2016
The 2-hour chart displayed five confirmed directional opportunities, four of those lead to the desired result and one to a stop: An 80% attainment rate.
Consider putting an end to your trading inertia:
  • Only those traders that are up for a change have a chance to make money.
  • You need to trade with clear cut rules at system specified entries, exits, and stop or adjustment levels.
  • Understand when and how to appraise the odds of every trade situation and only risk your money when the odds are in your favor.
  • Have a system, follow the system, and act upon multiple time-frames, multiple trading instruments and multiple trading strategies.
We are in the trading education business since 2008. With us, you have the pleasure to learn at your preferred days and times. Check our offering…click.
Find a system that suites your wants and needs and we are happy to organize a personal demonstration:
Call +1 866 455 4520 or contact@NeverLossTrading.com
Teaching one-on-one, spots are extremely limited, so do not miss out.
We are looking forward to hearing back from you,
Thomas

Wednesday, December 9, 2015

Market Timing

Market timing means buying and selling at the right price: This is exactly the business all institutional investors are in and why the financial markets progress in alternating prices.
Let us put this in action terms: You focus on a specific price at which you enter the market and pre-define where you want to exit.
If you feel, you are not yet predicting market prices or market timing to your satisfaction; you might want to consider using a system, which gives you high probability trade setups with defined entry and exit prices.
NeverLossTrading Top-Line Chart, SPY – Daily - November 9 – December 8, 2015
Top-Line SPY November 9 to December 8, 2015
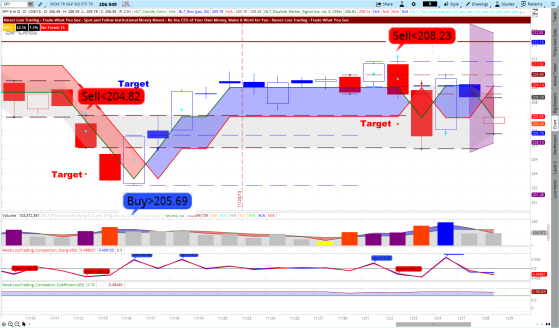
The above chart shows how our algorithmic-, activity based trading system defines price thresholds like Buy>$205.69; when this price threshold is surpassed in the next candle, we enter a trade with a buy-stop order and exit at the pre-defined target, highlighted on the chart.
In total, we had three winning trades on SPY, staying in a position between one and two days.
Check the chart again to recognize how important it was to exit at target: At both sell signals, the price immediately reversed after the target was reached: In this case perfect market timing on trade entry and exit.
Why did this work?
With our activity based trading system, you can spot and follow institutional money moves as a day trader, swing trader and long-term investor.
We teach one-on-one, how you can specifically apply our systems at your available time and for the assets you prefer to trade: Stocks, options, futures, FOREX.
Day Trading Example: NLT Top-Line, SPY 1-Hour Chart, December 2 – 4, 2015
Top-Line 1 Hour SPY December 2  to 4, 2015
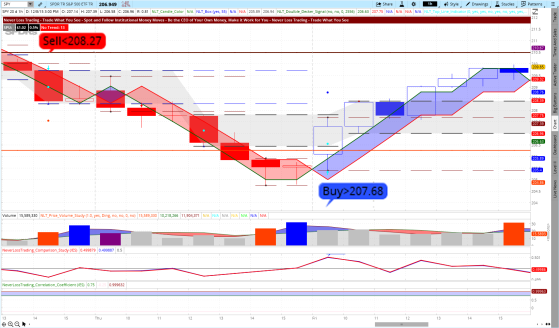
From left to right, you see a late in the day entry on Sell<$208.27 and a day trade that was closed the same day on Buy>$207.68.
Institutional supply and demand specifies the action we filter with our algorithms and paint the potential trade situation on the chart for you.
In case you trade from an IRA account, we show you how to participate in market downs with the help of trading options.
Our charts will help you to figure out where price will turn and where they most probably will go, considering major supply and demand levels, where you can expect institutional orders to drive the price in the one or the other direction:
A significant supply/demand imbalance turns the prices and our systems help you to spot and act on those instances.
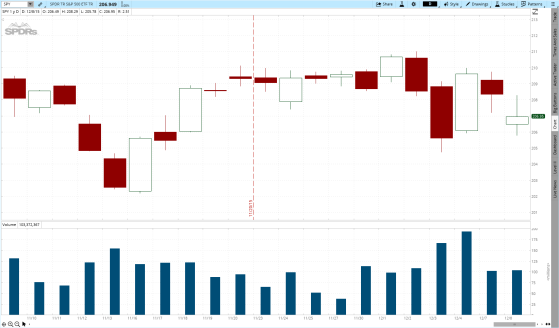
This is most likely how you would have seen the same situation on your chart:
SPY Daily Chart without Indicators, November 9 – December 12, 2015
SPY on a blank chart
No wonder, that it is hard to make sound trading decisions without a fact based proposition.
Make a difference to your trading and schedule your personal consulting hour to find out which of our systems suits you best:
Call: +1 866 455 4520 or contact@NeverLossTrading.com
If you are not already part of our free trading tips, market reports, and webinars, sign up here.
We are open for new students, capacities are limited, do not miss out.
We are looking forward to hearing back from you.
Good trading,
Thomas

Saturday, July 11, 2015

Trading in Times of Ambiguity

Since the end of January 2015, SPY, our leading indicator for the stock market, remains in the Purple Zone; expressing ambiguity: Institutional leaders give no clear sign for directional price moves.  
SPY Price Development 2015 (Weekly Chart)
SPY in Ambiguity 2015
However; we observe long weekly candles, which allow for shorter-term directional trades, while positioning trading is only advisable for assets with strong individual price moves. Independent individual movers on our watch list for next week are for example: AAL (however, DAL will declare earnings, which might have an impact), and EBAY.
As a consequence for next week, we favor 4-hour, 1-hour, 30-min and even 10-min trades over positioning trades.
Please build up your watch lists for stocks accordingly:
  • 4-hour trades from the last hour movers and long-term investor alerts, scans prior to 9 a.m. and 1 p.m. ET.
  • 1-hour trades from the last hour movers and the stock alert list.
On the side of Futures trading, we see market pressure at Stock Market Indexes, Bonds/Notes.
Currency traders, watch for moves in the AUD, JPY, and CND.
This question came to us: How important is the lower earnings declaration of AA (Alcoa) for the stock market development? Let us put the SPY (pink line) and Alcoa (red/blue line) on one chart:
SPY and Alcoa Price Development Compared on a Daily Chart
SPY and Alcoa July 2015
Since February of this year, Alcoa took and independent price move to the downside, which was not correlated with the overall stock market; hence, the influence of AA reporting 10% lower than expected earnings is not seen as significant for the price development of the overall stock market.
For your next week’s trading, please consider that a new earnings season just started. Hence, trade carefully and consider protecting long-term positions over earnings.
The financial markets have their complexity; however, we help you to de-complex them by focusing on spotting and following institutional money moves. If you like to learn how you can do this on your own, check our offering: http://NeverLossTrading.com and feel free to schedule your personal consulting hour:
Call +1 866 455 4520 or contact@NeverLossTrading.com
If you are not yet part of our trading tips and free webinars, please sign up here and we keep you up-to-date….sign up here.
We are looking forward to hearing back from you,
Good trading,

Saturday, May 30, 2015

Short- versus Long-Term Trading

Dear Fellow Trader,
Actual topics for June 2015:
  1. Watch our feature presentation: Activity Based Trading Success at http://tradersworldonlineexpo.com/ Experience why following institutional footsteps and protecting your trades are key essentials for your trading success. Just register and you get access to 20 presentations. 
  1. Status of the Market and Trade Focus: Short- versus Long-Term Trading
Why is currently long-term positioning trading more difficult and what to do as a trader?
Let us check the S&P 500 as the core market index for stocks on a weekly chart and it shows that the US-stock-markets are in a Purple Zone (time period of directional ambiguity) since the end of January. So far we had no close of a candle outside the price containment area set in the week of December 15, 2014. Yes, we pointed a new high, but closed the week right inside the price containment area.
SPY Weekly Chart 2014 to YTD
SPY 2015
What to do?
Rather trade shorter-term!
Swing Trades: Expect to be in the trade 1-5 days
From daily charts, focus on stocks that make an independent move (check your NLT Correlation Coefficient, a NLT Top-Line lower study ). By the current cyclic nature of the market, for every swing trade you start, prepare to apply trade adjustment methods rather than taking stops. Here is a calculation example what this will do to your trading. The following example is calculated on a 60% win rate and compares methods of reducing the risk to half and eliminating the risk by applying trade adjustment methods, we teach in our mentorships.
Trade Adjustment Methods Calculated
Further actions:
  • Trade from the 4-Hour chart, when weekly signals are surpassed.
  • Build a 4-Hour Watch List by weekly signals and trade confirmed signals

Day Trades: Your premier focus for the time being.
  • Trade from the 1-Hour chart when daily signals are surpassed.
  • Produce a 1-Hour Watch List from daily signals and trade confirmed 10 a.m. onward signals.
  • Use your 10-Minute trading strategies for strong NLT Pre-Market Movers Alerts and the NLT HF Trading Alerts.
The NLT Alerts provide you with selected assets, with ready to trade setups. Select an Alert of your choice, write us an email and receive it Free for 1-Week: contact@NeverLossTrading.com
Experience how NeverLossTrading works live: Schedule your personal consulting hour:
Call +1 866 455 4520 or contact@NeverLossTrading.com
If you are not yet part of our trading tips and free webinars, please sign up here and we keep you up-to-date….sign up here.
We are looking forward to hearing back from you,
Good trading,
Thomas

Saturday, August 23, 2014

How to Trade with the Odds in Your Favor


Many private traders like the exciting environment of trading the financial markets. Trading can be a wonderful hobby. For hobbies, we like to spend money and this is usually what happens; however, if you want to take trading and investing serious, you need to start being a probability thinker: Understanding how probable it is for you in a string of investments to make money following clearly defined trading or investing guidelines.
What are your odds of making money?
Before we help you to answer this question, let us reiterate some prerequisites of trading success:
  • Have a system.
  • Be disciplines and follow the system.
  • Trade only, when the odds are in your favor
Example: NeverLossTrading Top Line Chart for FAS

At this NeverLossTrading example, you only trade when the price development of the candle following the trade initiation candle (situations marked with numbers) surpasses the spelled out price threshold: Buy>$101.10 for example. Summary: The price of the next candle has to move higher to validate the entry proposal. The trade target is pre-calculated and either marked with a dot on the chart or by a horizontal NLT Price Gravitation Line. The red line on the chart: NLT Double Decker Line allows for trailing your stop.
To calculate or evaluate the odds of the trade situation, we run a quick appraisal for the three trade situations, which all have a high probability trade setup at the chart constellation:
Situation-1: Risky, by having a substantially higher risk than reward: Stop at the high of the candle.
Situaiton-2: Favorable setup. Stop at the low of the candle, with a higher reward than risk.
Situaiton-3: Favorable setup. Stop at the low of the candle, with a higher reward than risk.
However, if your trading system does not portrait entries, exits, and stops, what do you do?
A simple way of calculating the odds of a trade setup is:
Probability of the Trade Setup (past performance) x Reward / (Risk x Probability of Failing)
At this point, note the Golden Rule of Trading Success:
The factor of this calculation shall be above 1.5-points.
Example-1: Probability for success of the trade setup (from history): 65%, with a risk of $1 and a reward of $1. The calculated factor comes to 1.94; thus, it is above 1.5 and tells you that you found a trade setup where the odds in your favor according to our Golden Rule. 
Example-2: Probability for the trade setup: 58%, with a risk of $1 and a reward of $1. The calculated factor comes to 1.38 and is below 1.5 telling you that the odds of the trade setup evaluated are NOT in your favor.
When it is that easy, why do most private investors fail to achieve their financial goals?
Our answer: Most private investors or traders use trading systems, which are either random or produce a probability for success between 53% - 57% where the factor < 1.5.  Examples are:
  • Moving average based indicators: MACD, Bollinger Bands, RSI, CCI...
  • Candle setups: Doji, Harami, Hangman…
  • Long-term patterns: Head and Shoulder, Cup and Handle…
We tested and programmed all of those setups and many others. For traders who sign up for our program, we always offer to parallel-program the trade situation, you based your decision on and then we compare.
In addition, most standard indicators are lagging and propose entries when the major price move is close to over; providing you a trade-setup where the risk is mostly higher than the reward; bringing you into a circle-of-doom-pattern:  Small gain, small gain, big loss.
This is where NeverLossTrading systems make a difference.
1.    You trade at major swing points of institutional supply and demand shifts.

E-Mini S&P 500 Daily Chart with NLT Top-Line Indicators


2.    By the support of calculation tables, you get your trade situation appraised, calculating the likelihood for success, potential risk and reward, with a proposal for the position sizing.
NeverLossTrading Evaluation Model


3.    Critical for the private investor is to know about trading opportunities. Choosing from 40,000 US-traded stocks is not easy. With NeverLossTrading, you can always stay engaged in the market, by either scanning the for favorable trade setups, using NLT Top-Line integrated market scanners or by subscribing to the NLT Alerts (free for three months with a mentorship).
Scan for Your Trading Opportunities or Subscribe to our NLT Alert Service

In the NeverLossTrading Mentorship, you further experience:
  • Individual training units, fit to your personal wants and needs (all recorded)
  • 200-page documentation for easy access to key information.
  • Six month of mentorship with trade feedback and further education.
  • All software installed for you. The license fee paid off with the initial tuition.
  • Real time data on a server based programming, available from every computer.
  • Data feed from a free platform with no need to change your broker relationships.
  • ...
All for helping you to develop yourself into the trader, you want to be!
Several NeverLossTrading Mentorships are offered, which support Day Traders, Swing Traders, and Long-Term Investors.
Take the chance and test us live. Schedule a free consulting hour, where we get together online with you, share our screens and answer your questions:
Call: +1 866 455 4520
In case you are not yet subscribed to our free trading tips and market reports, sign up here:
Please always consider the risk of trading and that past performance cannot be taken indicative for future results.
Good trading,
Thomas

Saturday, June 21, 2014

Three Months Stock Market Outlook to October 2014


The stock markets remain strong and upwards grinding. The VIX, the Chicago Board Options Exchange Market Volatility Index, a measure of the implied volatility of S&P 500 index options, is grinding towards the 10 year low level of $9.39, which we had in December of 2006.
Let us take a look how VIX on an NLT-Chart with multiple indicators:


The chart shows: 

  • VIX on a six month low.
  • A major resistance area at a VIX level of $12.80 to $13.80
  • Key turning points were indicated by NLT Signals
  • The historic line for July expects rather a VIX drop.

Let us take a look, how the markets behaved in in July of 2006 forward to find which indicators helped us the most to find key turning points: 

Chart observation:

  • Key turning points happen at NLT Light Tower Signals.
  • Dark Green signals allow for a potential early entry, however, key support and resistance levels of NLT Box Lines and Purple Zones need to be respected.
  • Swing points show highlighted institutional volume bars.
  • After a stronger move, we find a period of sideways grinding market prices.
  • When NLT Price Breakout Zones are surpassed (Cyan Zone), trends develop, until they are passed whip saw price action is dominant. 
 Back to today’s SPY chart:


Chart summary:

  • SPY is way above the historic trend.
  • When the Cyan Zone was left, as strong trend developed and a new cyan zone was not formed yet.
  • When you compare peak and valley of the historic curve, you see that we are entering into a period of strength as we did it in 2006.
Trade Summary:
Trade for shorter time frames now and catch trends-in-the-trend and position trade when the next major NLT Light Tower move occurs. 

Our charts have lots of information, in particular, when overlaying three trading systems as in the chart above. What you see is: 
NLT Top-Line: Blue, red and orange signals.
NLT HF-Trading: Dark-Green and light-green signals.
NLT Price-Breakout-Zone: Cyan color zone. 
Each of those systems can be traded independent, while our professional traders prefer to us them all an added them sequential. 

If you want to learn trading with our high probability system, schedule a personal consulting hour:
contact@NeverLossTrading.com or call +1 866 455 4520

To receive our FREE trading tips subscribe: http://www.neverlosstrading.com/Reports/FreeReports.html 

Good trading,

Thomas