
On March 22, 2021, we already reported the tight correlation of the worldwide stock markets…check our article. In our day-to-day comparison, we usually use the DAX; however, equities are not trading today in Germany due to a holiday.
Our correlation study shows a 74% correlation between the Nikkei and the S&P 500 development. Such, the Nikkei 225 functions as a potential forerunner for the S&P 500. By opening 12 hours ahead of Wallstreet, the Nikkei 225 is about 1.33-times more volatile than the S&P 500

The New York Stock Exchange (NYSE) and the NASDAQ are the largest stock exchange operators worldwide, accounting for 56% of the world’s stock value exchanged.
Nikkei 225 and US Exchanges Compared (1/2021, trill. USD)
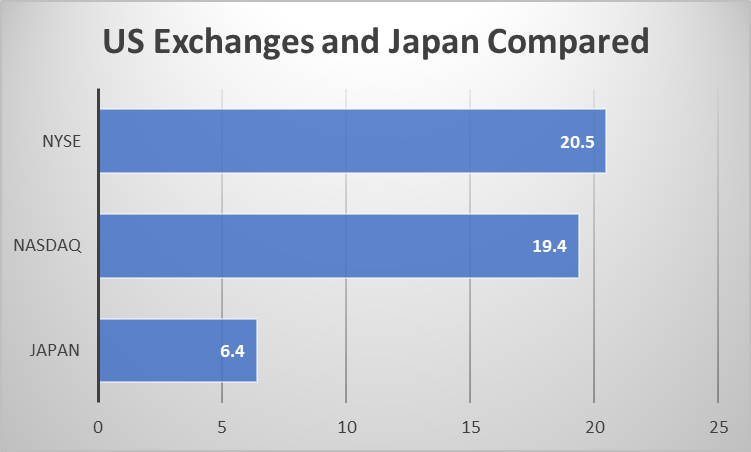
With shares in the value of 6.4 trillion dollars exchanged the Japan stock exchange ranks the closest in size to the US exchanges. For building a correlation, we compare the sector share of the Nikkei 225 and the S&P 500.

The comparison graph shows similarity, where the major differences show in the sectors of Industry, Energy, Financials, and Consumer Discr.
Listing the Top-Ten Companies in the Nikkei 225, we see the following:
| Company | Sector | Share (%) |
| FAST RETAILING LTD | Consumer Discr. | 10,71 |
| SOFTBANK GROUP CORP | Communication | 6,86 |
| TOKYO ELECTRON LTD | IT | 5,96 |
| FANUC CORP | Industry | 3,35 |
| DAIKIN INDUSTRIES LTD | Industry | 2,74 |
| KDDI CORP | Communication | 2,51 |
| ADVANTEST CORP | IT | 2,46 |
| M3 INC | Health Care | 2,35 |
| SHIN ETSU CHEMICAL LTD | Materials | 2,30 |
| TERUMO CORP | Health Care | 1,95 |
Nikkei and S&P 500 Six-Months Compared

This week, the FOMC meeting with minutes at 2 p.m. Wednesday might hold the markets back until we get feedback from the FED about the monetary policy and economic outlook. Hence, we focus on shorter-term opportunities indicated by the NLT Timeless Trading Concept, where we simplify life for you, letting the chart will tell when to buy or sell!
Here an example:
E-Mini S&P 500 NLT Timeless Chart April 1 to 5, 2021

The system highlighted multiple long-trading opportunities along with the price move on April 1, 2021. At 6 a.m. ET, our NLT Top-Line shows a Purple Zone: a sign of directional price ambiguity.
Each confirmed trading opportunity stood for a price change of about $450 of the underlying Futures contract. Our charts display on thinkorswim of TD Ameritrade, while most of our day traders execute orders on Ninja Trader due to favorable margins associations.
Let us be your guide to a consistent trader and investor and schedule a free consulting session, where you can see live what our systems can do for you:
contact@NeverLossTrading.com Subj: Consulting Hour
Working one-on-one spots are extremely limited: Do not miss out!
For more of our free publications and webinars…sign up here.
We are looking forward to hearing back from you.
Disclaimer, Terms and Conditions, Privacy | Customer Support

No comments:
Post a Comment