Research Results
In the dynamic realm of financial markets, traders continuously seek reliable indicators to navigate the complexities and uncertainties. Among the myriad tools available, NLT signals stand out by their purported ability to provide actionable insights into market movements. Retail traders primarily use futures as day trading instruments, and we invite you to consider long-term trading them with high yield expectations.

This article delves into the power of combining NLT Top-Line and NLT SwingPower (our newest development) for a higher participation rate in longer-term directional price moves of futures contracts, and we document the mechanical performance of trading signals when confirmed.
- NLT Top-Line highlights crucial price turning points early at momentum changes.
- NLT SwingPower recognizes changes in the frequency of transactions, often preceding a solid directional price move and extrapolating a price move forecast.
In our research, we investigate the trading performance of weekly chart signals.
Methodology
At NeverLossTrading (NLT), we favor eight futures contracts most friendly for retail traders based on their volume (number of contracts exchanged per day), volatility, and accessibility. In addition, we check that they are independent and not correlated movers.
NLT Favored Futures for Retail Traders

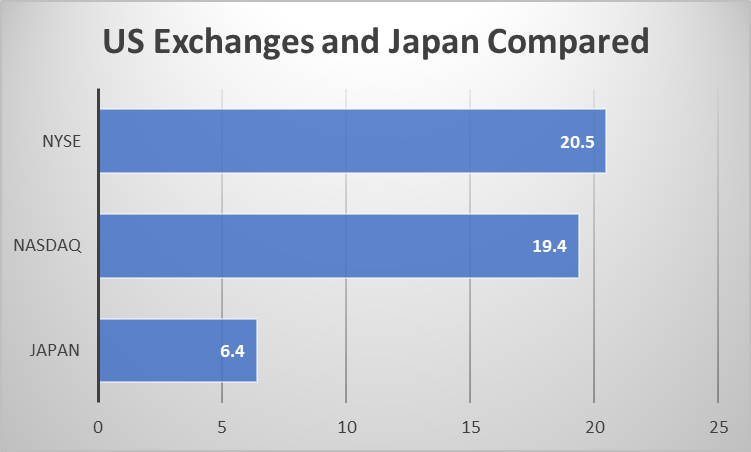
With their inherent leverage, futures offer the potential for remarkable returns, enticing traders with the promise of substantial profits. However, this allure comes hand in hand with significant risk, especially when trades do not unfold as anticipated. The table vividly illustrates the broad spectrum of return expectations, ranging from an impressive 38% to a staggering 67%.
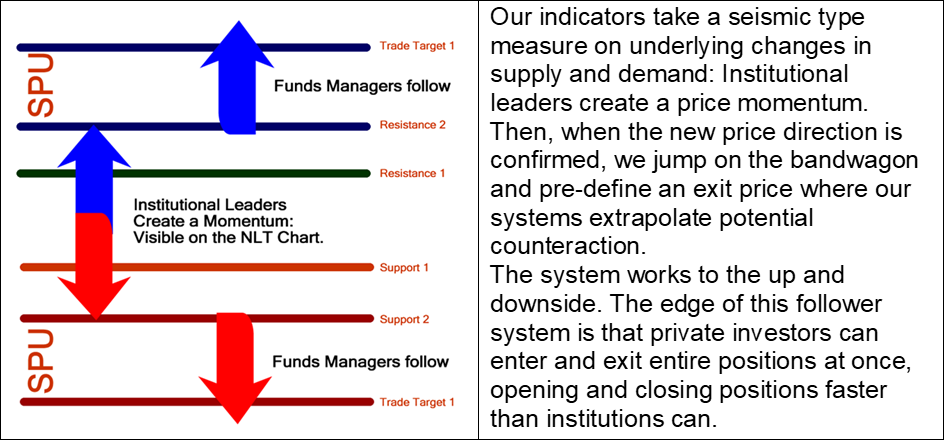
By the NLT concept, we are extrapolating potential price moves as SPU (Speed Unit) and briefly explain how we let the system forecast or extrapolate price moves after signal confirmation (price threshold surpassed in the price movement of the next candle).
NLT SPU Move Model

The basis of the NLT SPU Move Model derives from:
Basis of the NLT SPU Move Model
In the next step, we will document the results of NLT Trade Indications for the past twelve months, charting our favored Futures contracts. Simplifying the process, we accept signals mechanically, not applying the rules you will learn during our one-on-one mentorship, where we focus on your specific wants and needs.
Next, we analyze the past year’s results and are almost ashamed of the highly positive results documented.
Analysis of Confirmed Signals
Each NLT signal spells out a price threshold: Buy > or Sell <; The next candle’s price movement must tick out the set price threshold; otherwise, we will ignore it. Dots on the charts are exit points.
On our list of preferred futures contracts, we reference ETFs you can trade if Futures are not your favorite instruments or in addition to the NLT Delta Force Options Trading Concept.
Examples of Confirmed and not Confirmed Signals

After an in-depth chart analysis, we let the chart decide when to buy or sell, and we documented mechanical trading results, accepting each confirmed signal.
NLT Signal Performance
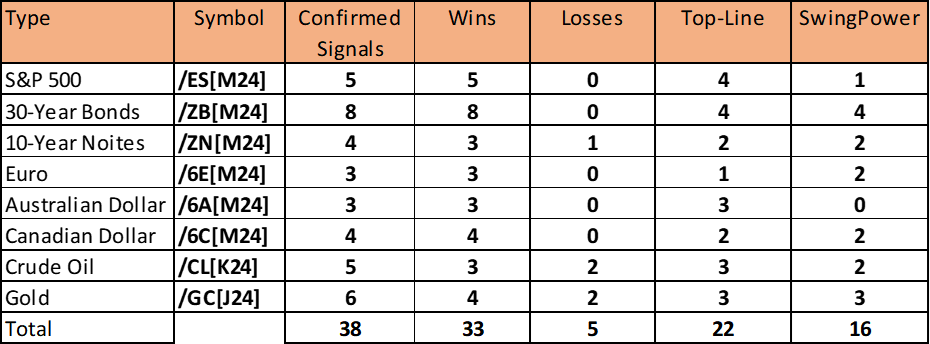
In addition, we check for correlated price move happenings and uncorrelated ones to document the following results:
Week of the Confirmed NLT Signal

In summary:
- 23 independent confirmed trading opportunities
- Six happenings with more than one symbol triggered confirmed buying or selling opportunities:
- 5/15/2023 (/ZB and /CL)
- 7/24/2023 (/ZB, /ZN, /6E)
- 9/25/2023 (/ZB, /GC)
- 10/16/2023 (/6E, /6C)
- 10/30/2023 (/ES, /ZB, /6C)
- 11/27/2023 (/ZN, /GC)
- Twenty-nine trading opportunities in a one-year time frame: 2.4 trades per month
- The holding time of open positions varied between one and ten weeks, with an average of about three weeks for open positions.
Considering the high ROI rates (38% to 67%) inherent in longer-term futures trading, those instruments offer an excellent investment opportunity for retail traders. By trading six days a week around the clock, they allow for fully automated trading, triggering at the system-set target or stop with a broker that allows you GTC orders (good till canceled). Next, we share the charts for researching these highly independent trading instruments.
If you prefer stock options trading, we referenced the best choice underlying in our table, like SPY about the E-Mini S&P 500 futures contract. We then help you to identify with the NLT Delta Force Concept:
- The strike price to choose.
- The time to options expiration to select
- The maximum premium to pay or to apply a different options trading strategy like a credit or debit spread, with the minimum premium to receive or the maximum premium to pay.
Whatever instrument you choose, here are the charts and NLT indications to base your decisions on:
Trade What You See, Let the Chart Tell When To Buy or Sell!
E-Mini S&P 500 Futures Conctract

30 Years Bond Futures

10 Year Notes Futures

Euro Futures

Australian Dollar Futures

Canadian Dolla Futures

Crude Oil Futures

Gold Contract Futures

Conclusion
In conclusion, our comprehensive analysis integrating the NLT SwingPower signal with the NLT Top-Line on weekly charts has yielded compelling results.
We are offering the two systems together in a bundle deal and are happy to demonstrate live how they perform:
Contact: contact@NeverLossTrading.com Sub.: Demo
All our teaching and coaching is one-on-one; hence, spots are limited, and you do not want to miss out.
We are looking forward to hearing back from you,
Thomas
Disclaimer, Terms and Conditions, Privacy | Customer Support