
Summary: Day trading is an excellent concept of creating constant income from the financial markets. We share systems and systematics with you that allow trading with mechanical rules at risk/reward setups that put the odds in your favor: read on and watch the video.
For more than ten years in the trading and education business, one thing is sure: trading is not easy but learnable. Unfortunately, however, many experienced and new traders never put the right skills in their knowledge portfolio and struggle to be consistently profitable.

US regulations do not require brokers to publish the win or loss rate of retail traders. We are an algorithmic trading house, and such decide on numbers and quantifiable instances rather than assumptions. To come to a measurable answer to the question of the average win rate of retail traders, we made a little excursion: European brokerages that offer leveraged products like CFDs need to report their clients’ success rate.
The frightening issue: 76% of the short-term traders are losing money.
Instead of explaining how we come to this number, we invite you to receive our study by emailing us: contact@NeverLossTrading.com Subj. 76%.
How can you turn trading into a successful endeavor?
First and foremost, be open-minded to learn what works and what does not—learning to trade is a question of mindset. Let us share some of our experiences:
- Traders Want to Trade the Way They Want to Trade
If you are not profitable, why do you insist of:
- I trade from a one minute chart (let the system decide time or timeless charts)
- I am trading for $100 price moves (consider minimum return on investments)
- I trade after 10 a.m. (let the chart tell when to buy or sell)
We sure could add to the list, but it is evident that most traders are not ready for a change.
“If you do the same over, why do you expect a different result?”
The problem is that even the worst traders have winning trades and are making themselves feel like they are on the right path. Hence; unsuccessful traders celebrate their winners and disregard facts like:
- Losers weigh bigger than winners
- Winners are infrequent
- No documented average weekly/monthly results
- Lack of a system to follow repetitive and sound decisions
There is a psychological reason for this: cognitive dissonances. Humankind needs to justify past actions to not live in a contradiction and discomfort of having done wrong. Leon Festinger, the famous psychologist of the subject matter, argued that some people would inevitably resolve the discomfort by blindly believing whatever they wanted to believe. Hence, only if you rationalize the need for change and reach out for it will you manage the discomfort of not being profitable. The other choice is to avoid the issue by giving up trading. Not being profitable is a measurable fact, and there are only two choices to get out of the dilemma.
2. Traders do not Consider Probability
Successful traders act on pre-defined happenings; like sports pros, they know in which position they will have a high probability to score.
Many, who come to trading, enter this profession with a work attitude: They want to trade frequently and work hard on many opportunities during the day. Being a getting-it-done person is super for running a business or as a general work attitude; however, in trading, you need to be ready when your trading instrument gives you the perfect spot for scoring. Let us provide a basketball analogy: When you constantly throw from a 60 to 80 feet distance, you cannot expect your team to win. But indeed, a grand celebration, when one or the other throw scores!
Hence, you need a systematic or system that tells you when high probability trade setups are on the brink, and you need the skill to score.
High Probability Setups come from the system you use; however, most traders do not know that they trade with a low probability system or track performance to reach consistency.
Scoring skills are not a given either; they need to be trained and learned:
- Order execution (buy-stop or sell-stop bracket orders, for example)
- Stop setting, for bringing the trade to target in the natural volatility of the instrument and still consider risk/reward relations of the setup
- Leaving the trade alone after it is executed. Let the system set the target and stop: Floating targets and stops support the pattern of small winners and big losers.
We could elaborate on this, but change is inevitable when you are not a consistent trader yet.
3. The Solution
Success has a structure, and we dissect the critical elements of trading and investing success and want to share some examples, and you decide if this is doable for you or you rather stay where you are today:
- Work with mechanical rules on clearly spelled out price thresholds for entry, exit, and stop.
- Use a high probability trading system back-tested for more than 65% of winners.
- Price change results from a shift in supply and demand; hence, let your system and chart tell when to buy or sell!
- Work at setups where risk and reward constellations put the odds in your favor.
Let us pick two day-trading examples for futures and stock trading:
NLT Timeless Trend Catching for the E-Mini S&P 500 Futures Contract
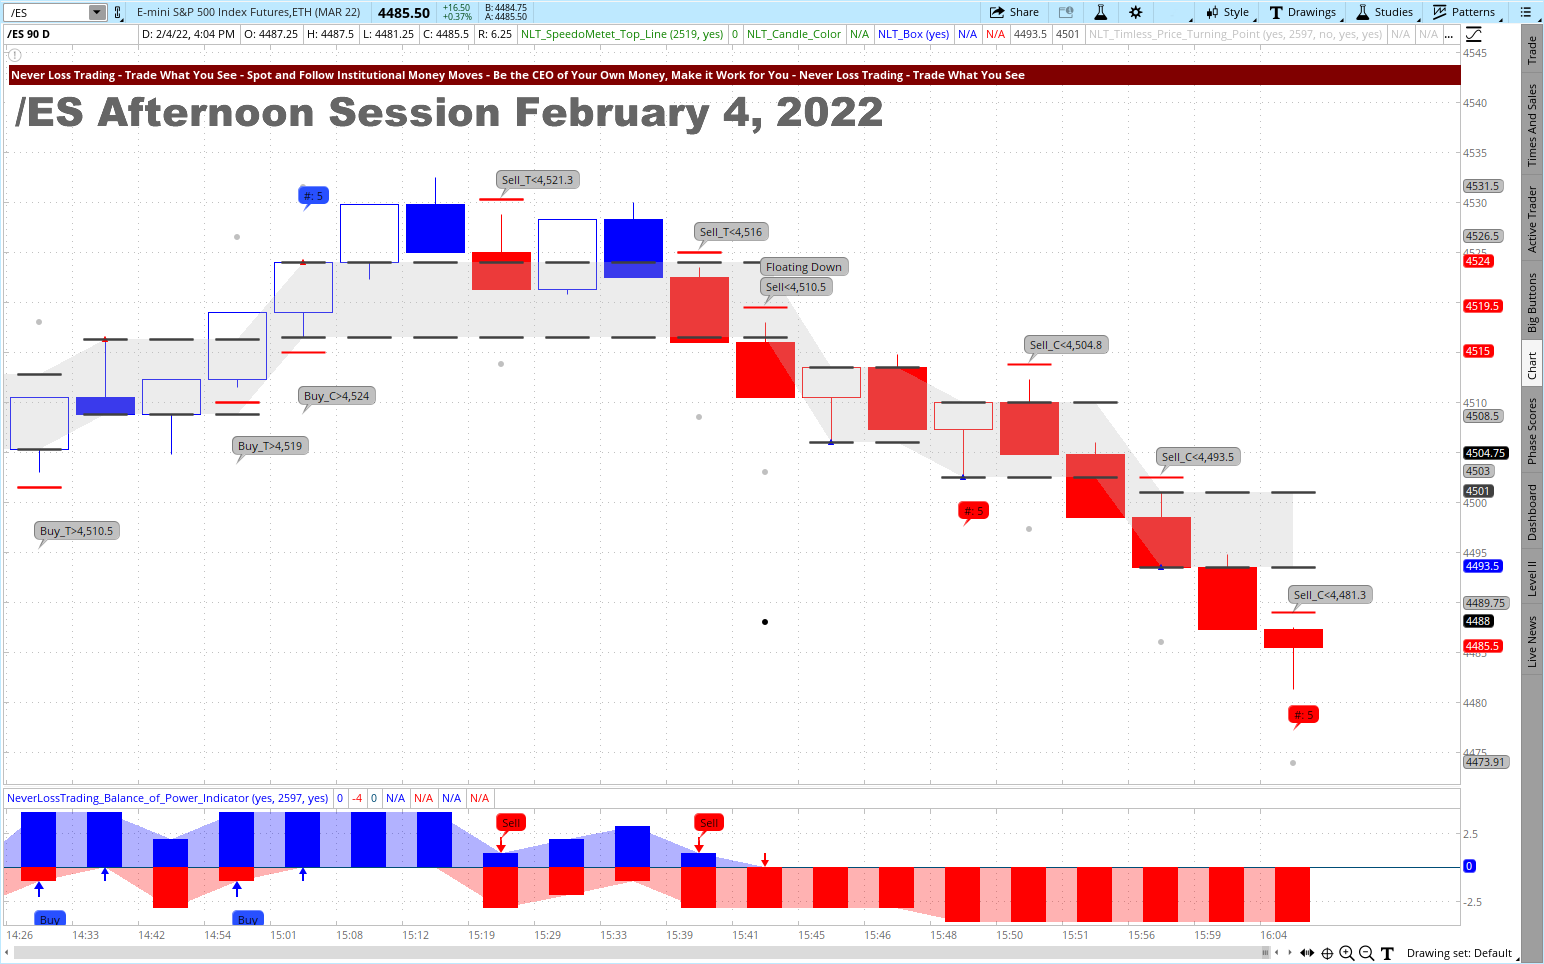
The chart shows multiple buy or sell opportunities:
- Each opportunity formulates as a buy > or sell < a system-defined price threshold, allowing you to enter the trade direction only when the direction is confirmed.
- Each price change ends at the target (dot on the chart) or the red cross line, indicating where to stop.
- The system probability is ≥ 65%. The difference of entry to stop is about 1.2-times the difference of entry to the target. In the chosen example, entry to target was $350 and such the risk was $420. Adding up three trades: two winners ($700) and one losing trade ($420), gives you a positive expectation of $280 per contract on a set of three trades.
NLT Timeless Trend Catching for the E-Mini S&P 500 Futures Contract

Two trade situations:
- At 9:40 a.m. Buy > $4472.3. The price threshold was surpassed in the next candle, and two candles after came to the set target price level.
- At 9:48 a.m., Sell < $4475.30, and the trade came to target two candles after.
There are rules to learn to decide system-based, which trade to pick over another for trading at the highest probabilities. We work in individual teaching sessions with you and also give you written documentation, so you end up operating by a written business plan:
- Action plan: which situations to pick for trading.
- Financial plan: how often to trade and which instruments to formulate a measurable target.
- Money Management: How much to risk per trade and how often to trade; less frequent trading produces better results.
- Strategies applicable for all account types for day trading, swing trading, and longer-term investing
Let us work on a stock trading example and then explain the theory behind day trading with NLT Timeless Charts.
When you check the chart, you will see multiple trading signals, and when engaged in a trade, we do not consider supporting or opposite signals: The trade closes either at the target or the stop (red crossbar). Please also consider that we do not enter at an exit candle (one of the rules to learn).
AAPL on the NLT Timeless Trend Catching Chart, January 24, 2022

Trade results were appraised mechanically, considering every signal. Our mentorship will teach you how to appraise higher and lower probability setups.
- NLT Timeless Day Trading Theory
There are multiple ways to decide on a trade. When using technical analysis, you have the following variables to determine a potential price move setup:
- Price Change
- Volume Change
- Volatility Change
- Or a combination of those
The majority of trades are determined by a change of one of those variables over time: Moving averages would be a typical example for tracking and deciding based on an asset’s price movement over time. You most likely experienced that you predicted the future price move; however, on a counter-price-action, you got stopped, and you were out of a trade before it commenced in your predicted direction: Producing a loss instead of the desired win.
Like in a chess game: Acting with predictable moves is rarely a winning strategy.
If you use a dynamic, less predictable entry, exit, and stop definition, you certainly have the chance to increase your trading accuracy. Here is an overview of the most commonly used trading decisions.
Share of the Usage of Trading Decision Making Variables

With NLT Timeless Trading, time is taken out of cohesion. This will make your decisions less predictable; however, the stronger argument of the idea is:
We are helping you to simplify your trading decisions by specifying conditions to execute bracket or OCO orders along with the price movement of underlying assets.
The system works for all asset classes: Stocks, Futures, and FOREX.
What we casually named variables are, in reality, results of an underlying change in supply and demand. In the base economic principle, price results from a shift in supply and demand. Time is not considered a determining factor. The model assumes that markets regulate themselves instantaneously by economic principles. Let us do an Excursion into the economic principle of an exchange:
Supply and Demand Correlations

The above graph gives a relation of the quantity offered and the resulting price. In the current situation, additional demand for a stock at $100 occurs. If no additional supply occurs, the equilibrium will move up to match supply and demand at $110.
The typical problem for a trader is: In hindsight, you know what happened, and we want to help you predict the future price happening with high predictability and frequently by our systems and concepts.
Money flow accepts price as the resulting variable of a change in supply and demand and specifies potential price move setups with clearly defined:
- Entries (price threshold)
- Exits (targets)
- Stops (wrong assumption)
With our systems and strategies, we want to help you to higher accuracy:
- Only accepting a trade when the direction is confirmed
- Exiting at a pre-defined target, prevening for the price to pull back and taking your profits away before you realize them
- Choosing an adequate stop, so you are not taken out of a trade by a too-tight stop and keeping reward and risk in a meaningful balance.
A Quick tip: buyers and sellers move the market; whoever has the upper hand moves the market in their direction.
In this writeup, we focus on day trading and refer to swing trading or longer-term investing in separate documentation.
By the NLT Timeless Concept, we simplify life for you and let the chart tell when to buy or sell, specifying all decision making dimensions at once:
- Entry Conditions: Execute buy-stop or sell-stop orders at pre-defined price thresholds at assumed probability
- Exit Condition: When is the target reached
- Stop Condition: When are you wrong and exit
- Risk Management: Risk limiting and risk-adjusted by considering the Relation of (Entry – Exit) / (Entry – Stop)
When day trading for pre-defined price moves, positions are kept open for a couple of bars/candles but always close the same day.
One of the NLT Timeless Concept clients just said: “Now I am feeling comfortable, walking away from the trade without feeling the need for controlling it.”
We offer multiple systems where the NLT Timeless Concept can be applied. For example, the following chart combines NLT Top-Line and Trend Catching and the new NLT Timeless Turning indicators.
E-Mini S&P 500 Contract, June 17, 2021, NLT Timeless Chart

Chart Analysis
Four trade situations to discuss:
Situation-1:
Two strong signals were combined at the first bar of a red sequence: NLT Power Tower and NLT Timeless Turning Point. In the following candle, an NLT Trend Catching Sell Initiation signal confirmed the short direction and such; you can increase your target to the target of this candle, trading for a 2-SPU price move.
Situation-2:
From the signals, the trade setup looks strong; however, it was the exit candle of situation-1, and we do not enter at the exit candle, and it was at candle #5 of a red sequence. At candle #5 we expect a breakout or a pullback, and a breakout to target happened. After this, the price development reached the 3-SPU level (black dot), and such, we stop accepting new short signals.
Situation-3
Buy_T > $4,192.50, indicating a strong reversal signal and accepting this at the first leg up after a downtrend. In the next candle, a Floating Up buy signal confirms the direction, and we increase the target of the Sell_T-trade, aiming for a 2-SPU move, making the extra income possible.
Situation-4
Buy > $4,209 was at candle #5 and into the 3-SPU level—a possible trade at a little lower probability but doable. We stopped accepting further long signals when the price development reached the 3-SPU level.
Yes, there are rules to learn, and we share what it is, and you decide if that is doable for you!
Aside from the trade rules, we teach no trade rules and considerations.
No Trade Rules:
- No re-entry at exit candle or exit candle price level except of a prior reversal price move
- No entry in NLT Purple Zone
- Do not open trades after a 3-SPU price expansion from the NLT Trend Initiation signal (black dot)
- Be aware of previous price action as support/resistance. Check the left and do not trade the first attempt to break a prior high or low; use the NLT Time of the Day Price Channels as an indication for resistance and support.
- Close the trade at the closing of the sixth candle if not at target.
Considerations
Rule-based trading leaves little to no room for interpretation is what we believe in as a success principle.
We are more than 10-years in the trading education business, teaching one-on-one at your best available days and times.
Trading our own account day-by-day and helping clients lets us provide long-term experiences and support.
Customer service and tailored mentorships are our virtue. Following this principle, we provide:
- Server-installed Software
- Real-Time Data
- System-Defined Entries, Exits, and Stops
- Position-Sizing
- Time-in-a-Trade
- Trading-Strategies
- Risk-Handling
- Business Plan (financial- and action plan)
- Own scanners to find investment opportunities
- Watch list indicators for finding changes in supply and demand on multiple time frames
Basing your trading and investing decisions on defined rules is learnable, and we are here to support you!
Experience how our systems work:
+1 866 455 4520 or contact@NeverLossTrading.com
Schedule your consulting hour! Working one-on-one spots are extremely limited: Do not miss out!
Follow our free publications and webinars…sign up here, and we are looking forward to hearing back from you,
Thomas
Disclaimer, Terms and Conditions, Privacy | Customer Support

No comments:
Post a Comment