Summary: What is the basis of your trading decisions, and how do you limit your risk? Explore how decision-making and selected trading strategies can bring the odds in your favor. “if you don’t know why to trade, you will not reach profitability.”
Read on and watch the video.
As a trader, you have choices of the instruments to pick and trade:
- Stocks (about 1,000 well tradable stocks)
- Stock Options (about 400 well tradable stock options)
- Futures (about 20 well tradable futures)
- FOREX Pairs (about 20 well tradable pairs)
By the numbers, Futures and FOREX traders need to cope with fewer instruments to choose from.

However, there is another dimension to decide what you want to trade, and we best summarize it in a graphic, giving an overview of how we appraise the choices you have as a trader or investor. To do so, we are drafting a portfolio where the size of the bubble represents the relative daily number of transactions. The graphs axis represents the required knowledge needed to trade the asset and the predictability of a price move to a set target.
Knowledge and Predictability of Asset Classes

Stock trading represents the easiest to learn discipline. However, if trading were easy, nobody would ever go to work. It is not, but it is learnable.
With the right choice of stocks to trade, the price movement of this asset class has higher predictability based on repetitive actions by key asset holders. When you focus on stocks with a volume > 1-million shares, you can tune your entries, exits, stops on a penny basis, and you can trade with a negligible risk until you have it right.
Options trading, on the other hand, is the discipline that requires the highest trading know-how and has the lowest predictability, based on:
- There are several option trading strategies; if we keep it simple in just buying Calls for long positions and Puts to go short, you still have to decide for the time to expiration, the strike price, and if the option price is fair or overstated.
- You are buying an asset with time decay; when your strategy does not work out, you will still lose time value; even so, the price of the underlying moves in your direction.
- Depending on the asset you buy an option at, there might be a meager trading volume with a wide bid/ask spread, taking away from your return.
- When you buy at the wrong price, the price of the underlying option might not go up in the same relation to the price movement of the underlying.
Futures are leveraged products with a wide variety of price moves per tick (minimum price move of the underlying). They are excellent trading products; however, you need to understand minimum price moves to trade for, best trading times, relations to international news announcements and product-specific happenings. As you can see, there is a lot to consider.
FOREX products offer excellent trading opportunities with micro, mini, and full lots. Like in Futures, the dynamics of multiple pairs need to be learned, and aside from the named institutional investors, you have federal banks interfering with the markets, giving you another level of consideration and on the knowledge and predictability base.
In essence: Regardless of the assets you trade, you need to build up your knowledge base on the price developments and patterns to find a way of specifying which type of assets offer you the chance to enter into a potential price move.
In the next dimension, let us discuss risk-limiting trading strategies for those instruments and why this is important.
Successful traders prevent drawdowns by applying strategies that limit their risk. However, by using a stop, you are not necessarily protected against gaps that occur based on news events or when markets are cornered by exceptional trading engagement, as we saw for GME and AMC in 2021.
Risk Limiting Strategies by Asset Class
| Asset | Risk Limiting Strategies | Stop Setting Risks |
| Stocks | Day TradingStocks with Options | Exception Overnight Gaps |
| Options | Puts, CallsVerticals | None None |
| Futures | Day TradingPuts/Calls or Verticals on Futures | Exception None |
| FOREX | Stop Setting | Central Bank Decisions |
Adding the risk-limiting dimension produces the following three-dimensional matrix:
Trade Dimensions by Asset Class
| Asset | Predictability | Knowledge | Risk-Limiting |
| Stocks | High | Medium | Medium |
| Options | Lower | High | High |
| Futures | Medium | Medium | High |
| FOREX | Medium | Medium | Medium |
Day trading is the best choice for risk-limiting your decisions. If you want to swing trade or hold longer-term assets, you best combine assets with options or trade their options: This is possible for stocks and futures. FOREX traders participate more or less in a 24h market; their most significant risk is when central banks announce decisions to interfere by the monetary decision that might spark FOREX pairs on an instance to the up or downside. An example of this, in 2011, the Swiss Franc currency peg of 1.20 to the Euro came into effect. On January 15, 2015, Switzerland announced that it was going to scrap its peg: The currency for a short period exploded towards major pairs and gave investors with stops a horrible result, on where their stops got filled.
We teach all of these strategies and more in our mentorships:
NeverLossTrading Mentorship Program Elements

However, we tailor the mentorship specifically to your wants and needs and the trading styles you choose. You find more specifics on our blog and website. Let us now give you some examples that demonstrate what you want to trade; let the chart tell when to buy or sell.
In the next step, we pick some examples. In recent days, we have had a very high success rate with our indicators; hence, do not be surprised to see mostly winners.
Our goal and focus are high probability setups with a win rate at or above 65%, which will substantially differ from what you most likely decide by while reading this.
You will see that every trade initiated has a clearly defined entry base, target exit, and stop level (or adjustment level). With that, your trade selection and execution are painted on the chart.
This is why we say, trade what you see:
“Let the chart tell when to buy or Sell!”
Next is a chart analysis from the real-time platform.
- Stock Examples
Let us pick a day trading example for AAPL. The chart applies what we call the NLT Timeless Concept. Instead of drawing price happening over time, we trade for price changes and with that prevent long candles with unfavorable risk-reward setups:
AAPL NLT Timeless Trend Catching Chart, Jan. 24, 2022

A price threshold is formulated for every trade situation: buy > and sell <. This way, you can operate with buy-stop and sell-stop orders and only enter a trade when the threshold is surpassed in the price movement of the next candle. When you add up winning and losing trades, you see an example of high probability trading where we strive for winning 65% and above.
The chart shows a pure mechanical appraisal where every situation is traded. In the mentorship, you will learn the rules of how to pick higher over the lower probable cases.
Let us now take a time-based example for swing trading: holding a position between one and ten days.
Our name, NeverLossTrading, is not a promise that you never lose a trade; it derived from a concept of repairing losing trades instead of accepting a stop loss; however, never stop loss trading was a bit lengthy.
AAPL NLT Daily Trend Catching Chart, Jan./Feb., 2022

The chart shows multiple situations from January 4 to February 9, 2022, where it reads no trade: A signal spelled out a trading opportunity; however, the direction was not confirmed in the price movement of the next candle and such, no trade got accepted.
If you trade from an IRA, you would not be able to follow the short signals on the chart (SEC regulations do not allow short selling in IRAs). However, we teach appropriate Options trading strategies that you can profit from when stock prices fall.
2. Futures Trading
The E-Mini S&P 500 Futures contract is an instrument many retail and professional traders operate with. Hence, let us pick a day trading situation and a longer-term trade setup:
NLT Timeless Trend Catching Chart for the E-Mini S&P 500

The chart shows multiple buy or sell opportunities:
- Each opportunity formulates as a buy > or sell < a system-defined price threshold, allowing you to enter the trade direction only when the direction is confirmed.
- Each price change ends at the target (dot on the chart) or the red cross line, indicating where to stop.
- The system probability is ≥ 65%. The difference of entry to stop is about 1.2-times the difference of entry to the target. In the chosen example, entry to target was $350 and such the risk was $420. Adding up three trades: two winners ($700) and one losing trade ($420), gives you a positive expectation of $280 per contract on a set of three trades.
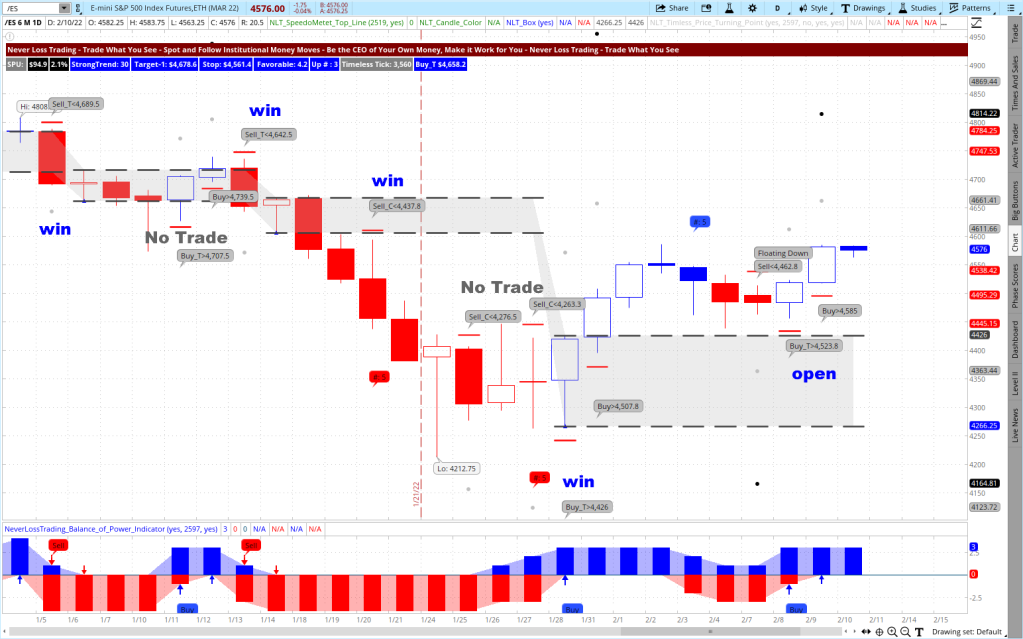
Daily NLT Trend Catching Chart for E-Mini S&P 500

From left to right, you see:
- A trade to the downside, breaking the price containment NLT Box and coming to target: gray dot.
- Two trades with “No Trade” indication: the first trade, the target was cut short by a box line – no trade. The second signal was not confirmed.
- What follows are two winning trades that came to target.
- Then two “No Trades” where the threshold did not get surpassed in the next candle.
- A winning trade on Buy_T> $4,426 that came to target three candles after entry.
- An open trade that did not reach its target or stop. We set the stop by the red crossbar on the chart.
3. FOREX
The most favored FOREX pair is the EUR/USD. There are multiple ways to participate in the price development, and we share a day trading and swing trading example:
Timeless NLT Day Trading Chart for EUR/USD

From left to right:
- No Trade, by NLT Box Line cutting the price move to target short
- Wining long trade to target
- Winning short trade, followed by another winning short trade
- A losing short trade
- Two winning long trades.
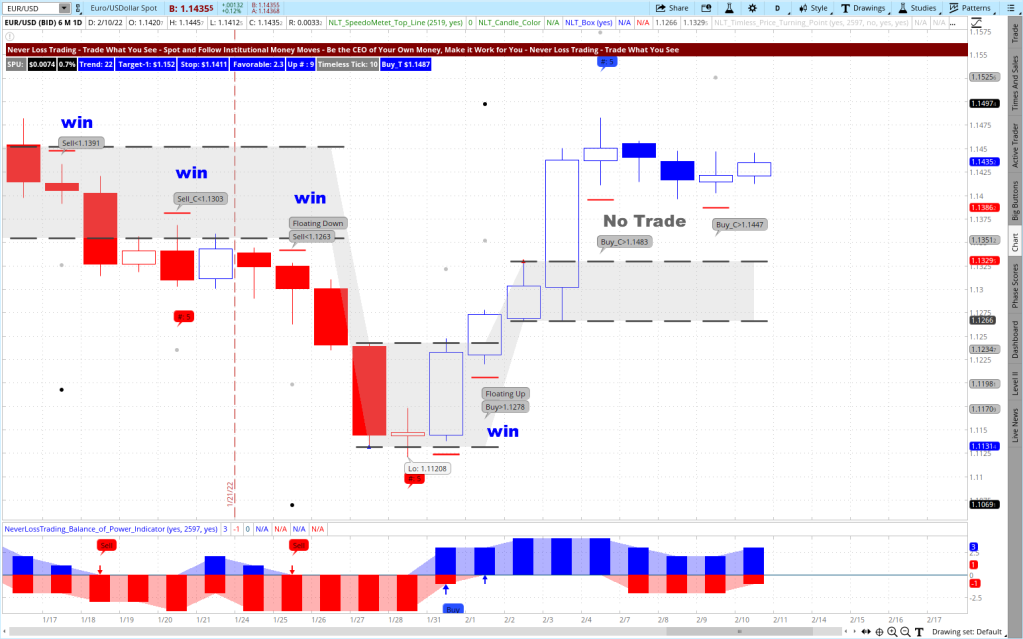
Daily NLT Trend Catching Chart for EUR/USD

When we sparked your interest, and you want to come on board with our systems and strategies, we invite you to a personal session to see how our systems work life.
contact@NeverLossTrading.com Subj.: Demo.
We are more than 10-years in the trading education business, teaching one-on-one at your best available days and times.
Trading our own account day-by-day and helping clients lets us provide long-term experiences and support.
Customer service and tailored mentorships are our virtue. Following this principle, we provide:
- Server-installed Software
- Real-Time Data
- System-Defined Entries, Exits, and Stops
- Position-Sizing
- Time-in-a-Trade
- Trading-Strategies
- Risk-Handling
- Business Plan (financial- and action plan)
- Own scanners to find investment opportunities
- Watch list indicators for finding changes in supply and demand on multiple time frames
Basing your trading and investing decisions on defined rules is learnable, and we are here to support you!
Experience how our systems work:
+1 866 455 4520 or contact@NeverLossTrading.com
Schedule your consulting hour! Working one-on-one spots are extremely limited: Do not miss out!
Follow our free publications and webinars…sign up here, and we are looking forward to hearing back from you,
Thomas
Disclaimer, Terms and Conditions, Privacy | Customer Support


No comments:
Post a Comment