Eight Strategies That Experts Use in Conditions Like This
Powerful strategies to help you navigate, adapt, and capitalize on the fast-moving markets of Fall 2026. Whether volatility spikes or trends emerge, this guide is built to keep you one step ahead.
Why knowing when to stop matters as much as knowing when to enter
Most traders come to day trading chasing the entry: the perfect setup, the right indicator, the ideal time of day. Those things matter. But the traders who actually turn intraday price action into a repeatable paycheck share a habit that gets far less attention than entries do: they know their number for the day, and they stop when they hit it.
That number is a budget. And the discipline to close the book once it’s reached, rather than keep pushing for one more trade, is what separates traders who compound small wins into a real weekly income from traders who give it all back by the closing bell.
The Trap of Trading Past Your Number
As day trading coaches, we see one pattern show up more than any other among traders who plateau: overtrading. It rarely looks reckless in the moment. It looks like one more setup, one more contract, one more attempt to turn a good day into a great one. It is, almost without exception, the fastest way to turn a good day into a mediocre one.
We train traders to work against this instinct directly by setting a budget before the session starts and treating that number as the finish line, not a suggestion. Meet it, and the trading day is done. Consistently meeting it, week after week, is the actual qualification for scaling up size, not a hot streak or a lucky call.
Less trading is more: − = +
We put this in front of every NLT trader we coach: fewer, better trades outperform a full day of screen time. Two well-chosen setups beat ten impulsive ones because each additional trade beyond the budget adds risk without a proportional edge.
A Realistic Weekly Target
The first goal we set for new traders is concrete and achievable: $1,000 a week by trading a single contract of the E-Mini S&P 500 Futures Contract, Crude Oil Futures, or Gold Futures. It’s a number deliberately chosen, large enough to matter, small enough to be realistic for one contract without forcing size into a setup that doesn’t warrant it.
Once the weekly budget is made, fold for the week or step down to a micro contract, so a strong week isn’t quietly given back chasing extra size.
Traders building a small account toward prop-firm sponsorship start on micro contracts; hitting $100 a week on micros is the signal that it’s time to trade the prop firm’s capital instead of your own.
Focus on two trades a day, not ten. The setups worth taking are few; the rest is noise dressed up as opportunity.
We maintain a reference account where we apply our approach exactly as described, so traders can see firsthand the clear advantages it offers. This week (August 10 to 14, 2026), for example, we had one winning trade on Monday, placed no trade on Tuesday, and executed two on Wednesday—and still closed above budget. Some days are simply not worth trading due to sluggish price action, and our NLT Timeless Charts help you identify precisely when that is the case.
E-Mini S&P 500 Trades on August 10, 2026
We were just 30 minutes into the trade when we booked a profit of 450 USD. It was an NLT Red Zone trade in which the system highlights areas of strong price action. Two NLT Signals at color highlighted volume marked a potential turning point, while the NLT Accumulation line (the blue dashed line at the top) signaled a high probability that price would gravitate toward that level—and it did. In other words, we combine multiple, independent factors to act only on high-probability trade setups, and we show you exactly how to do this in one-on-one coaching sessions, scheduled at the days and times that work best for you.
Reading a Session Before You Trade It
A budget only works if the trades funding it are taken with an edge, not a guess. That edge comes down to three things lining up: the part of the session when price pressure is actually unfolding, a setup with a real directional read, and a risk/reward relationship that fits what the day is realistically offering. Miss any one of the three and the other two can’t save the trade.
If I told you exactly when it’s best to trade, would you follow it? Most traders say yes—then end up trading on their own schedule anyway, at the time that’s convenient rather than the time that’s truly productive. The traders who hit their budget targets fastest are usually those who trade the market’s clock, not their own. That’s why we took no trades on Tuesday in a sluggish market, but executed two trades on Wednesday when price action was favorable—resulting in a total day income of 850 USD. Add the $450 from Monday, and the weekly budget was attained.
E-Mini S&P 500 Trades on August 12, 2026
The first trade captured a critical turning point at 8:40 a.m., supported by highlighted volume and attraction to the NLT Accumulation Line, and closed around 9:20 a.m. with a profit of $437.50. Compare this to the first example from August 10, and you will immediately recognize the recurring patterns we look for before committing to a trade. The second trade occurred in an NLT Red Zone, after sellers took control at the NLT Accumulation Line and pushed price lower. We acted on a strong signal combination, backed by previously highlighted volume, finishing the day with $850 in income and the week with $1,300—right on budget.
The Habits a Budget Is Built to Break
Traders who struggle to move from inconsistent to consistent tend to share the same three habits, and a tight budget is, in part, a structural fix for all three:
Repeating an approach that is statistically less likely to work, simply because it’s familiar.
Choosing to trade at the hour that feels right personally, instead of the hour the market is actually pressuring price.
Ignoring how volatile the day is when sizing the reward being sought against the risk being accepted.
None of these come from a lack of effort; they come from trading on feel. A budget doesn’t fix feel directly, but it puts a hard ceiling on how much a feel-based mistake can cost in a single day, which buys time to fix the underlying habit properly.
Trade the Chart, Not the Clock in Your Head
The other half of the fix is learning to let the chart itself dictate entries and exits, rather than a hunch about where price should go next. This is a mindset shift more than a technical one, and it tends to land fastest with traders who come in open to a new process, whether that’s someone new to trading altogether or someone experienced who is willing to set aside habits that need to be unlearned first.
We call our approach a decision-making cockpit for a reason: a pilot doesn’t fly on feel; they cross-check several instruments before acting. Day trading, done properly, works the same way, and it’s why we teach one-on-one rather than through a generic course, adapting the instruments and the pace to the trader in front of us.
One Method, Read in the Moment
For day trading with NLT, the core skill taught is the NLT Timeless Method: reading what the chart is showing right now, independent of the clock, to increase the odds of a winning entry. Time-based approaches, keyed to specific hours or session windows, remain useful too, particularly as a complement rather than a replacement. The goal isn’t to declare one superior; it’s to recognize which tool fits the conditions actually in front of a trader today, not the conditions remembered from yesterday.
That combination, a defined budget plus a signal read in real time, is what resilience to changing markets looks like in practice. It isn’t a rigid system applied no matter what the tape is doing. It’s a trained habit: confirm the setup, size it to the day’s real risk/reward, take it, and stop once the day’s number is made.
Learn the Setups. Trade the Session. Close the Book.
Day trading success isn’t a function of screen time. It comes from a small number of well-defined setups, a budget that keeps any single day from undoing a good week, and enough practiced repetition to make recognizing the setup automatic. NeverLossTrading offers a free one-hour personal consulting session to walk through how these setups and this budget framework apply to the instruments and schedule that fit your trading day.
Ready to Day Trade like a Pro?
Learn one-on-one which NLT Setups to take or spare.
Contact us: contact@NeverLossTrading.com
Subject: Day Trading Consultation
For more real-world strategies, grab the free eBook “The Annual Market Cheat Sheet,” featuring another day trading article plus insights from nine other traders on their personal trading styles.
Generally, we speak of timeless when something is not affected by the passage of time or changes in style.
In traditional trading, most decisions are driven by time-based charts — such as five-minute, ten-minute, or hourly candles — that create a new bar at the end of a set period. While this method is widely used, it often leads traders into unnecessary noise, false signals, and missed opportunities. The NeverLossTrading (NLT) Timeless Day Trading Concept changes this game entirely by removing the arbitrary constraints of time and focusing instead on system-generated price increment changes.
Rather than waiting for a clock to dictate when a new candle forms, the NLT Timeless approach creates a new bar only when a system-defined price increment — a change in market price significant enough to warrant attention — is reached. This way, traders see what matters: market moves that carry meaning and potential.
Why Timeless Charts Outperform Time-Based Charts
In time-based charts, two consecutive candles might look identical in size but could represent drastically different levels of buying or selling pressure. A quiet market might generate multiple time candles with minimal price change, while a sudden surge in momentum might still be crammed into a single candle, hiding the action that truly matters.
The NLT Timeless concept fixes this by:
Filtering out periods of low volatility and noise.
Focusing trader attention on meaningful market movements.
Aligning trades with critical price turning points rather than arbitrary time intervals.
Always keeping risk and reward for every trading opportunity in a meaningful balance.
Acting on Critical Price Turning Points
At the heart of the NLT Timeless system is the ability to detect precisely when buyers take control from sellers, or vice versa. Our algorithm identifies these turning points by combining:
Volatility-adjusted price increments to determine when a new bar should form.
Pre-defined exit points (target dots) for systematic profit-taking.
System-defined stops, keeping risk and reward in a meaningful balance.
This provides traders with an edge that time-based charts cannot replicate: a clear view of market shifts as they happen, not after the fact.
The NLT Timeless Concept in Action
We prefer day trading with futures; however, our systems work for all asset classes and also project high probability setups on time-based charts. To demonstrate the advantage of the NLT Timeless Concept, we compare timeless to time-based charts for our three preferred futures to trade: E-Mini S&P, Crude Oil and Gold.
Let’s imagine trading the E-Mini S&P 500 using the NLT Timeless approach:
Step 1 – Price Increment Trigger Instead of forming a candle every 10 minutes, a new bar appears only when the market moves by the set price increment (e.g., 1 SPU — Speed Unit).
Step 2 – Entry Signal Confirmation The system prints a buy or sell signal once the price crosses a system-defined threshold, confirmed by the next bar’s price movement.
Step 3 – Exit with Precision A target dot is set automatically. If the market reaches it, the trade is closed; if not, the adjustment line offers a chance to repair rather than take a stop-loss.
Benefits for Day Traders
Day traders using the NLT Timeless Concept enjoy:
Reduced false signals caused by market noise.
Better alignment with actual market sentiment.
More consistent results by acting only when meaningful price changes occur.
The ability to meet pre-defined income budgets through high-probability setups.
Trading Examples – Time-Based vs. Timeless in Action
Let’s step into the markets on August 8, 2025, and see how the NLT Timeless Concept transforms trading opportunities compared to traditional time-based charts.
E-Mini S&P 500
Ten-Minute Chart On the standard ten-minute chart, we spotted three trade setups that met our acceptable risk-reward criteria. Two of these trades hit their profit targets exactly as the system predicted, each target marked by a dot on the chart. The third trade, however, failed to reach its goal — a familiar frustration for time-based traders.
Timeless Chart
Covering the same time period, the NLT Timeless Chart also produced three setups — but here’s the difference: all three delivered on their potential. By responding only to meaningful price movements, the timeless approach kept us in sync with the market’s rhythm, avoiding the false start that occurred in the time-based method.
Crude Oil
Ten Minute Chart
Two trades appeared on the ten-minute chart, but volatility painted a messy picture. The chart displayed oversized candles — surges that obscured finer market details and wiped out smaller, more frequent opportunities.
Timeless Chart
Switching to the timeless setup, the noise disappeared. Those oversized candles were broken down into clear, actionable movements, revealing multiple additional opportunities — each filtered for risk and reward before they ever reached our screen.
Gold Futures
Ten Minutes
In the observed period, our indicators saw no suitable trades on the ten-minute chart. Gold’s price action didn’t fit our criteria, and the rigid time bars left us waiting on the sidelines.
Timeless
The NLT Timeless chart told a different story. Several high-quality opportunities emerged — all maintaining a meaningful balance of risk and reward. Where time-based traders saw nothing, timeless traders had clear entry points and profit targets.
A True Game Changer
By removing the artificial constraints of time, the NLT Timeless Day Trading Concept allows traders to focus on the natural rhythm of the market. With its emphasis on volatility-adjusted price increments and rule-based entries and exits, it equips traders with a precise and repeatable strategy to capture opportunities at the most critical moments.
If you are ready to experience trading the way professionals do — where the chart tells you when to buy or sell — the NLT Timeless Concept is your path forward.
🎯Discover a high-yield, low-risk trading concept built for
precision and performance.
At NeverLossTrading, we’ve
tackled the biggest challenges in day trading options—like low liquidity and
wide spreads—by handpicking two powerhouse ETFs: SPY and QQQ.
Backed by our proprietary NLT Timeless Concept, this strategy delivers
frequent trade opportunities, structured entries and exits, and a favorable
risk/reward profile through intelligent gamma positioning.
🚀 Curious how we do it?
We’ve prepared a complete concept document, including chart examples, trade
mechanics, and how to apply our proven system.
In business and leadership, Simon Sinek stands out as a beacon of inspiration, challenging conventional thinking with his groundbreaking concept: “Start with Why.” This principle, outlined in his renowned book and TED Talk, emphasizes the importance of identifying and harnessing our actions’ underlying purpose or motivation. While Sinek’s philosophy has primarily been applied to organizational leadership and personal development, its principles are relevant in trading and investing.
At the core of Sinek’s philosophy lies the belief that successful individuals and organizations are driven not solely by what they do or how they do it but by a clear understanding of why. This principle transcends industries, resonating deeply with traders and investors seeking to navigate the complexities of financial markets. By embracing the “Start with Why” mindset, traders can unlock a new dimension of purposeful trading, informed by a deep understanding of their objectives and motivations.
Enter NeverLossTrading, a leading provider of trading education and software solutions designed to empower traders with the tools and knowledge needed to succeed in today’s dynamic markets. Much like Sinek’s emphasis on purpose-driven leadership, NeverLossTrading encourages traders to approach the markets with clarity of purpose and a strategic mindset.
At the heart of NeverLossTrading’s approach lies a commitment to helping traders uncover their “why” – their underlying motivations, goals, and aspirations in the trading world. By starting with why, traders can cultivate a more profound sense of purpose and direction in their trading journey, guiding their decision-making process and fueling their long-term success.
NeverLossTrading offers comprehensive resources and tools to empower traders to trade confidently and consistently. From cutting-edge trading software to personalized coaching and mentorship programs, NeverLossTrading equips traders with the knowledge, skills, and support needed to thrive in today’s competitive markets.
One of the critical tenets of NeverLossTrading’s philosophy is the importance of strategy and planning in trading. By developing a clear trading plan rooted in their unique objectives and risk tolerance, traders can navigate market volatility with confidence and precision. Through ongoing education and mentorship, NeverLossTrading helps traders refine their strategies, adapt to changing market conditions, and stay ahead of the curve.
Incorporating the “Start with Why” principles into their trading approach, NeverLossTrading empowers traders to align their actions with their underlying motivations and goals. By understanding the “why” behind their trades, traders can make more informed decisions, mitigate risk, and maximize their potential for success.
In conclusion, Simon Sinek’s “Start with Why” philosophy offers invaluable insights for traders seeking to thrive in today’s dynamic markets. By embracing purposeful trading and aligning their actions with their underlying motivations, traders can chart a path to success guided by clarity, intention, and resilience. With NeverLossTrading as a trusted partner and guide, traders can confidently embark on their trading journey, equipped with the tools and knowledge needed to achieve their goals and realize their dreams.
In our training and coaching, we not only develop the reasons why with our clients, we help our clients formulate a written business plan for trading success, defining the reason to accept a trade, where we jointly decide the focus assets, the potential number of trades, risk tolerance, and return expectations—a plan for trading success with a spelled-out action plan (why and when to trade) and financial plan (number of trades and return expectation).
Learn how the chart will tell when to buy or sell, and we share the following examples.
Longer-term trading: weekly chart based.
Swing trading: daily chart-based.
Day trading: NLT Timeless Concept.
NLT trading decisions are indicator-based, where the system defines a price threshold: buy > or sell<, and we enter into a trade when this threshold is confirmed in the price movement of the next candle. In addition, at entry, the system defines the exit (dot on the chart).
Longer-Term Trading Examples
When accepting NLT Signals from weekly charts, the expected time to hold an open position is one to ten weeks, with a statistical peak of three weeks.
Individual stocks show more decisive and more predictable price moves than ETFs. To demonstrate the strength of our systems, we pick QQQ as our ETF example.
QQQ, NLT Weekly Chart
The QQQ chart shows seven confirmed trade situations, and we list the time to target-1, where we will take our exit.
Situation-1(7/31/23): two weeks to close at target.
Situation-2 (9/18/23): five weeks to close at target.
Situation-3 (10/30/23): three weeks to close at target.
Situation-4 (11/20/23): three weeks to target.
Situation-5 (1/8/24): one week (the prior sell signal was not confirmed)
Situation-6 (1/29/24): three weeks to target.
Situation-7/8 (3/4 and 4/8/24): not confirmed.
Swing Trading Example
Here, we decide from daily charts with an expected holding time for open positions between one and ten trading days and a culmination point at three days.
To demonstrate the strength of our system, we pick two widely held stocks to continue our analysis, XOM and LOW, and systematically adhere to confirmed price movement signals triggered when the price threshold is surpassed within the subsequent candle’s price action.
The XOM chart reveals six trading opportunities: four confirmed signals successfully reaching their predefined targets, not confirmed signals. Trade #6 also reached its system-set target in a matter of three trading days.
XOM, NLT Daily Combined System Chart
LOW, NLT Daily Combined System Chart
The daily LOW chart showed five trade indications, four of which were confirmed, three came to target, and one got stopped, indicating the highly probable price move forecast of the included NeverLossTrading signals.
Day Trading Example
The NLT Timeless concept enables traders to diversify their strategies and capture broader market movements by identifying trading opportunities across various price frames and asset classes, allowing decisions at multiple price increment levels.
NLT day trading decisions are based on a couple of rules, and we best start when not to accept a signal:
In an NLT Purple Zone, because of the ambiguity of price direction.
When an NLT Box Line cuts the way to target short, indicating supply or demand levels.
There is no entry at the exit level of the prior signal.
We enter a trade when the spelled-out buy> or sell < price threshold is ticked out in the price development of the next candle. If this does not happen in the price move of the next candle, we will delete our order.
The trade target is highlighted by a dot on the chart and specified by the system.
We now take a recent example for the E-Mini S&P 500 Futures Contract on April 8, 2024, between 3 a.m. and 1:30 p.m. EST, highlighting and discussing eight trade situations.
E-Mini S&P 500 Futures Contract April 8, 2024
Situation-1: A confirmed short signal came to target two after two candles, and we do not consider the second signal on the way down (down moves are framed in red, up in blue).
Situation-2: A confirmed long signal needed five candles to reach the system set target.
Situation-3: A confirmed short signal came to the target.
Situation-4: A dashed NLT Box Line cuts the way to target short, and we do not accept the trade.
Situation-5: A confirmed long signal came to the target. All signals have their tops at the red dashed line, which was not infringed on the way to the target.
Situation-6: No trades in the NLT Purple zone and no trades at exit levels.
Situation-7: A confirmed short signal that reached its target.
Situation-8: A confirmed long signal came to the target, and we did not consider the next signal after the trade initiation candle.
We do not always claim to have all winning trades, but we offer high probability setups above 68% by combining NLT Systems.
Conclusion
Whether your preferred trading style is, regardless if you are a novice trader or an experienced pro, NeverLossTrading has the solutions you need to navigate today’s markets confidently. With our comprehensive range of trading tools and education, you’ll be well-equipped to master the art of trading, striving to achieve consistent profits.
When you are ready to trade and invest in high-probability setups, ask us for our system bundle, and we work with you in a live session to find out what suits you best.
Weather forecasts and market analysis might appear separate from the sun and the stock market ticker. However, delving into the intricacies of predicting weather patterns and price movements reveals intriguing parallels between these seemingly disparate domains. While forecasting rain and predicting price moves might not be an obvious pairing, both disciplines share underlying principles of data analysis, pattern recognition, and managing uncertainty. In this article, we’ll journey through weather prediction and trading, exploring their similarities and differences and uncovering how NeverLossTrading indicators can shed light on potential price move forecasts.
Predicting and forecasting are related terms often used interchangeably, but they have distinct nuances in meaning:
Predicting involves estimating or projecting a future event or outcome based on available information and data. It often implies a degree of uncertainty and is not always based on in-depth analysis or formal methodologies. Predictions can be intuitive, speculative, or informed guesses.
Forecasting, however, typically refers to a more structured and systematic prediction process. It involves using historical data, statistical models, and analytical tools to anticipate future trends, outcomes, or events. Forecasts aim to provide a more accurate and reliable perspective on future developments by considering a broader range of factors and using established methodologies.
In essence, predicting is a broader term that encompasses any attempt to anticipate what might happen in the future. At the same time, forecasting implies explicitly a more rigorous and data-driven approach to making predictions.
Weather forecasters and traders rely heavily on actual data to produce high-probability forecasts; however, there is never a 100% certainty. Meteorologists study weather patterns to anticipate future atmospheric conditions, while traders scrutinize price movements to gauge potential market directions. In both cases, data analysis acts as the compass guiding decisions. Like meteorologists assess temperature trends and wind patterns, traders analyze chart formations and underlying price, volume, and volatility indications to uncover trading opportunities.
Navigating Complexity and Uncertainty
Navigating complexity and embracing uncertainty are shared challenges. Weather systems are influenced by many variables—pressure systems, temperature gradients, ocean currents—and traders are similarly swayed by diverse factors like economic indicators, market sentiment, and geopolitical events. Both domains grapple with the reality that outcomes are shaped by a tapestry of variables, often beyond their control.
Parallel to Risk Management
Effective risk management is a cornerstone for both meteorologists and traders. A weather forecast guides people’s decisions: packing an umbrella or planning an outdoor event. Traders, too, employ risk management strategies to protect their investments. Just as an unexpected downpour might catch someone unprepared, market reversals can lead to significant losses if not managed wisely.
We teach our clients, how to cope with trade situations that go against the base assumption of the trade and repair them with the aim of turning potential losers either to winners or exiting them at breakeven.
Diverse Nature of Forecasts
While the comparison between forecasting rain and price moves might raise an eyebrow, the underlying methodologies share a kinship. Weather forecasts typically encompass broad probabilities—rain, snow, temperature ranges—while NeverLossTrading indicators aim for specific forecasts on price direction and potential trading opportunities. The weather forecaster gazes at the sky while the NLT traders act on high-probability indicators, studies, and patterns to chart their course.
Human Impact vs. Financial Influence
The human impact of weather forecasts is immediate: travel plans altered, events rescheduled, and umbrellas readied. Trading predictions, while influencing financial decisions, usually lack direct immediacy. Still, the consequences of both incorrect predictions can be felt across domains—unexpected rain at a picnic or a market reversal that defies an investor’s strategy.
Learning and Adaptation
Both weather forecasts and trading demand perpetual learning and adaptation: New data, emerging trends, and unforeseen events necessitate continuous adjustments to predictive models and strategies. Like meteorologists integrate new atmospheric data, traders integrate fresh market information to refine their forecasts, and this is what we have our systems for; they alarm you to act at crucial price turning points, and we best explain by examples, how our systems take seismic market readings of now to extrapolate potential price moves and trends.
Lessons from Weather Forecasting and NeverLossTrading
The symbiotic relationship between forecasting weather and price moves underscores the importance of data-driven analysis, managing uncertainty, and adapting to change. Both disciplines teach us that a solid foundation of historical data and patterns, coupled with a willingness to embrace unpredictability, can bolster the accuracy of predictions.
Conclusion
As we’ve embarked on this comparative journey between weather forecasts and NeverLossTrading indicators, the unexpected kinship between the two becomes apparent. Both fields stand as a testament to the power of data, the complexities of human behavior, and the challenge of anticipating future outcomes in dynamic systems. Whether forecasting rainclouds or price trends, we are reminded that informed decisions are rooted in thoughtful analysis, pattern recognition, and a willingness to adapt to the future.
Price Move Forecast
How does NeverLossTrading forecast price movement with high predictability? Our algorithms, including AI components, measure underlying changes in supply and demand, extrapolating three critical instances when an appropriate setup is found:
Entry condition: Price threshold to either buy above or sell below.
Exit: Take profit when reaching a system-defined price level.
Stop or Price Adjustment Level: Take a loss or adjust the trade and protect with our no-stop loss methods. Never Stop Loss Trading gave the basis for our brand name but was a bit lengthy.
Best, we demonstrate on some chart examples. Appropriate to the current market conditions, we focus on:
Swing Trading: holding positions between one and ten days.
Day Trading: opening and closing positions on the same day.
Longer-term trading: holding position for multiple weeks.
Swing Trading Example
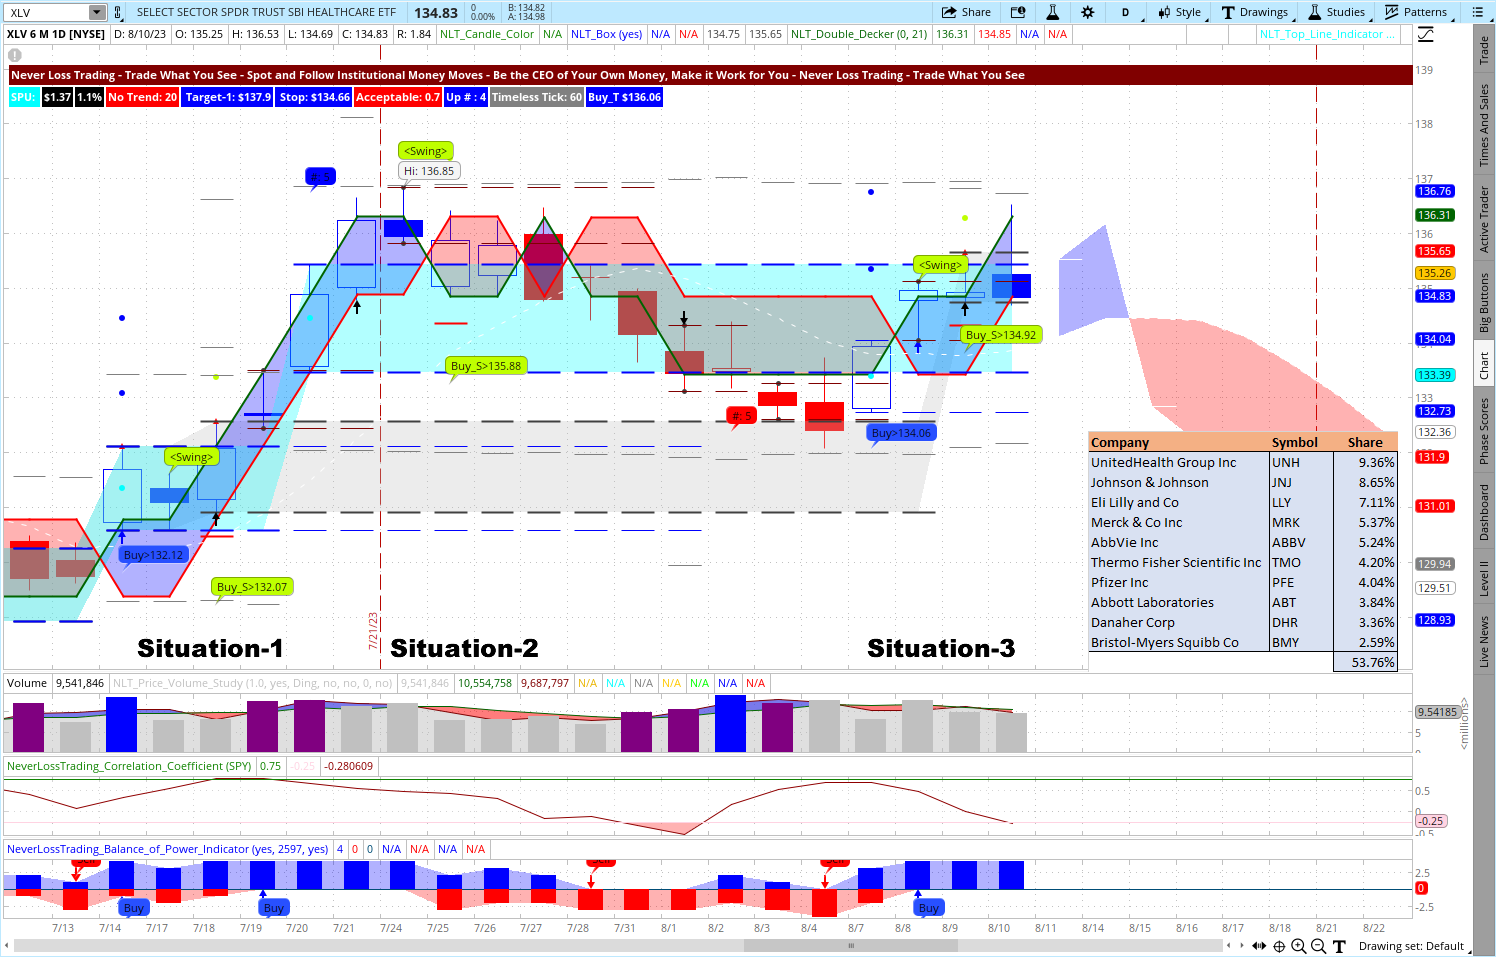
We take XLV, ETF of the healthcare sector. The chart shows three potential trade situations, combining NLT Top-Line and SwingPower indications.
XLV, Daily Chart, 7/12 – 8/10/2023
Situation-1: An NLT Top-Line Buy Signal: Buy > $132.12 (July 14) did not confirm the next candle’s price movement (we only accept signals when their high or low is surpassed in the next candle). A swing trading signal on July 17 indicated the basis for a coming potential price movement, and Buy_S > $123.07 confirmed and led a trade to the upside. By breaking out of a price containment (Cyan Zone), the system proposes to trade for a 2-SPU price move: 2 x $1.37 (you see the indication on the top left dashboard). If you did not want to exit at this point, the blue frame’s red line helped you trail the price movement with a firm exit at a 3-SPU level. We consistently act on learnable rules and teach them one-on-one in our training and coaching sessions.
Situation-2: The NLT SwingPower Buy Signal was not confirmed and did not lead to a trade.
Situation-3: The NLT Top-Line Signal, Buy > $134.06, confirmed and led to a directional trade to target ($134.50), indicated by a blue dot on the chart. The following NLT SwingPower buy signal resulted in a day trade by reaching its target after entry on the same day. The lime color dot on the chart was the target of the trade.
How do we come to those indications?
Like in systemic reading, our algorithms with AI components measure changes in supply and demand to indicate potential price turning points. The indicators on the chart measure happenings independently from each other to provide high-probability signals that work together.
Day Trading Example
A data-based trading approach can offer numerous benefits to traders looking to increase their profitability. Firstly, it provides a clear framework for decision-making, ensuring that all trades are made based on predetermined rules rather than emotional impulses, helping you to eliminate the risk of making impulsive or irrational trades, often leading to losses. Additionally, a structured approach can help traders identify market patterns and trends, allowing them to make more informed decisions about when to enter or exit trades. This leads to more consistent profits over time, as traders can capitalize on opportunities as they arise. Finally, a structured approach can help traders to manage risk more effectively by setting clear stop-loss and take-profit levels for each trade. By doing so, traders can limit their potential losses and maximize their gains, ultimately leading to greater profitability. Adopting a structured trading approach can be a powerful tool for traders looking to progress to profitability.
Let us give you some examples of rule-based or data-based trading:
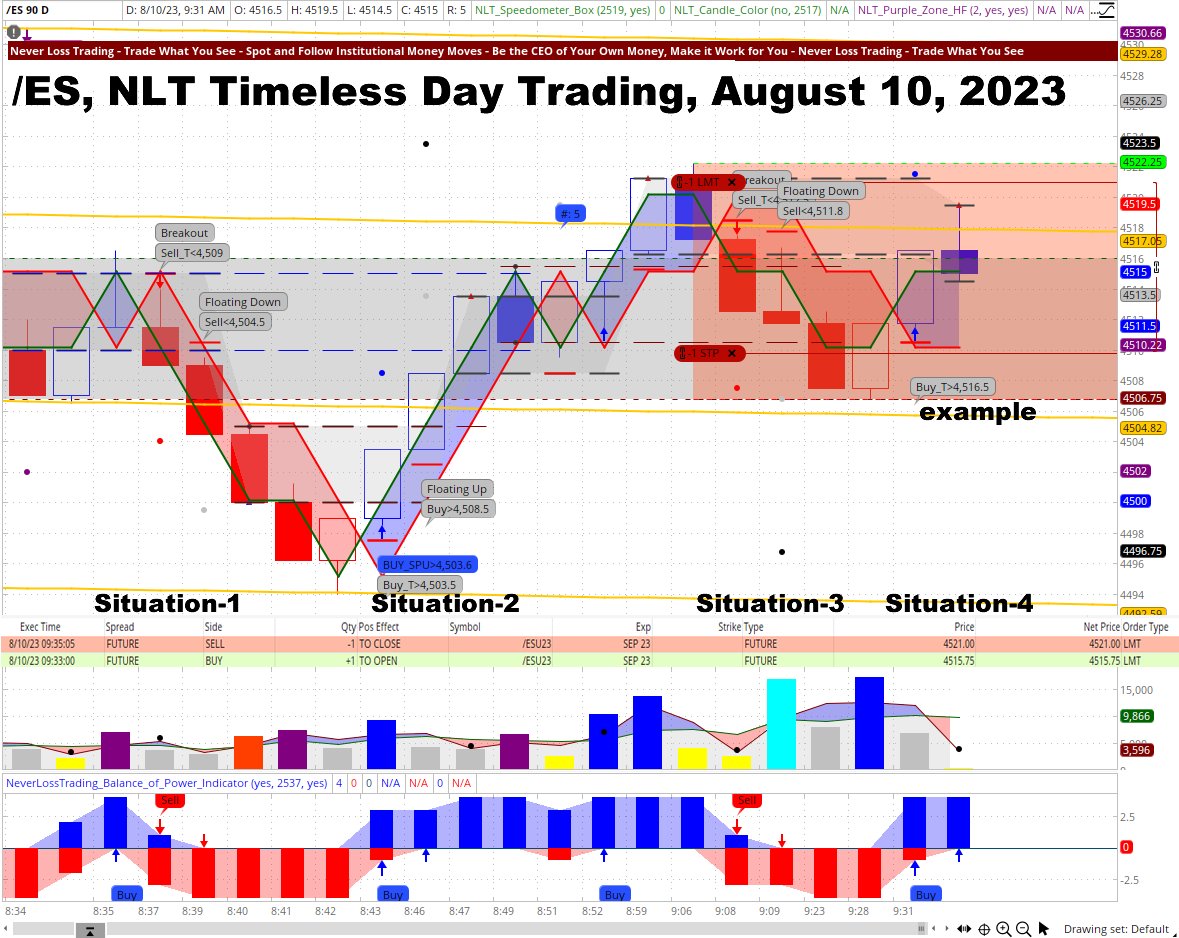
E-Mini S&P 500 Futures Example, August 10, 2023
The chart shows four trade situations; in each, the system spells out the following:
A price threshold: sell < or buy, a price level to be surpassed in the price movement of the next candle, or else no trade entry
The trade target: dot on the chart
Stop: red crossbar on the chart
On our NLT Timeless Day trading chart, we use system-defined price increments to specify the start and end of every candle instead of time, helping you multifold:
Each setup is in the system-appropriate risk/reward ratio, which is often not given in time-based candles
Your entries and stops are less predictable by not following time-based patterns
You trade for meaningful minimum price changes of the underlying instead of being eaten up in volatility
The system produces multiple trading opportunities in the trading day, while we propose to stop after two winners
On the chart, all four August 10, 2023 trade situations came to their system-defined target. We acted on Situation-4, and opened a long trade at 9:33 that closed at 9:35 a.m. Et, using a buy-stop bracket order, where the stop was at the red crossbar of the candle and the target at the dot. To demonstrate day trading, we always use a one-contract base. In the given example, the trade was good for a 5.25-point price move or an income of $262.50.
We could go on and on, but if you want to experience how our systems perform live:
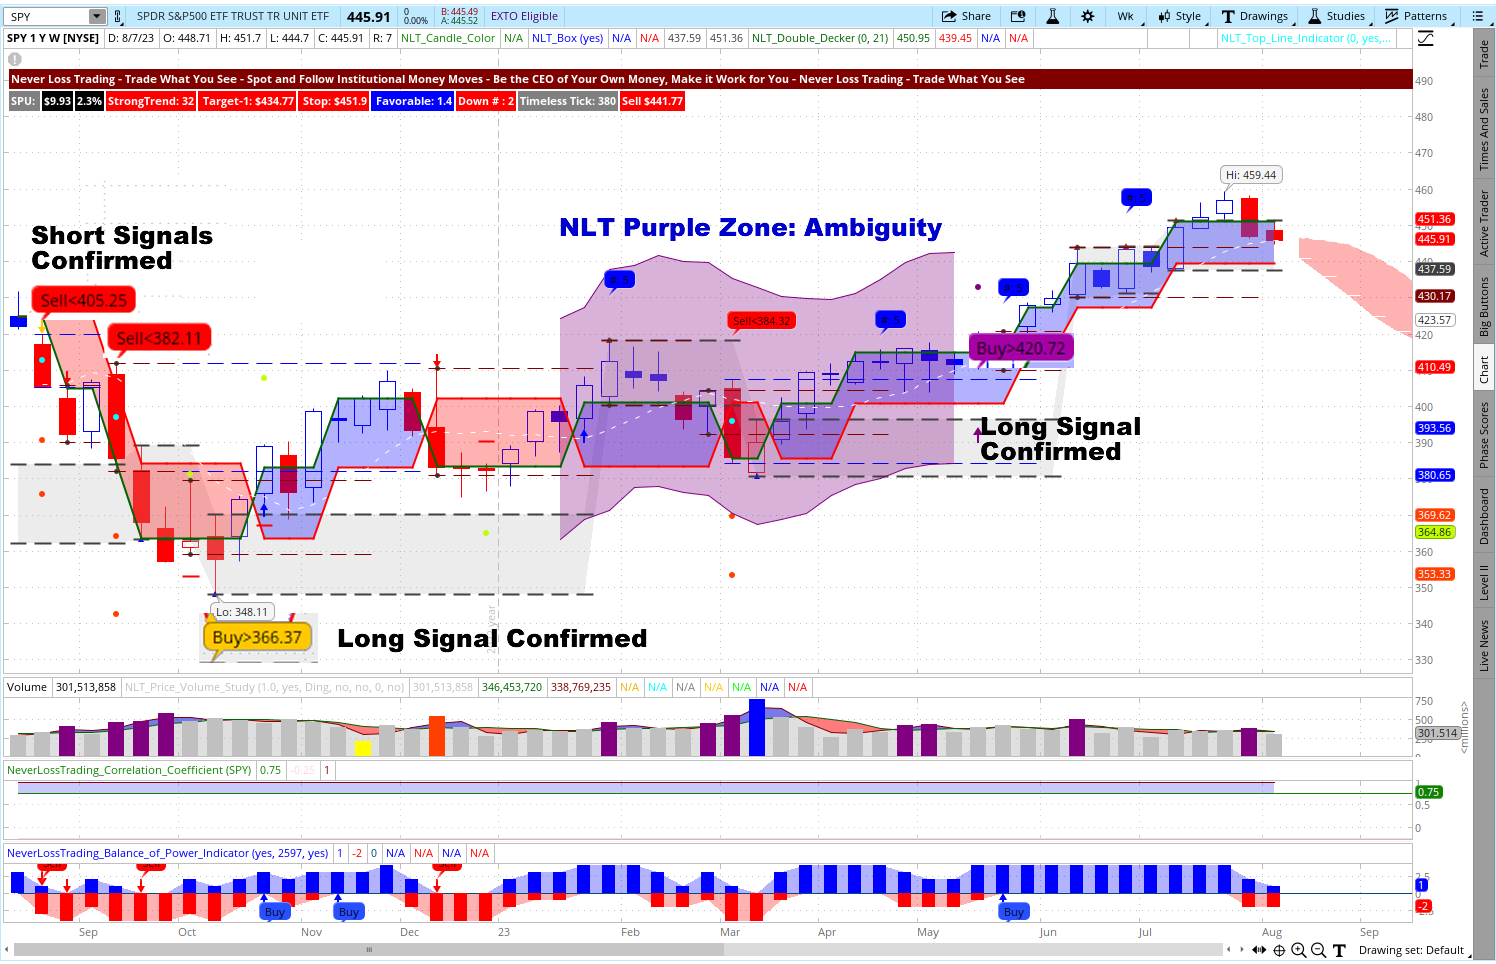
Making sound longer-term trading decisions was not easy in 2023. We like to analyze the overall stock market development of the S&P 500, based on SPY (ETF)—our charts color upwards-moves in blue and down-moves in red. When the price movement has no up or down momentum, when red and blue mix, an NLT Purple zone is painted as a sign of directional price ambiguity: This was the case from the week of 1/16/2023 to the end of May 19, 2023. Hence, we did not commit to longer-term trades, even if we wanted to: day trading and swing trading were appropriate strategies.
NLT Weekly Top-line Chart
The key for traders is to have advanced indications of what is happening and which strategy is applicable. The NLT Purple Zone indication is a great help for traders to choose the right strategy, and it announces when the time of ambiguity is over and directional longer-term trades are applicable. We take weekly charts to make this decision.
Learning from the market and picking the right strategy is essential. The same counts for day traders: when trading short-term, you must be aware of important news events and combine them with the overall market view. We post critical news events on our Instagram channel.
Aside from rule-based trading, NeverLossTrading provides psychological support by emphasizing the importance of discipline, patience, and emotional control. Through its trade repair method, traders can minimize losses and stay focused on objective trading decisions, reducing the influence of emotional biases.
Sign up here to stay connected with our trading tips, articles and webinars.
Our Offer
We help our students simplify technical analysis by providing a holistic approach that combines chart patterns, trend analysis, and market indicators. Traders are equipped with practical tools and methodologies to identify high-probability trade setups, helping them make informed decisions based on market trends and price action.
Executing trades at the right time and price can be challenging, especially in fast-moving markets. NeverLossTrading offers techniques for precise trade entries and exits, allowing traders to capture optimal returns. With its focus on high-probability setups and systematic approach, NeverLossTrading helps traders improve their trade execution and timing, maximizing their profit potential.
The financial markets are dynamic and ever-evolving, requiring traders to stay updated and continuously learn. NeverLossTrading promotes a culture of continuous learning, providing educational resources, webinars, and personalized mentoring. Traders gain access to a wealth of knowledge and expertise, empowering them to adapt to changing market conditions and enhance their trading skills.
Trading challenges are an inherent part of the financial markets, but with the solutions offered by NeverLossTrading, traders can overcome these hurdles and thrive in their trading endeavors. By addressing emotional biases, providing effective risk management techniques, simplifying technical analysis, optimizing trade execution, and fostering continuous learning, NeverLossTrading equips traders with the tools and knowledge needed for success. Embrace the solutions provided by NeverLossTrading and embark on a journey toward consistent profitability and trading excellence.
To succeed in trading, you best work with an experienced coach. Our #1 competitive advantage is the support and customer service we offer. Veteran traders have been through more ups and downs than you can imagine. So, experienced pros have probably experienced whatever you’re going through. If you are ready to make a difference in your trading. We are happy to share our experiences and help you build your trading business. Trading is not a typical career, and you best learn from those who are long-term in this business to cope with the rollercoaster of the financial markets. We are here to help and provide feedback on what you might be doing right or wrong. Strive for improved trading results, and we will determine which of our systems suits you best. The markets changed, and if you do not change your trading strategies with them, it can be a very costly undertaking. Hence, take trading seriously, build the skills, and acquire the tools needed. Trading success has a structure you can learn and follow.
Thomas Barmann (inventor and founder of NeverLossTrading)


 Contact us: contact@NeverLossTrading.com