Spot and Trade Institutional Money Moves

Algorithmic Trading with Human Interaction for:

Day Traders, Swing Traders, Long-Term Investors

Saturday, April 30, 2022

How to Control Your Trading Results

 Only what you can measure you can control; hence, you want to control the final result and the process to success.

Trading allows you a fresh start on an everyday basis. But if you want to make a fresh start, you need a reality check.

The worst trader has winners, but it is not wise to praise winners and disregard losers; you are only successful when you strike a positive balance.

Control Your Trading Results

For controlling your trading process, create a point of reference. Unfortunately, most traders do not journal their trades; it takes about 20 seconds to record a transaction, and it is worth it. However, if you do not pocess such records, take your broker statement, and it will tell a story.

If you are day trading, take the last 12 weeks as a swing trader or longer-term investor, the last 12 months of trade data and put them on a spreadsheet.

What was your P&L for each month, and how did your average winners and losers compare?

What were your five best and worst five worst trades, and what was the decision-making base?

Here is an example of how we propose journaling day trades:

As a trader, you are working with probabilities; there is no 100% winning strategy, but you need to map out what works, and this is what you focus on, leaving aside what did not work, period!

We provide pre-fab journals to our subscribers to enter their trades and review them after a set of twenty transactions to see:

  • Did you comply with the rules of your system?
  • Which indicator and setup gave you the highest returns and which did not?
  • Did you hold your trade to target or bail out early?

Let us share an example of how and what such a statistic can look like. The results are from a trader that uses NLT Top-Line, Trend Catching and Timeless. Journaling a trade takes about 20 seconds on our template. Most people hate documentation and administration; however, you will see that this time is well invested. We also recommend taking a trade entry screenshot to compare in the aftermath if what you thought you traded was what the chart was telling. Trading is a lot about mind control and focus. We see with our brain: our emotions, past experiences, and other influences often paint a different picture from what is there. It will get obvious when discussing the results.

The following spreadsheet shows the results of a day trading journal.

NLT Day Trading Journal Example

NeverLossTrading Journal Example

Feedback from the NLT Day Trading Journal

  • The trader conducted 58 Trades and produced $2,303 of income but wasted a lot of profit by exiting trades early and not at the system-defined target.
  • The new trader achieved a high winning percentage of 72%, complying with the system expectations.
  • In 17 trades that went positive, the trader left money on the table by exiting early because of his fear of losing.
  • Setting stops tighter than the system proposed and entering late in a trade accounted for 8 out of 58 transactions (14%) and showed some room for improvement.
  • The overall indicator performance was on spec; however, the Buy/Sell_T performance had a too high average loss compared to the average win by leaving the trade early on winners and accepting the max loss when the trade did not work.
  • The highest income-producing indicator was the Floating signal (part of the NLT Timeless Concept).

In summary: The trader does still not trust the system and is scared to follow the set instructions (43% negative performance); even so, the average indicator performance was 72%. Hence, he should walk away after trade entry and come back to see the result, keeping his hands off the computer while being in a trade.

We hope this example demonstrates how such a scorecard helps analyze where things worked well and where you have room for improvement to achieve solid and constant returns from trading.

However, a scorecard alone does not make you a successful trader. You need a high probability trading system to follow, and the scorecard example shows that controlling behavior is crucial too.

Trading is not an easy career: when you add up what it costs you to not act at high probability price turning points, you might be open to investing in a high probability system and appropriate education.

We highly propose following a business plan for trading success that shall entail:

Let us give you a chart example for a high probability system and the decision-making process:

The first example we pick shows the E-Mini S&P 500 Futures contract on the NLT Timeless Chart: timeless because if purely based on a decision on price moves, defined by an algorithm.

You see five trade situations highlighted, and we apply simple rules:

  • A trade signal leads to a transaction when the price threshold of buy> or sell < is validated in the price movement of the next candle. This way, you can operate with buy-stop and sell-stop orders.
  • Red crossbars specify the stop for the trade
  • Gray dots on the chart print the target level to exit the trade
  • We do not enter at the exit level when another signal prints.
  • We use NLT Trend Catching, and NLT SPU Move signals on the chart to identify trade potentials. In some instances, they occur on the same candle and point towards a strong price move potential.

ES on the NLT Timeless Swing Trading Example

NLT Timeless Chart for the E-Mini S&P 500 Futures Contract

Situation-1: Buy>$4314,4 led to a transaction on 3/16/22, and it came to target at the end of the same day, producing a value gain of $3750 per contract. The print: Floating tells you that the price moved outside a price-containment area and has a solid potential to go higher.

Situation-2: Buy_C>$4490 also led to a trade that came to target (gray dot). All other buy signals were disregarded because we do not enter at the exit level. The trade was a winner—entry on 3/18/22 and exit on 4/24/22. The letter C signifies a continuation signal in the up series.

Situation-3: Sell_SPU<4452,20 led to a short trade on 4/6/22 and reached its target on 4/12/22.

Situation-4: Sell_C<$4380.8 was stopped and a losing trade.

Situation-5: Sell_T<$4369.80 led to a short trade on 4/21/22 and came to target on 4/22/22. The letter T stands for an early price turning point of the NLT Timeless Indicator.

As you can see, we live by explained and learnable rules. Therefore, algorithmic trading is rule-based trading!

Here is a day trading example; we also pick the E-Mini S&P 500 contract for April 22, 2022. Of course, the system also works for stocks, options, and FOREX.

/ES Day Trading Chart Example
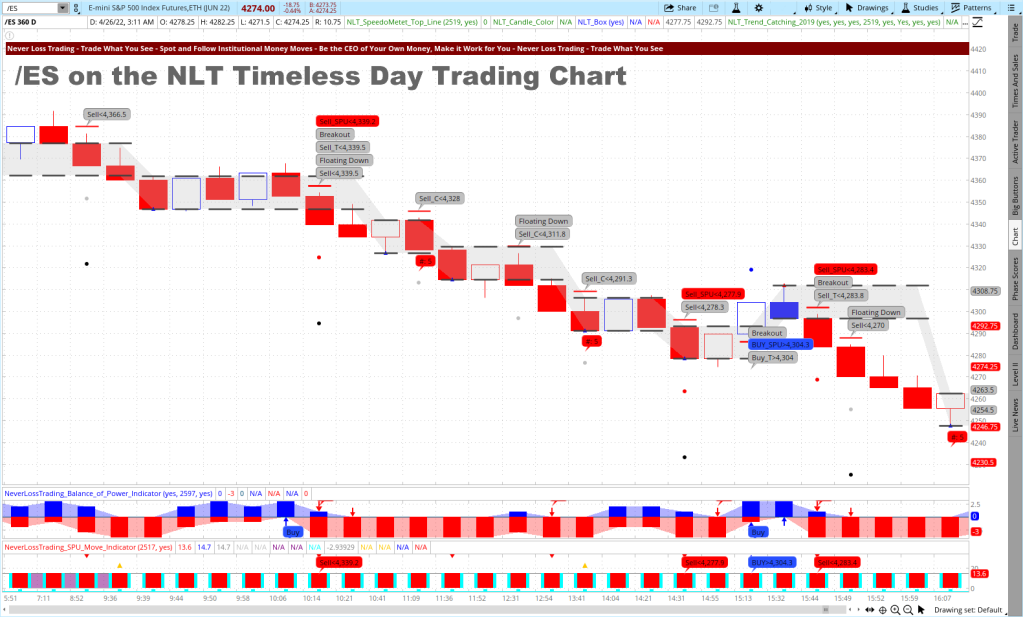
NLT Timeless Chart for the E-Mini S&P 500 Futures Contract

The chart shows multiple day trading opportunities, each good for a value change of $750, and it is evident that we have or winning than losing trades. We would not have selected the potential losing trade at 15:30, but by taking a mechanical approach, we still had five winning and one losing trade between 6 a.m. and market close.

Now that we shared how to work with a solid decision-making base, let us work on risk and money management to build a budget example for day trading:

Your first goal is $1,000 in income per week.

Our statistics say that trading less produces a 60% higher income; hence, we divide the $1,000 by 2.6, giving you $385 risk or reward. Setting risk and reward at the same base, you settle either at two winners or two losing trades each day.

Essential for your trading budget is that you set your maximum risk tolerance to either 2% or 5%, and it tells you:

  • At a 5% risk tolerance, you need a minimum holding of $7,700
  • At a 2% risk tolerance $19,250

It is crucial to control your maximum risk. Risk control is a simple undertaking as a day trader: you set your stop, taking care of the issue. However, when you hold positions overnight, prices can gap and create higher than expected drawdowns that can only be prevented by combining stock trades with options or trading the options.

Back to the example:

When you make budget, you stop trading. Simple, isn’t it?

We set the expected return per week at $1,000. Hence we need to calculate the number of trades at a 1:1 risk/reward relation that your system has to produce:

ProbabilityTrades per WeekRisk or RewardIncome Expectation
65%4 $        385 $               462
65%5 $        385 $               578
65%6 $        385 $               693
65%7 $        385 $               809
65%8 $        385 $               924
65%9 $        385 $           1,040

By the table, you need nine trades a week, on average, two a day, and when your system is 65% right, you get to budget.

When you give yourself the condition to stop trading at one win or two losses, you get a maximum win or loss of $1,155 per week.

Trading is probability thinking, and we help you set your mind on the proper focus.

The expectation value of the return is directly related to the probability of your system forecasting the price move.

Hence, a broad knowledge base and skill set are needed. You best find a mentor sharing the details with you: if trading could be learned from a book, the statistics would not state that 76% of the retail traders are losing money: You need a  system, a plan to follow, process control, and more to make money off the financial markets constantly and this is what we teach.

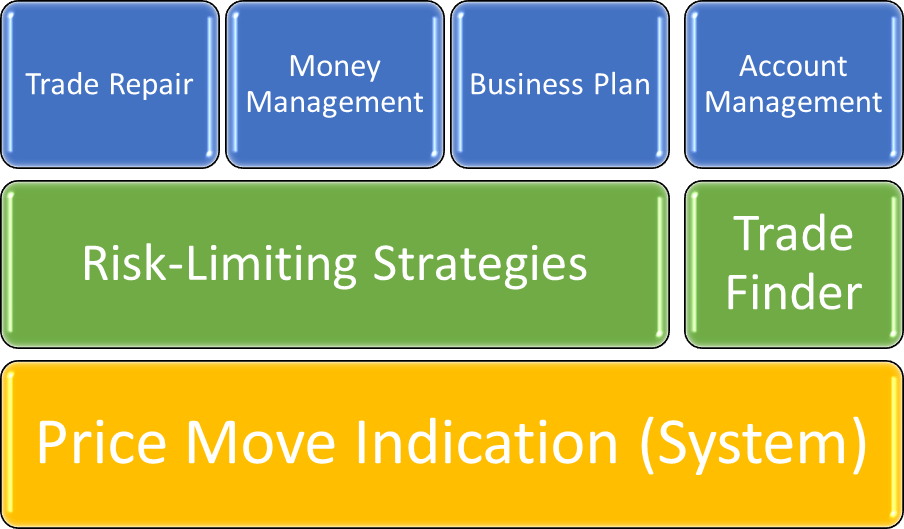
Here is an overview of learning elements we will go through in our coaching and training sessions:

Learning Elements to Trading Success

NeverLossTrading Learning Elements

Contact us to experience what we can do for you:

contact@NeverLossTrading.com Subj: Demo.

We are ready to share our experiences and help you build up your trading business. Trading is not a typical career, and you best learn from those who are long-term in this business to cope with the rollercoaster of the financial markets. We are here to help and provide feedback on what you might be doing right or wrong.

Make a change to your trading results, and we will find out which of our systems suits you best.

We are happy to hear back from you,

Thomas Barmann (inventor and founder of NeverLossTrading)

www.NeverLossTrading.com

Disclaimer, Terms and ConditionsPrivacy | Customer Support

Friday, April 22, 2022

Timeless Trading Success

Experience how to act with high probability, less predictability, on a high participation rate in many opportunities, giving you an edge as a retail trader.

Trading is about three keywords, starting with a P:

  • Probability of your system (≥ 65%)
  • Predictability of your actions (low)
  • Participation rate (high)

Let us explain:

Timeless Trading

As a trader, you are a probability thinker, which means there is no 100% certainty that your decision will lead to a positive outcome. More frightening: 76% of the retail traders are losing money. Trading is not a game where the smartest are necessarily the best. If IQ were a ticket to riches in the market, many more successful traders would be there. From our experience, you need to put the odds in your favor by operating with a system and rules of a 65% or higher predictability; else, the chance for success will be random. Here is a little experiment that demonstrates the math behind this statement:

We are comparing two marble drawing experiments:

  • Two bags of 20 marbles, one bag carries 13 winners (green), the other 11, replicating a 65% and 55% chance of winning
  • Make ten draws, and after each the draw, you put the marble back
  • Calculate the expectation value with the Bernoulli formula
Bag of Marble Experiment to Express Probability and Expected Returns

The experiment with 13 winners (65%) has a 75% chance of winning six or more times out of ten draws. On the other hand, the experiment with 11 winning marbles (55% chance of winning) only has a 50% or random chance of winning. Unfortunately, most retail traders base their decision-making on low probability indications.

The worst trader has positive trades, but it is not about those; it is about your average winning balance. Only when this is positive are you trading with an expectation of producing a return from your financial market investments.

What is the basis of your decision-making, and do you want to better your trading or justify that you were right because you had random wins?

We have more than ten years in business and helped many get independent in trading the financial markets. Still, we also met a good number of people at introductory meetings and noticed we could not help (we summarize two one-hour sessions to their essentials):

Example-1: Trading the Impossible Trade

Potential Client: “I trade as a day trader, trading from the one-minute chart.”

NLT: “Are you making money with this?”

Potential Client: “No (shorting the real long answer).”

NLT:  “let me explain why you will not have a chance on a one-minute chart to trade with the odds in your favor.”

You trade for a price change of $50; on entry and exit, you need to consider $12.50 of slippage (bid/ask spread) and about $4 commission.

Return Expectations when Trading for $50

Hence, if you win two out of three, you are treading water.

Potential Client: “When your system cannot do it, it is not right for me.”

If you want to give yourself a chance to trade for positive expectations, do two things:

  • up your target from $50 to $300
  • change your decision-making base to a high probability

Our system will provide about seven day-trading opportunities and let us jointly calculate the expectation value for a set of three trades, winning two, and we go through chart examples for proof.

Return Expectation when Trading for $300

Potential Client: “I see what you say, but I want to trade from the one-minute chart; I have been doing this for far too long to change.”

NLT: “Understood, and good luck; it was nice talking to you.”

It is a human pattern, doing the same thing repetitively and expecting different results. So change is inevitable if you want to make money trading.

Example-2: Shooting for the Stars

Potential Client: “I am looking for a system that gives me two to one or higher winning expectations.”

NLT: Those exist in the NLT Top-Line Program; we call them early up or early down signals; they have a 68% probability and occur about 15% of the time. We have traders that solely trade those, but you need to be patient to rule out 85 of 100 trades when focusing exclusively on such setups. In addition, if you take all system opportunities, you multiply your income expectation by increasing your participation rate. Let us share the distribution of acceptable trades by their risk/reward setups, calculating the expected value when trading for $1, winning two out of three of a set of 100.

Return Expectations, Winning 2:1

Hence you increase your income opportunity about threefold (2.7-times to be exact) when you allow all acceptable trades: participation rate is crucial for your overall success.

Potential Client: “I am taking this and want to learn how to do it in your mentorship.”

NLT: “Our Top-Line Program comes with 20 hours of individual training, all indicators installed, and charts set up for you; let me send you an educational contract that can be a tax-deductible expense depending on your tax status.”

The financial markets are institutional investment-dominated. Therefore, your stop price levels are relatively predictable when using standard time-based charts. However, to move your trading activities outside the range of predictability, we developed the NLT Timeless concept. The NLT Timeless Chart is purely price-based and cuts higher-level price movements into manageable sub-units, letting you participate in many opportunities for day trading, swing trading, and longer-term investing.

Let us share some trading examples that undermine what we shared prior:

NUE on the Daily NLT Top-Line Chart

NUE on the Daily NLT Top-Line Chart

We highlighted four confirmed trade situations: A situation is confirmed if the spelled out price threshold is surpassed in the price movement of the next candle: Buy > $130.50, for example, or Sell < $105,38. Upside price movements are framed in blue, where the red line on the bottom functions as a trailing stop line. Dots on the chart spell out the targets. Downside price developments are framed in red, where the red line on top of the channel functions as a trailing stop.

We share multiple strategies in our mentorship on acting on the opportunities from the price chart and the lower NeverLossTrading Comparison indicator. It would be too much to write this all out now. The orange indicator shows opportunities > 2:1, and as you see, there was only one that was valid. The second orange signal had no confirmed directional price move; even so, the price moved down after, but we trade favorable conditions only.

E-Mini S&P 500 on the NLT Timeless Swing Trading Chart

E-Mini S&P 500 Futures Contract on the NLT Timeless Chart

We highlighted three trade situations between March 14 and April 14, 2022, each good for a price change of about $3,500 per contract. There are rules involved to learn and apply:

  • Do not enter at an exit level
  • Do not trade when an NLT Box Line cuts the way to target short
  • Disregard additional signals on the way to the target
  • The gray dot on the chart shows the target
  • The red crossbar at the signal candle shows you where to put the stop
  • The graph combines NLT Trend Catching, NLT SPU Move and the NLT Timeless Concept

Next, we again pick a day trading example for the E-Mini S&P 500 futures contract. It shows multiple downside opportunities that all came to target, complying with the rules we spelled out above. Each trade was good for a price change of about $600: a couple of solid trades can quickly pay back the system and mentorship tuition.

E-Mini S&P 500 on the NLT Timeless Day Trading Chart

Day Trading the E-Mini S&P 500 Futures Contract on the NLT Timeless Chart

Make a change to your trading:

  • Decide on high probability price turning points
  • Be less predictable in your actions
  • Participate in multiple opportunities for the instruments of your choice: Stocks, Options, Futures, FOREX

Contact us, and we will show you live what our systems can do for you.

contact@NeverLossTrading.com, Subj.: Demo

We have more than ten years in business and helped many traders get independent in the financial markets. If you like to read more about our concepts, subscribe to our free trading tips and check our blog.

Trading is not an easy career: when you add up what it costs you to not act at high probability price-turning points, you might be open to investing in a high probability system and appropriate education.

We highly propose following a business plan for trading success that shall entail:

  • Written rules on when to trade and when not
  • A financial plan that breaks down the number of trades needed to come to budget.

See our overview of learning elements we will go through in our coaching and training sessions, and we will focus with you on any asset class: Stocks, Options, Futures, and FOREX. The choice is yours. This is what we will share.

  • Acting with a system probability > 65%
  • Mechanical rules for entry, exit, stop
  • Trade at perfect moments only
  • Consider overall factors, patterns
  • Risk and reward in an acceptable balance
  • Risk-averse trading
  • Holding positions to target
  • Do not add to losers
  • Stick with a trading strategy. Follow a business plan – action plan and financial plan
  • Trade for meaningful price moves
  • Systematic trading
  • Having a mentor to learn from

Here is a schematic:

Learning Elements of the NLT Teaching Program

The frightening truth: 76% of private investors lose money!

We base this number on a study we conducted, and if you like to experience why: write us an email, and we will share the details: contact@NeverLossTrading.com Subj.: 76%. 

Who had assumed such a high rate of losing traders?

If you want a different trading career, find a solid training and coaching program and contact us to find out what could work for you:

contact@NeverLossTrading.com Subj: Demo.

We are ready to share our experiences, helping private investors to build their trading business. Trading is not a typical career, and you best learn from those who are long-term in this business to cope with the rollercoaster of the financial markets. We are here to help and provide feedback on what you might be doing right or wrong.

Make a change to your trading results, and we will find out which of our systems suits you best.

We are happy to hear back from you,

Thomas Barmann (inventor and founder of NeverLossTrading)

www.NeverLossTrading.com

Disclaimer, Terms and ConditionsPrivacy | Customer Support

Tuesday, April 19, 2022

Free Trading and Investing Magazine

Knowledge is power; however, the most common trading knowledge is not common knowledge. Let us share what is needed in today’s markets by inviting you to read the Traders World Magazine #84 for free.

Traders World Magazine

You will find several articles explaining what is needed for trading our days.

On page 27 forward, we will relate to:

7 Considerations for Day Trading

Read and download your personal copy.

For questions: 

Call +1 866 455 4520 or contact@NeverLossTrading.com 

Stay informed and subscribe to our free reports and webinars.

Good trading,

Thomas


DisclaimerTerms and ConditionsPrivacy | Customer Support

Friday, April 15, 2022

Bitcoin NeverLossTrading Style

 Bitcoin is the world-leading cryptocurrency, and there are multiple ways for you to participate in the underlying price moves.  

Bitcoin NeverLossTrading Style

Upfront, in case you do not know us: the name NeverLossTrading derives from the concept of trade repair instead of accepting the stop loss, and Never Stop Loss Trading was a bit lengthy. We trade our own accounts and offer high-probability algorithmic trading systems and strategies for private investors.

People sometimes ask why it is called cryptocurrencies: because they use cryptography to keep it secure. There are no physical bitcoins; only balances are kept on a public ledger that everyone has transparent access to (although each record is encrypted). Bitcoin is the most popular of hundreds of other cryptocurrencies and is abbreviated as BTC when traded. At the time of this article, for trading one BTC, you need about $40,000. However, you can buy fractions of Bitcoins: One Bitcoin divides into 1,000 millibitcoins (mBTC); 1,000,000 microbitcoins (μBTC); or 100,000,000 satoshis (the name of the unknown inventor).

A simple and effective way for trading Bitcoin is to operate with the BITO EFT. ProShares is the fund manager of BITO and bases the ETF value on relation to investments in the Bitcoin Futures. The ETF provides a solid options chain and, on an average day, exchanges more than 10 million shares. Currently, one share of BITO is worth about $25 and offers a daily value change between 5% and 10%. Hence, an instrument that gives you multiple opportunities as a trader to participate in the volatile moves of the underlying. One thing to consider: when trading ETFs, you need to comply with SEC regulations for day trading and shorting stocks; you need account holdings of a minimum of $25,000. BITO is usually HTB (hard to borrow), and as such, you best operate with an options strategy to bet on a falling Bitcoin value with this instrument.

For retail traders, Bitcoin offers the possibility to participate in extraordinary strong price moves. To demonstrate the variability of the Bitcoin price, we compare it in a chart to the S&P 500.

Bitcoin Futures and S&P 500 Annual Price Development

Twelve Months Price Development of Bitcoin and the S&P 500

The chart shows the S&P 500 spaned a price band of 13% over twelve months, while Bitcoin Futures had a 60% variability. Hence, speculating for up and downside moves should be part of your strategy.

Futures traders have an easy way of trading for rising and falling prices. They have the choice of two instruments for participating in the price move of Bitcoin, both issued by the CME:

/BTC, the full contract is based on five Bitcoins. A value change of $5 represents one tick and shifts the future value by $25. The actual margin requirement for trading this contract is $75,000, and you control a notational value of $200,000 (five Bitcoins, each valued at $40,000).

/MBT, the Micro Bitcoin Futures Contract, with a contract size of 0.1 Bitcoin. Again, a value change of five represents one tick and shifts the value of the underlying contract by $0.5. For trading this contract, your broker will reserve a maintenance margin of $1,500, and you control a notational value of $4,000.

The question is, how to best forecast the price move of Bitcoin?

We recommend the NLT Timeless Concept and a combination of the NLT Trend Catching and SPU Move indicators, which helps you to find and act at crucial price turning points.

With the NLT Timeless Concept, you cut price moves into manageable sub-increments that simultaneously keep risk and reward in compliance with the system’s expected high probability forecast at or above 65%.

Hence, you will trade with a positive expectation, but you must learn and comply with the rules. Therefore, we teach the concept one-on-one on your best available days and times, tailoring our systems and concepts to your wants and needs.

We best explain some of the details to learn in a chart example, picking the /BTC Futures Contract. Then, you will see five situations we discuss based on a mechanical approach, where we take every signal as valid, and you learn in the mentorship which ones are higher probable.

/BTC on the NLT Timeless Chart

Bitcoin Futures on the NeverLossTrading Timeless Chart

Situation-1: We see two buy signals, the first one on February 24, 2022, and the second on February 28; both got confirmed in the price movement of the next candle and came to target (gray dot on the chart). Two winning trades.

Situation-2: Short signals and a price move to the red dot. A winning trade.

Situation-3: Long signal and a price move to the blue dot on the chart. Immediately after a short signal, which got stopped, producing one winning and one losing trade.

Situation-4: Three long trading opportunities, and all came to target.

Situation-5: The first sell signal came to its stop at the red crossbar – and we would not take this signal for multiple reasons. The second signal came to target, producing one winning and one losing trade in this sequence.

In summary: Eight winning and two losing trades between February 24 and April 11, 2022. Each transaction was good for a value change of about $10,000. 

Next, we pick a day trading example for the /MBT:

/MBT on the NLT Timeless Day Trading Chart

Micro Bitcoin Futures Contract on the NeverLossTrading Timeless Chart

On April-4, you see a long opportunity that came to target after the re-opening of futures trading at 6 p.m. ET on April 5.

April-5 shows a short signal that came to the red dot target.

April-6 shows multiple short signals that all came to target.

Three solid winning days. Trading one contract produced a value change of about $70 in each situation.

Let us now take a look at the ETF development on a swing trading basis and one rule to consider: do not trade candle #5, which is highlighted for this reason:

BITO on the NLT Timeless Chart, April 2-11, 2022

BITO ETF on the NeverLossTrading Timeless Swing Trading Chart

The chart shows seven winning and one losing trades.

When we get your interest in this, contact us, and we will show you live what our system can do for you.

contact@NeverLossTrading.com, Subj.: Demo

We have more than ten years in business and helped many traders get independent in the financial markets. If you like to read more about our concepts, subscribe to our free trading tips and check our blog.

Trading is not an easy career: when you add up what it costs you to not act at high probability price-turning points, you might be open to investing in a high probability system and appropriate education.

We highly propose following a business plan for trading success that shall entail:

  • Written rules on when to trade and when not
  • A financial plan that breaks down the number of trades needed to come to budget.

See our overview of learning elements we will go through in our coaching and training sessions, and we will focus with you on any asset class: Stocks, Options, Futures, and FOREX. The choice is yours. This is what we will share.

  • Acting with a system probability > 65%
  • Mechanical rules for entry, exit, stop
  • Trade at perfect moments only
  • Consider overall factors, patterns
  • Risk and reward in an acceptable balance
  • Risk-averse trading
  • Holding positions to target
  • Do not add to losers
  • Stick with a trading strategy. Follow a business plan – action plan and financial plan
  • Trade for meaningful price moves
  • Systematic trading
  • Having a mentor to learn from

Here is a schematic:

NeverLossTrading Learning Elements

The frightening truth: 76% of private investors lose money!

We base this number on a study we conducted, and if you like to experience why: write us an email, and we will share the details: contact@NeverLossTrading.com Subj.: 76%. 

Who had assumed such a high rate of losing traders?

If you want a different trading career, find a solid training and coaching program and contact us to find out what could work for you:

contact@NeverLossTrading.com Subj: Demo.

We are ready to share our experiences, helping private investors to build their trading business. Trading is not a typical career, and you best learn from those who are long-term in this business to cope with the rollercoaster of the financial markets. We are here to help and provide feedback on what you might be doing right or wrong.

Make a change to your trading results, and we will find out which of our systems suits you best.

We are happy to hear back from you,

Thomas Barmann (inventor and founder of NeverLossTrading)

www.NeverLossTrading.com

Disclaimer, Terms and ConditionsPrivacy | Customer Support