
Summary: Your broker wants you to trade often; we have a different opinion and put statistical proof behind it. Feel welcome to learn the reasons for our argument and read to understand why we say: less is more – = + in trading.
The likelihood of predicting the future price movement is called the system probability. For example, if your system accurately predicts a price move in one of two trades, your system probability is 50%. For producing income from trading the financial markets, you better come to high-probability-trading ≥ 65% to bend the odds in your favor. The likelihood of winning six or more trades out of 10 with a high probability system is >75% compared to operating with a random outcome.

We generally use the words traders and investors synonymously; traders hold positions in shorter terms like intraday or multiple days, investors in various weeks, months, or years. The actions to put less trading is more (- = +) in action differ between day trading, swing trading, and longer-term investing.
In the first example, let’s assume a day trading environment where each trade is independent of the prior trade. In reality, this is not the case, you need to consider the last happening before you enter into a transaction, but we want to spare this out here to come to a mathematical formula. The probability of winning three trades in a row is calculated by multiplying the system probability for each transaction:
The likelihood of winning three trades in a row =
System Probability x System Probability x System Probability
We focus and teach to operate with systems at or above 65% likelihood for predicting the price movement assets in distance and time.
Why two dimensions: distance and time?
A solid system should give you a forecast; for example, a $1 price move should be accomplished in one to five candles. If the price move is not at target or stops after five candles, you must either stay in the trade or leave it. So here comes the first critical point: When you follow statistical principles, you close the transaction and move your money to an asset where prices move. Hence it requires you to have more than one asset to trade and to follow pre-formulated principles.
We teach our students, particularly day traders, to close the books on an asset after two wins and be done for the day.
Why is that?
First, your financial plan should get you to your weekly goal by winning four trades, one per day.
All trading systems do not forecast price moves with 100% certainty but with a likelihood, and we propose at or above 65%; hence, you calculate the odds of winning as follows:
Calculating the Probability for Multiple Winners in a Row
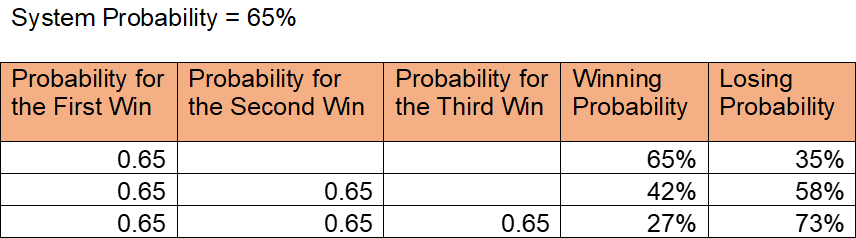
Hence, if you booked two winning trades, you are done for the day because your third trade in a row has only a statistical chance of 27% for reaching your target and a 73% chance of losing.
All statistics, but as a trader, you are a probability thinker and only act when the odds are in your favor.
Trades find a structured way to make sound and repetitive decisions and prevent having an urge to trade and being unable to stop: They let the chart tell when to buy or sell!
Unfortunately, many who want to succeed in trading do not train for the needed attitude, habit, and statistical behavior; thus, many traders struggle and never make it to being consistent. A process to achieve consistency in trading can be learned and followed; however, you must dedicate yourself to a new decision-making basis and habits to initiate this change.
The financial markets offer an excellent opportunity to earn stable returns. However, if trading endeavors were easy, nobody would ever go to work; however, they are learnable.
Multiple variables are crucial for controlling trading consistency, and we like to guide you through those and put together a graphic that lists the essential elements for trading success:
Vital Elements for Trading Success
You do not want to follow the crowd and learn classroom style. Trading concepts and plans need to be tailor-made for your specific wants and needs so that you can execute them at your best available days and times. In more than ten years of trading education, we have not found two traders with the same risk tolerance, affinity to assets, times of the day and week they are available, the income they want to make, account holdings, etc.
Hence, you need a mentor and concept to develop your decision-making basis on which you repetitively decide.
We translate this into a simple action:
“Let the chart tell when to buy or sell.”
However, if it were that easy, everybody would make money in the financial markets: The difference lies in the type of chart and indicators you base your decisions on.
Here are two chart examples using the NLT Timeless concept where candles are drawn by price movement and not by time. The first example covers Crude Oil Futures, and the second is the E-Mini S&P 500 Futures Contract.
Crude Oil Futures on the NLT Timeless Day Trading Chart

Situation-1: Buy_T> 90.45, a strong price move signal with volume support formulated a price threshold in the 5 a.m. candle, which was confirmed by the 6 a.m. candle and led to a long trade. You either traded to the gray point on the chart or trailed the trade with the red lines of the blue price frame around the up-move, where you exit after a 2-SPU price move is reached (some rules to learn, helping you to be a disciplined trader).
Situation-2: Multiple signals combined call for a short trade when the price of the next candle drops below $91.05 (10 a.m. EST), which it did in the 11 a.m. EST candle and led to a short trade, with the same conditions explained in situation-1.
The chart we use here for demonstration purposes is the most liked; it combines multiple NLT systems for the highest efficiency in day trading.
E-Mini S&P 500 Futures on the NLT Timeless Chart

The chart shows an up-move framed in blue with two trade potentials and a down move framed in red with three signals. Yes, by human nature, we want to participate in all opportunities, but now that you know your risk increases, you close the books after two wins.
Your takeaway:
- Operate with a proven high probability system
- Trade only at perfect signal combination and one or two times a day; your expected income is higher than multi-trading, as tempting as it will be
Why and how do swing traders act differently than day traders?
When you intend to hold positions for a couple of days, you decide from a higher level action point than a day trader is looking at, and you consider:
- 75% of the stocks move with the stock market index
- 5% follow independent underlying price action, like being crude oil related, instead of overall market related
- 10% show an independent intraday price movement that will not lead to a critical price move the next day
- 5% have an uncorrelated price move because that is news related
- 5% show an individual price move by a shift in institutional money, and those qualify for solid directional trading opportunities
What do you do if you follow the rule of – = +?
You trade when the overall market moves, period!
Is it not very tempting to find those 5% individual movers?
From an ego perspective, yes, but from a risk perspective, you go with the flow and trade less than more.
Market Analysis by the NeverLossTrading Top-Line Chart

The above chart highlights the E-Mini S&P 500 Futures contract price development from June 6, 2022, to September 6, 2022, on a daily chart, as a point of reference for the overall stock market development. In addition, we highlighted four trade situations and will discuss the appropriate decision-making:
Situation-1: On June 9, the system painted a sell signal (sell > $4,014.8). The price direction was confirmed in the price movement of the next day and led to a short trade. Dots on the chart showed the first and second targets of this trade. If a trader desired to trail the trade down, he would use the red line of the red frame.
Situation-2: A bottom price turning point got indicated, expressed by the orange buy signals.
Situation-3: Strong buy signals were confirmed, leading to an upward price move that could be trailed by the red line of the blue frame around the price move: NLT Double Decker study.
Situation-4: A price turning point at the top (orange signal), followed by two more sell signals confirmed.
Our charts offer a straightforward and effective way to analyze the overall market and its direction. When you consider that about 75% of the stocks’ show price moves in tune with the overall market, you know what to do and can act by letting the chart tell when to buy or sell!
Shorting stocks will not be allowed if you trade from an IRA; however, you can either operate with reverse ETFs or deal with the NLT Delta Force Options Concept.
Our blog and YouTube channel hold many examples of systems and decision-making points.
If you want to learn more about what we are doing and offer to you, write an email to:
contact@NeverLossTrading.com, Subj.: September 2022, and we take one hour of our time to talk to you and see if what we offer is a fit!
We calculate one hour at a value of $400.
Do not miss out; schedule now!
Take away:
- As a swing trader, you best act on overall moves by picking favorable stocks giving you a meaningful balance of risk to reward when the overall market moves.
- Focusing on stocks with individual price moves is risky
- Trade only when the market moves and cover long and short opportunities with appropriate concepts.
What to do if you are a long-term investor and want to hold positions for weeks and months?
At this time and stage of the stock market development, if you follow this strategy, you have either already lost 25% of your investment money, and you better learn the following:
- Apply shorter-term trading strategies when the market is undecided about longer-term
- Participate in up and downside moves
- Have a hedge in place to protect yourself against another potential down move
- As an investor, you pick the opportunities the market allows, and you do not accept an unbalanced risk
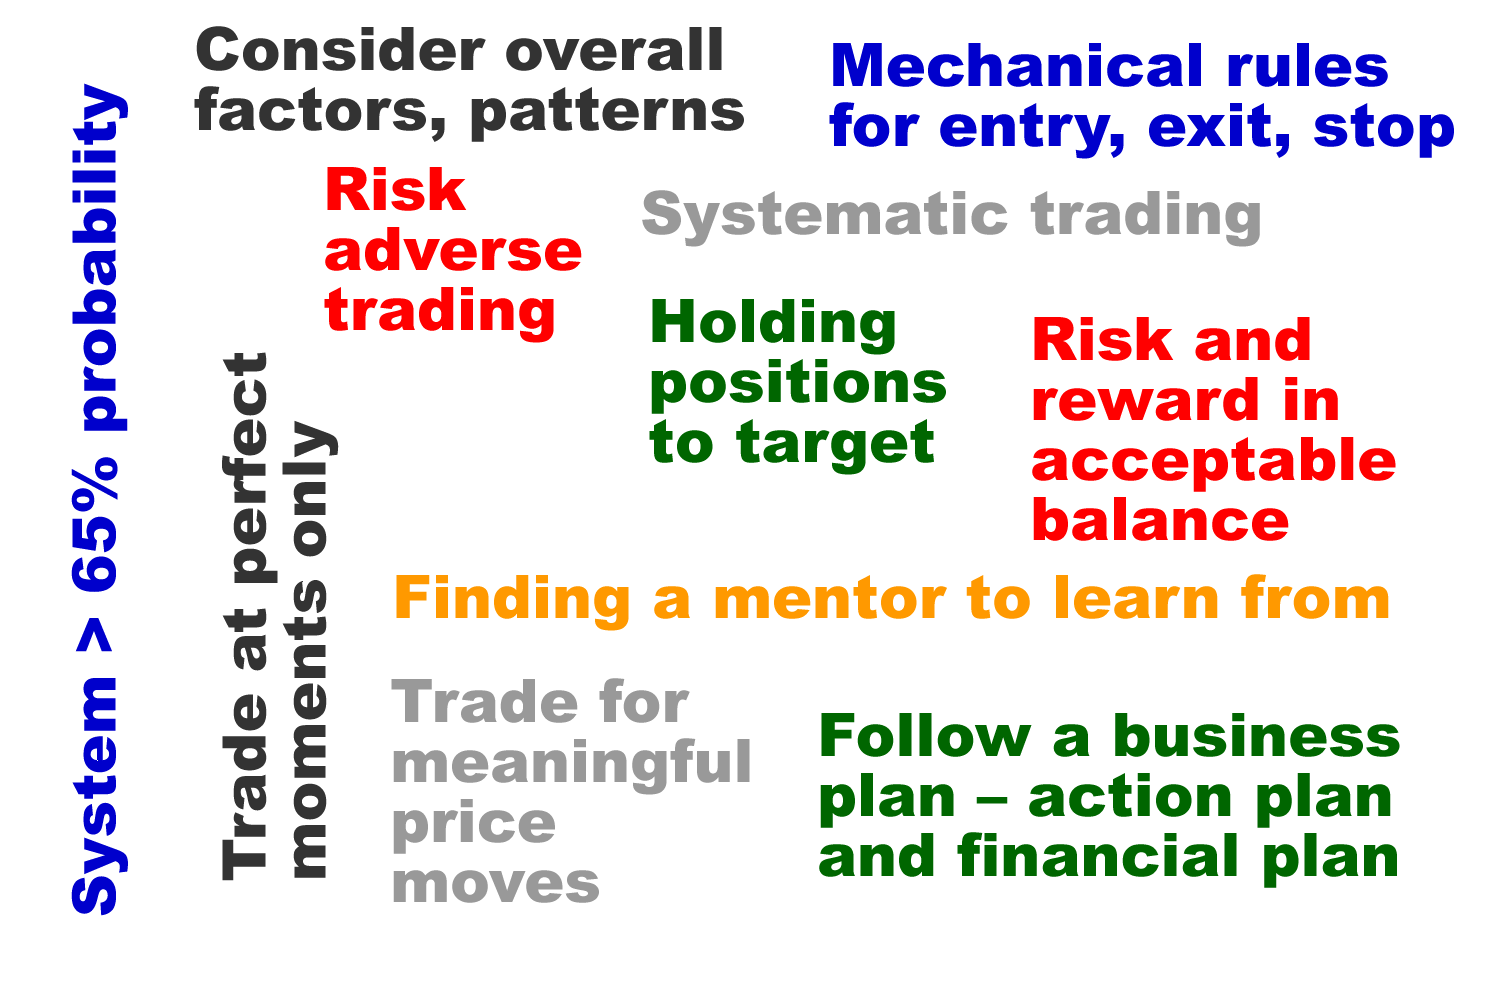
Are you ready for a shift change and learn that less can be more in trading, and are you prepared for:
- Acting with a system probability > 65%
- Mechanical rules for entry, exit, stop
- Trade at perfect moments only
- Consider overall factors, patterns
- Risk and reward in an acceptable balance
- Risk-averse trading
- Holding positions to target
- Do not add to losers
- Stick with a trading strategy. Follow a business plan – action plan and financial plan
- Trade for meaningful price moves
- Systematic trading
- Having a mentor to learn from
To succeed in trading, you best work with an experienced coach and learn much about trading. Our #1 competitive advantage is the support and customer service we offer. We work one-on-one with you to specify what we teach to your specific wants and needs; hence, if your knowledge base is not expanding rapidly, you are doing something wrong.
Ongoing education and mentoring are crucial to longevity in this business. Veteran traders have been through more ups and downs than you can imagine. So, experienced pros have probably experienced it whatever you’re going through.
If you are ready to make a difference to your trading:
We are ready to share our experiences and help you build your trading business. Trading is not a typical career, and you best learn from those who are long-term in this business to cope with the rollercoaster of the financial markets. We are here to help and provide feedback on what you might be doing right or wrong.
Strive for improved trading results, and we will find out which of our systems suits you best.
We are happy to hear back from you,
Thomas Barmann (inventor and founder of NeverLossTrading)
Disclaimer, Terms and Conditions, Privacy | Customer Support

No comments:
Post a Comment