The team at Investing Target has just completed an ambitious project in record time. They’ve brought together eight of the industry’s most respected fund managers and educators to address how to trade in and out of earnings.
Embark on a dual educational journey with us today:
Trade Earnings Price Moves
Engage in directional trades during and after the imminent earnings season with our latest innovative tool: “The NLT Earnings Price Movers Concept.” Delve into the concept details below.
Complimentary Trading and Investing Magazine
Additionally, access a trove of invaluable insights from various viewpoints with the complimentary trading and investing magazine. Stay abreast of the dynamic financial markets landscape through Traders World Magazine #92.
Our feature article, “Maximizing Trading Results by Acting at Crucial Price Turning Points,” is prominently featured on page 30. Download the magazine for free.
Don’t miss out on this enriching experience that arms you with tools and perspectives to navigate the complexities of trading and investing.
Trade Earnings Price Moves
The NeverLossTrading Earnings Price Move Indicator is revolutionizing how traders identify and capitalize on price movements associated with quarterly earnings reports. This powerful tool gives traders a strategic advantage in navigating the dynamic world of financial markets.
On April 12, 2024, the inauguration of JPMorgan Chase Manhattan’s first quarter 2024 earnings reports marks the commencement of the new earnings season. With our latest tool, you can seize lucrative opportunities for weeks by initiating strategic directional trades.
At its core, the NLT Earnings Price Move Indicator highlights critical price turning points of specifically defined stocks associated with significant price moves after quarterly earnings declarations.
One of the critical features of the NLT Earnings Price Move Indicator is its ability to frame the price range of the candle associated with quarterly earnings, allowing traders to visualize the extent of the price movement triggered by earnings reports, providing invaluable insights into market dynamics.
When a stock experiences an NLT, buy or sell signal within the specified time frame or closes above or below the framed price range, it often signals a high-probability price move for one SPU.
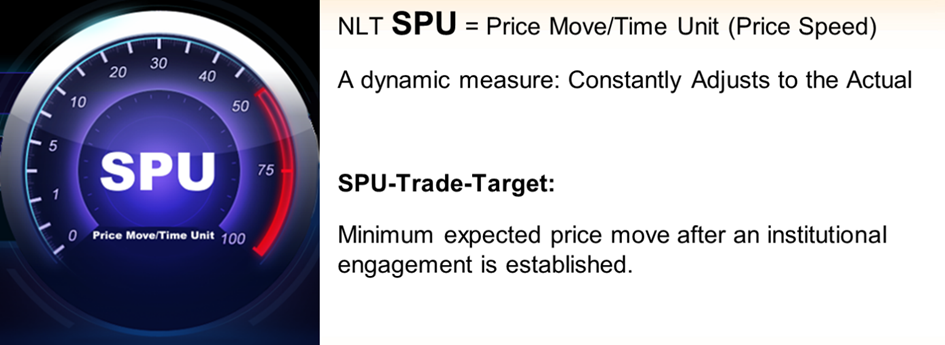
SPU is our measure to define how far a price move shall reach:
Traders can leverage this information to make informed trading decisions, such as entering or exiting positions or implementing hedging strategies to generate consistent profits.
We have developed the NLT Earnings Price Move Concept, a proprietary approach designed to capitalize on predictable price movements surrounding earnings announcements. However, not all stocks are created equal, and selecting suitable candidates for optimal results is crucial. The effectiveness of the NLT Earnings Price Move Concept hinges on carefully selecting stocks that meet specific criteria. To maximize the concept’s efficacy, we considered the following requirements:
NLT Earnings Stock Movers Requirements
Average Daily Trading Volume: Stocks must exhibit an average daily trading volume above 2,000 shares to ensure adequate liquidity and price movement.
Easy-to-Borrow (ETB) Status: We preferred stocks categorized as easy to borrow, allowing short trading potentials without obstacles.
Solid Options Chain: An extensive options chain is essential to facilitate short-trading strategies when stocks become hard to borrow (HTB) or to provide protection in the event of an adverse initial price move.
From a comprehensive panel of approximately 300 stocks that meet the criteria above, we meticulously narrow our focus to a select dozen stocks that exhibit the highest predictability regarding earnings price moves. These focus stocks undergo rigorous analysis and scrutiny to ensure they align perfectly with our trading objectives and criteria and derive from different industry sectors.
NeverLossTrading is not a vow of infallibility in trading; instead, it embodies the art of seizing high-probability price turning points, aiming for consistent income by skillfully averting drawdowns.
NLT Focus Stocks with Earnings Price Moves
Our focus stocks represent a curated selection of equities with consistent and reliable earnings price move patterns. Concentrating on these stocks, we aim to capitalize on weekly price move patterns precisely and confidently. On average, these focus stocks offer a price move potential of 5% return on cash, as measured by the NLT SPU Measure.
In this publication, we only disclose examples of one of our stock candidates, AAPL, and its earning price move patterns.
Chart Examples
Crucial for acting at earnings price moves are the following:
Confirmed directional price move indications by NLT signals in or outside the NLT Earnings Price Zone.
Candle close outside the specified earnings prize zone or carries an NLT signal.
Trade indications come from whatever comes first, while we avoid signals that gap more than 1/2-SPU in any direction and do not open new trades in NLT Purple Zones.
AAPL is susceptive to daily and weekly signals:
We expect a price move of about 2% value change on daily signals.
On weekly signals, we expect a price move of about 4%.
We take examples of earnings price moves over the last three years for daily and weekly opportunities and discuss the setups and how to act best.
AAPL, Earnings April 2021, Daily Chart
By printing an NLT Purple Zone over earnings and gapping up, no directional trade is acceptable, and we need to wait for the following qualified signal on the chart: Sell_S<125.17.
The daily chart on the earnings conference in July had again an NLT Purple Zone and no trading opportunity.
The following chart will show an exciting constellation:
Short signal after earnings by the candle on 4/29/22 closing outside the NLT Earnigns Price Range.
Confirmed buy signal on 5/3/22 that came to target and was followed by another buy signal, frightening the trade to come to a stop or price adjustment level.
However, the stop price level was not reached, and the price move commenced to its target.
The stop placement for the trade candle was at the low + 20% of one SPU.
AAPL, Earnings April 2022, Daily Chart
AAPL, Earnings February 2023, Daily Chart
The NLT PowerTower of February 2, 2023, was confirmed the next day, and the price move commenced to target. The chart shows another buy signal combination that was not confirmed.
AAPL Earnings, November 2023, Weekly Chart
In the chart above, you see a close above the critical price zone on day two after earnings, followed by an additional buy signal on 11/6/23, and the trade came to its system-defined target at the dot on the chart.
Next, we check on weekly price developments and setups, showing fewer gaps and with an even stronger predictability.
The first chart again shows the April 2021 earnings candle, and it is obvious how the next candle closes outside the earnings price range and leads to a 1-Weekly-SPU price move to the downside, which concluded the trade after two weeks at target.
Weekly happenings are easier to follow, and out of the twelve stocks we list as fitting for this trading concept, only two have allowed for entries at the daily level, and AAPL is one of them.
AAPL Earnings, February 2022, Weekly Chart
AAPL Earnings, July 2022, Weekly Chart
In July 2022, we saw a zone breakout with an NLT signal that came to its system-defined target (dot on the chart).
AAPL, January and May 2023, Weekly Chart
Hence, the new NLT Earnings Price Move Indication is best combined with other NLT Systems to act at crucial price turning points. The signals on the chart derive from:
NLT Top-Line (red, blue, orange, and Purple Zone)
NLT Swing Power (yellow)
NLT Price Move Indicator (green)
The time from entry to target varied between one and six candles, translating to a holding time of one to six weeks to close the open position at target. Stops were not infringed in the trades shown.
AAPL, Three Most Recent Earnings Calls, Weekly Chart
The chart presents a comprehensive integration of signal combinations with earnings data, offering valuable insights for strategic trading decisions:
However, in the preceding two earnings calls, opportune signals allowed trading opportunities with a 1-SPU target, seamlessly navigating through the NLT Purple Zone, which only occurred after the second candle concluded.
Additionally, supplementary signals further bolstered robust trades towards the designated targets.
Regrettably, the signal Buy_S>191.95 was overlooked due to our policy of refraining from holding positions over earnings announcements.
These examples serve as a testament to the efficacy of our systems in identifying pivotal price turning points, both post-earnings conferences and throughout the year, independent of such events.
For new NLT Top-Line signups, we’re delighted to offer the NLT Earnings Price Move indicator as a complimentary addition. For existing NLT users, the NLT Earnings Price Move concept upgrade is available for $2,999, including three hours of personalized education, chart setup, and watchlist training. This training encompasses the indicator’s integration and provides invaluable insights into curating an optimized watch list and NLT Alert (free for two months) for additional trading opportunities.
We hope these examples help you understand how our systems point to crucial price turning points after earnings conferences and throughout the year, outside of those events.
Investors can streamline their trading activities by focusing on a limited number of stocks, affording greater convenience and multiplying potential opportunities. With an average of 48 trading opportunities per year across 12 carefully chosen stocks, supplemented by ancillary signals, the potential for profitability is manifold.
If you’re prepared to seize this opportunity, don’t hesitate to reach out to us:
We’re eager to arrange an online consultation to tailor a system combination that aligns seamlessly with your unique trading style. We will also explain some rules we apply to our signals there.
Thomas Barmann (inventor and founder of NeverLossTrading)
Where to put your focus and how to trade now and in the new year to come?
Money moves in and out of assets daily, and with a solid system on hand, you can participate and profit.
NeverLossTrading Opportunities in 2022
There are a couple of crucial positive and negative factors the market will consider in their investment actions.
Core Influences on the Financial Markets 2022
Crucial Financial Market Influences for 2022
Long-term, our view for stocks is positive; however, we might see more substantial volatility on a shorter-term basis. Based on this, we focus on shorter-term instead of longer-term investments until the crucial factor of how a new breakout of COVID is resolved:
Day Trading: E-Mini S&P 500 contract, Crude Oil Futures
Swing Trading: Stocks for 1-10 days with NLT Indications
Timeless Trading: for Stocks and Futures (focusing on price-based developments rather than time-based ones, acting below the market radar).
The crucial part of the new earnings season will start on January 14, 2022, when JPM will report on the 4th quarter earnings of 2021. What will be, in particular, important is their outlook for several industry sectors.
At NeverLossTrading, we start to look about 20-trading-days (four weeks) in advance to the earnings call for price move indications and act on them. Here is an example for NVDA:
The chart indicated Buy > $257.09, and we only act if this price threshold is surpassed in the price movement of the next candle, which was the fact. The system also indicated an expected price move of 2-SPU, reaching $295.50 (achieved). After that, the stock price went even higher and then fell back to the stated level.
Typically, we do not want to open or hold speculative positions two days before earnings and the day after.
The reason for this:
High volatility and an unreasonable risk that stops getting triggered.
Market-plays by big money flooding or shortening supply and triggering strategic price moves, which bare an unbalanced risk for the trader or investor
What to do if you hold a long-term position?
You work with a form of protection by adding options to the stock for not carrying a risk outside a set risk tolerance: no more than 5% risk per position.
SBUX, NLT Top-Line October/November 2021
The chart shows, we had two NLT Top-Line signals indicating buy opportunities when the price threshold was surpassed in the price movement of the next candle: This was the fact, and the system displayed a price target of $115, with entry at $110.15, a 4.4% return on cash when buying the stock and multifold when trading with an options strategy. This NLT signal also indicated that the target price should be reached in a maximum of five days, which was the fact.
As a trader or investor, always consider: you are making an assumption about the future outcome of a trade, but you are only in control of the risk by applying risk-limiting strategies.
All of this is learnable, and we are here to help in a one-on-one session, transferring the appropriate indications, strategies and risk-liming actions: Skills, rarely to be found but learnable.
In the NeverLossTrading Alerts, we highlight stocks and commodities with a price move potential. Let us give you an example:
The NLT Alert reports on multiple levels are helping you to put those opportunities in action with conditional buy-stop or sell-stop orders. For example, the alert for November 5 showed two short trades: NFLX and BK. In the price continuation of the next day, only NFLX surpassed its price threshold and led to a trade.
NFLX with NLT Top-Line Signal for November 5, 2021
“Prediction is challenging, especially if it’s about the future;” hence, it is not uncommon for a company to beat expectations and share prices fall or report terrible earnings, and we see its stock rise.
Why does that happen?
It’s all about expectations, the appraisal, and the action of institutional money: This is why our indicators spot and follow institutional money flow to indicate with a high probability where the price move is most likely going to start and end.
Let us drill deeper by asking, who are the critical asset holders?
By category, we highlight the following key asset holders*:
Largest US-Money Managers
*Data based on the research of Nobel Living, LLC
Prop-Traders, are the ones that move the market by acting shorter-term and producing vast exchanges of assets. They employ the best analysts and make the shift changes you can spot and follow as a retail trader when you have the proper instruments on hand. The fund managers follow prop traders and money flows in and out of assets daily and intraday, leaving a trace you can follow. Your significant advantage: You can open and close positions much faster than institutions can. By the magnitude of their holdings, they have to scale in and out, not radically changing the asset price.
Theory: Key asset holders will have a solid need to re-balance their inventories. Thus, at a particular price expansion, they will either float- or shorten supply, which will result in an opposite directional price move that will then take away from our profits. Knowing this, we pre-calculate how far the expected price move will reach, and there we take profit, assuming it will retrace or reverse after.
Our brand name derives from the concept of repairing a trade instead of accepting a stop loss; however, Never Stop Loss Trading was a bit lengthy.
TradeColors.com is our introductory system to high probability trading. We always allow for upgrades; you only pay the difference if you start with TradeColors.com and upgrade after.
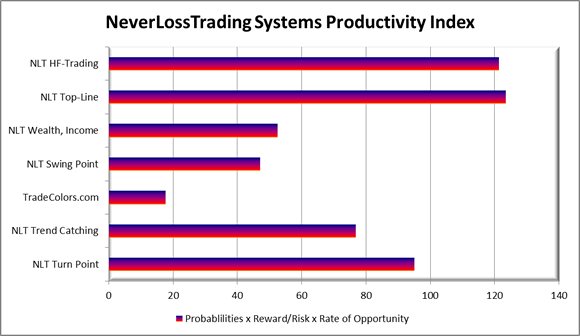
Many of our clients buy more than one system: Our systems are productivity tools, and by combining them, you produce a higher participation rate and higher returns.
NeverLossTrading Systems Productivity Index
Our tool to calculate the expected price move is the SPU = Speed Unit, and it indicates how far a price move shall reach until it comes to an end.
With our systems, you can operate with conditional buy-stop and sell-stop OCO orders (one-cancels-the-other). Without the need to be in front of your computer for the orders to execute. You are entering by price thresholds, ensuring that other market participants have the same directional assumption as you do and exit at the SPU target or adjust the trade at the stop.
NeverLossTrading SPU Explained
By a change in the frequency and amplitude of the price movement over time, we specify indications to act on high probability price turning points, applying mechanical rules rather than leaving room for interpretation.
However, are there stocks we put in focus for 2022?
This time, we have none; we take those opportunities on the go and let our indicators tell when to buy or sell!
For 2021, we made specified stock picks, and we are happy to share what happened:
The yearend for a strong stock market year is on the horizon, and the next earnings season, we will, in particular, look at the outlook of the key influencers in the financial markets:
JPMorgan (JPM), Morgan Stanley (MS), Goldman Sachs (GS), Bank of America (BAC). Aside from declaring their actual quarterly achievements, those companies forecast other company’s performance based on in-depth research and give expectation value for:
Earnings per share
Sales
Profit margins
Unit sales
These forecasts are considered in estimates by financial news organizations like Reuters and Bloomberg. At times, the numbers differ slightly, but they are generally very close.
The hype of earnings declarations comes about four weeks into the earnings season, when AAPL and AMZN report and give a core outlook for the sector. In addition, over 150 companies report earnings in a single day at the peak, offering you plenty of opportunities to participate in the markets with solid system indications on hand.
For you want to be ready, contact us for a demo and consulting hour:

 Download your free Copy