Summary: A new high probability day trading concept with clear-cut rules for entries, exits, and stops. Read on or watch the video…click.
There are multiple ways to decide on a trade. When using technical analysis, you have the following variables to determine a potential price move setup:
- Price Change
- Volume Change
- Volatility Change
- Or a combination of those

The majority of trades are determined by a change of one of those variables over time: Moving averages would be a typical example for tracking and deciding based on an asset’s price movement over time.
Our brand name derives from the concept of repairing trades instead of taking the stop loss (Never Stop Loss Trading was a bit lengthy). There are ways to integrate our trade repair concept into day trading; however, today, we want to keep it simple and focus on positive exits and stops based on OCO orders.
You most likely experienced that you predicted the future price move; however, on a counter-price-action, you got stopped, and you were out of a trade before it commenced in your predicted direction: Producing a loss instead of the desired win.
Like in a chess game: Acting with predictable moves is rarely a winning strategy.
If you use a dynamic, less predictable entry, exit, and stop definition, you certainly have the chance to increase your trading accuracy. Here an overview of the most commonly used trading decisions.
Share of the Usage of Trading Decision Making Variables

In the concept we introduce today, time is taken out of cohesion. This will make your decisions less predictable; however, the stronger argument of the idea is:
We are helping you to simplify your trading decisions by specifying conditions to execute bracket or OCO orders along with the price movement of underlying assets.
The system works for all asset classes: Stocks, Futures, and FOREX.
What we casually named variables are, in reality, results of an underlying change in supply and demand. In the base economic principle, price is a result of a change in supply and demand. Time is not considered as a determining factor. The model assumes that markets regulate themselves instantaneously by economic principles. Following this model, we predict price moves with high probability by the Timeless NLT Concept.
Excursion into the economic principle of an exchange:
Supply and Demand Correlations

The above graph gives a relation of the quantity offered and the resulting price. In the current situation, additional demand for a stock at $100 occurs. If no additional supply occurs, the equilibrium will move up to match supply and demand at $110.
The typical problem for a trader is: In hindsight, you know what happened, and we want to help you predict the future price happening with high predictability and frequently by our systems and concepts.
Money flow accepts price as the resulting variable of a change in supply and demand and specifies potential price move setups with clearly defined:
- Entries (price threshold)
- Exits (targets)
- Stops (wrong assumption)
With our systems and strategies, we want to help you to higher accuracy:
- Only accepting a trade when the direction is confirmed
- Exiting at a pre-defined target, prevening for the price to pull back and taking your profits away before you realize them
- Choosing an adequate stop, so you are not taken out of a trade by a too-tight stop and keeping reward and risk in a meaningful balance.
A Quick tip: buyers and sellers move the market; whoever has the upper hand moves the market in their direction.
Today, we want to focus on day trading and refer to swing trading or longer-term investing in separate documentation.
By the NLT Timeless Concept, we simplify life for you and let the chart tell when to buy or sell, specifying all decision making dimensions at once:
- Entry Conditions: Execute buy-stop or sell-stop orders at pre-defined price thresholds at assumed probability
- Exit Condition: When is the target reached
- Stop Condition: When are you wrong and exit
- Risk Management: Risk limiting and risk-adjusted by considering the Relation of (Entry – Exit) / (Entry – Stop)
When day trading for pre-defined price moves, positions are kept open for a couple of bars/candles but always close the same day.
One of the NLT Timeless Concept clients just said: “Now I am feeling comfortable, walking away from the trade without feeling the need for controlling it.”
Let us show you why by a chart example, using a combination of NLT Top-Line and Trend Catching indicators in a short video…click.
Crude Oil Futures, April 4 to 6, 2021, NLT Timeless Chart

Chart Analysis:
- Five trade situations show on the chart. Situation-5 at the recording was still open but came to target, so did the other four. Our average accuracy with this system is above 65%.
- Entry condition: when the spelled out price threshold is surpassed in the price development of the next candle:
Example: Situation-1, Sell < $60.49 was fulfilled in the next candle and lead to a price move to the target: dots on the chart. Targets are also spelled out in the upper left NLT dashboard.
- Stops at the red crossbars
- Never enter a trade at the exit candle: stop or target.
- The average trade produced a value change of the underlying contract of about $500.
- The chart combines two systems: NLT Top-Line and NLT Trend Catching, while in the recorded days, all signals derived from NLT Trend Catching.
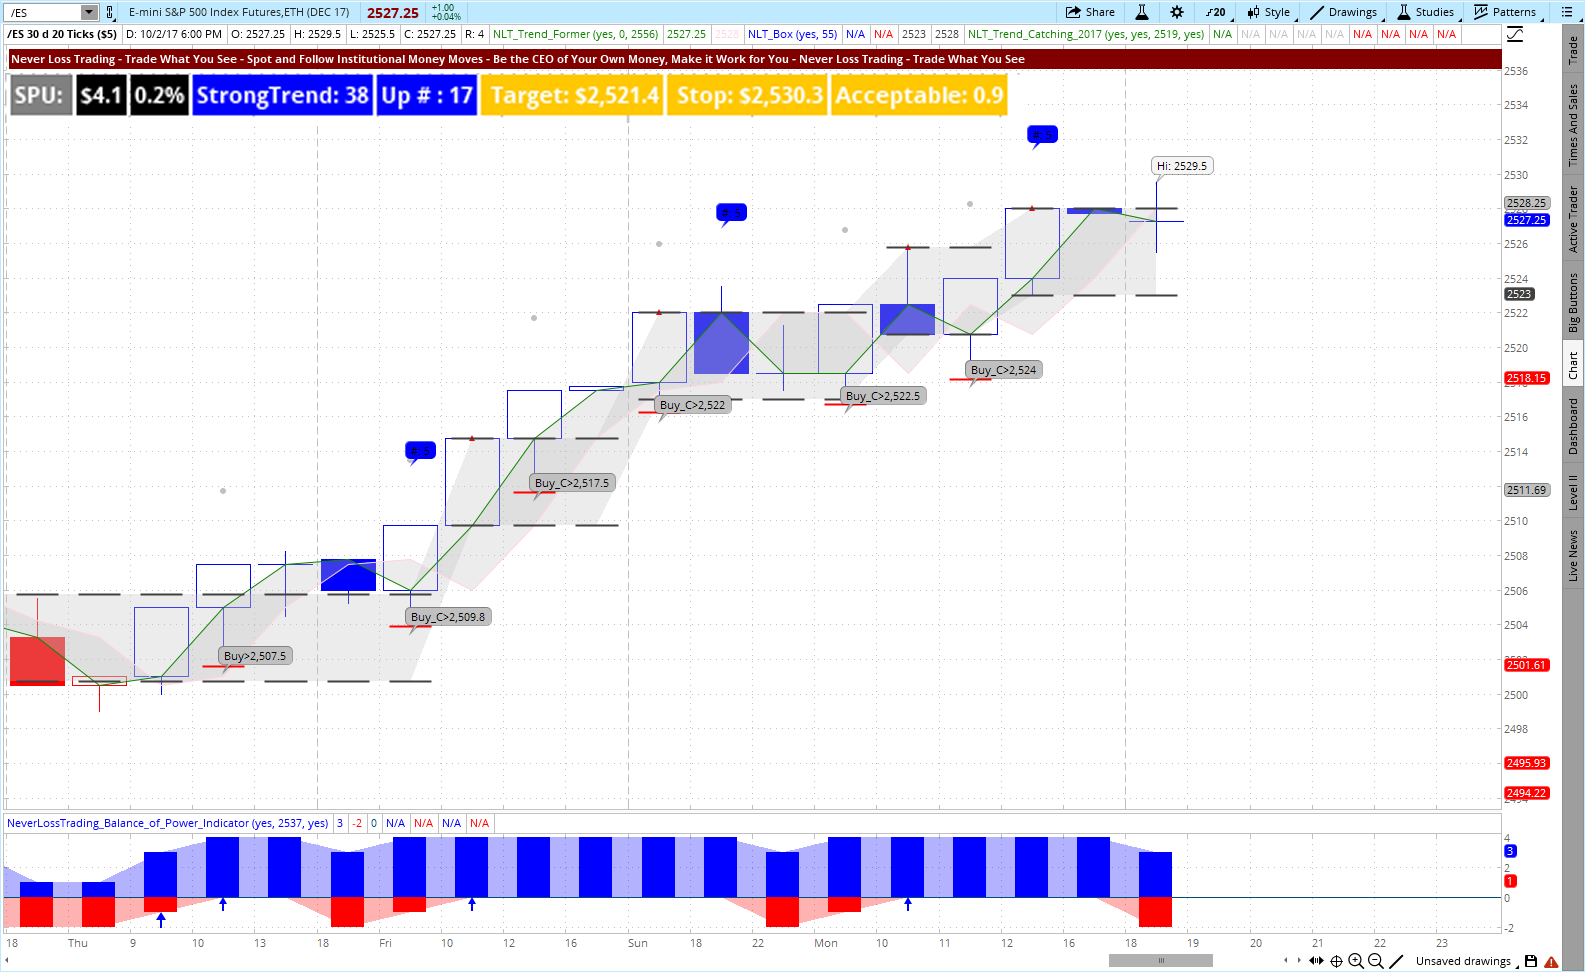
E-Mini S&P 500 Futures, April 5, 2021, NLT Timeless Chart

Chart Analysis:
- Three trade situations that all came to target.
- Situation-1, Buy > $4039.50 had a combination of indicators: NLT End of Purple Zone and Trend Initiation, confirmed by the next candle’s price movement and the trade came to target.
- We disregarded the following two signals: Crossing an NLT Lime Line and entering at the 3-SPU-Level from the trend initiation candle.
- Situation-2: had a reversal setup in the continuation of the upside price move, and it came to target
The question is, how do you administer the trades?
You place buy-stop or sell stop bracket orders and do not administer the trade by following specific rules, shown in the video…click.

The NLT Timeless Day Trading Concept is only one strategy of many; we teach in the hours of working together. Here a short overview of what you will all experience by operating with rule-based trading decisions as a day trader, swing trader or long-term investor in margin-, IRA, and even 401(k) accounts.
NLT Learning Program Overview

Let us be your guide to a consistent trader and investor and schedule a free consulting session, where you can see live what our systems can do for you:
contact@NeverLossTrading.com Subj: Consulting Hour
Working one-on-one spots are extremely limited: Do not miss out!
For more of our free publications and webinars…sign up here.
We are looking forward to hearing back from you.
Disclaimer, Terms and Conditions, Privacy | Customer Support