Spot and Trade Institutional Money Moves

Algorithmic Trading with Human Interaction for:

Day Traders, Swing Traders, Long-Term Investors

Showing posts with label Price Breakout. Show all posts

Sunday, February 2, 2014

Find Your Trading Opportunities for Stocks, Options, Futures, Forex


If trading was easy, nobody would ever go to work.

Trading requires you to handle a high amount of complexity in finding securities with potential price moves, making the decision to trade them with an adequate strategy at defined entries and exits.  


As a subscriber, we help you identifying assets on a potential institutional initiated price move for day trading, swing trading and long-term investing.

Imagine all the hours, you need to spend for selecting the opportunities, we deliver into your inbox. 

Find the alert that suits your trading: 
  • Day Trading Alert 
  • Stock Trading Alert (Swing Trading)
  • Long-Term Investor Alert
In this publication, we focus on the “NLT Long-Term Investor Alert” which includes:
  • Industry sector development overview.
  • Power options.
  • Futures and Forex in focus.
  • Selected stocks with options.
Developing the “NLT Long-Term Investor Alertforward, we added the following:
  • A filter for stocks with lower-price-move-expectation and unfavorable option stats; keeping our focus on stocks with favorable returns and easy adjustment possibilities.
  • A first round of chart evaluation to eliminate higher risk setups, reducing the number of symbols to consider. 
  • Approximation of the Reward/Risk setup into: Risky; Acceptable, and Favorable. Chart validation required. 
  • Indication of Put/Call sentiments: Bullish- (green) or bearish (red).
  • A stock market segment sentiment bar chart, plotting the relation of favorable up- and downside movers.
  • Price Pattern Evaluation: Explaining the price situation where the NLT signal occurred. All NLT signals need confirmation by the candle, which follows the trade initiation candle surpassing the set price threshold Buy> $39.29 e.g.  This week’s examples are: 
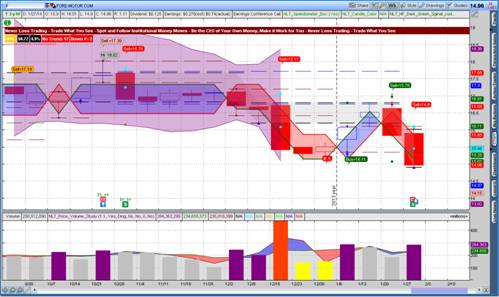
a.    Hi Earnings Breakdown: The stock price broke down even so 20% higher than expected earnings were reported: Bearing a reversal- or further breakdown potential. Please see the Ford example: 

 
“Never be late for a Trade: READ ON......click here !
 
Learn NeverLossTrading: Call +1 866 455 4520 or contact@NeverLossTrading.com

Tuesday, January 28, 2014

NLT Price Breakout Trading Concept Update


Last week, we launched the NLT Price Breakout Concept, which can either be traded as a standalone or in combination with other NLT-Systems or TradeColors.com.  

The system works for all asset classes and time frames.
 

The key question is: How and why can adding this study better your trading? 

To find an answer, we best look at a chart and follow the breakouts and reversals: 

Prior, we reported how it worked with stock trading, today we test it on Futures. 

Emini S&P 500 Futures on the 10-Minute NLT Top-Line Chart


Take a look how this new cyan color NLT Price Breakout Zone accelerated price breakouts and attracted price reversals.

When you add up the trades form yesterday US-day session, to today, 10:30 a.m. ET, we already mark a trade potential of 30-points or $3,000, when trading two contracts.

A pretty quick payback of the indicator, don’t you think so?

The study surely works on daily charts and other intraday time frames.


If you feel this concept is right for you:

Call us at +1 866 455 4520 or contact@NeverLossTrading.com

Good trading,

Thomas

NeverLossTrading

Tuesday, January 21, 2014

Trade Price Breakouts and Reversals for Stocks, Options, Futures, and Forex

What would it do for your trading, if you knew major institutional supply and demand levels? 


Now: Take advantage of seeing institutional support and resistance levels for all asset classes: Stocks, Options, Futures, and Forex, right on your chart.

As day trader, swing trader or long-term investor, you can:
  • Trade the breakouts.  
  •  Trade the reversals.
The NeverLossTrading Price Breakout Concept helps you to visualize critical price zones right on the chart for all desirable trading time- or tick-frames.

Check our website..click and the following examples: Experience what you can achieve.  

GOOG Daily Chart


Capture GOOG price moves between $17 and $50 per trade, allowing you 2% to 5% return on cash invested in one to five trading days. 
Apply the NeverLossTrading way for Stocks, Options, Futures, and Forex.

Crude Oil Futures 4-Hour Chart


Each of these trades is worth $700 when only one contract is traded ($3750 maintenance margin).  

S&P Emini Tick Chart


Seven trading opportunities for one- to five-points with the S&P Emini Futures; just in one day. 


Be part of the NeverLossTrading Price Breakout Concept and receive: 
  • Software installed on a free trading platform, providing you real time data.
  • Trading grids installed for you to view breakouts and reversals.
  • No need to change brokers.
  • 4-Hours of Individual Training, focused on your wants and needs.
  • 1-Month with Your Questions Answered.
  • 50 Pages of Documentation plus individual training videos.
  • 30-Days Free Alert Report for Assets with Price Breakouts.
  • PayPal option: Pay after 6-months with no interest.
Sing up at our website: http://neverlosstrading.com/Price_Breakout_Concept.html 

For more information: Call +1 866 455 4520 or contact@NeverLossTrading.com