Spot and Trade Institutional Money Moves

Algorithmic Trading with Human Interaction for:

Day Traders, Swing Traders, Long-Term Investors

Friday, April 15, 2022

Bitcoin NeverLossTrading Style

 Bitcoin is the world-leading cryptocurrency, and there are multiple ways for you to participate in the underlying price moves.  

Bitcoin NeverLossTrading Style

Upfront, in case you do not know us: the name NeverLossTrading derives from the concept of trade repair instead of accepting the stop loss, and Never Stop Loss Trading was a bit lengthy. We trade our own accounts and offer high-probability algorithmic trading systems and strategies for private investors.

People sometimes ask why it is called cryptocurrencies: because they use cryptography to keep it secure. There are no physical bitcoins; only balances are kept on a public ledger that everyone has transparent access to (although each record is encrypted). Bitcoin is the most popular of hundreds of other cryptocurrencies and is abbreviated as BTC when traded. At the time of this article, for trading one BTC, you need about $40,000. However, you can buy fractions of Bitcoins: One Bitcoin divides into 1,000 millibitcoins (mBTC); 1,000,000 microbitcoins (μBTC); or 100,000,000 satoshis (the name of the unknown inventor).

A simple and effective way for trading Bitcoin is to operate with the BITO EFT. ProShares is the fund manager of BITO and bases the ETF value on relation to investments in the Bitcoin Futures. The ETF provides a solid options chain and, on an average day, exchanges more than 10 million shares. Currently, one share of BITO is worth about $25 and offers a daily value change between 5% and 10%. Hence, an instrument that gives you multiple opportunities as a trader to participate in the volatile moves of the underlying. One thing to consider: when trading ETFs, you need to comply with SEC regulations for day trading and shorting stocks; you need account holdings of a minimum of $25,000. BITO is usually HTB (hard to borrow), and as such, you best operate with an options strategy to bet on a falling Bitcoin value with this instrument.

For retail traders, Bitcoin offers the possibility to participate in extraordinary strong price moves. To demonstrate the variability of the Bitcoin price, we compare it in a chart to the S&P 500.

Bitcoin Futures and S&P 500 Annual Price Development
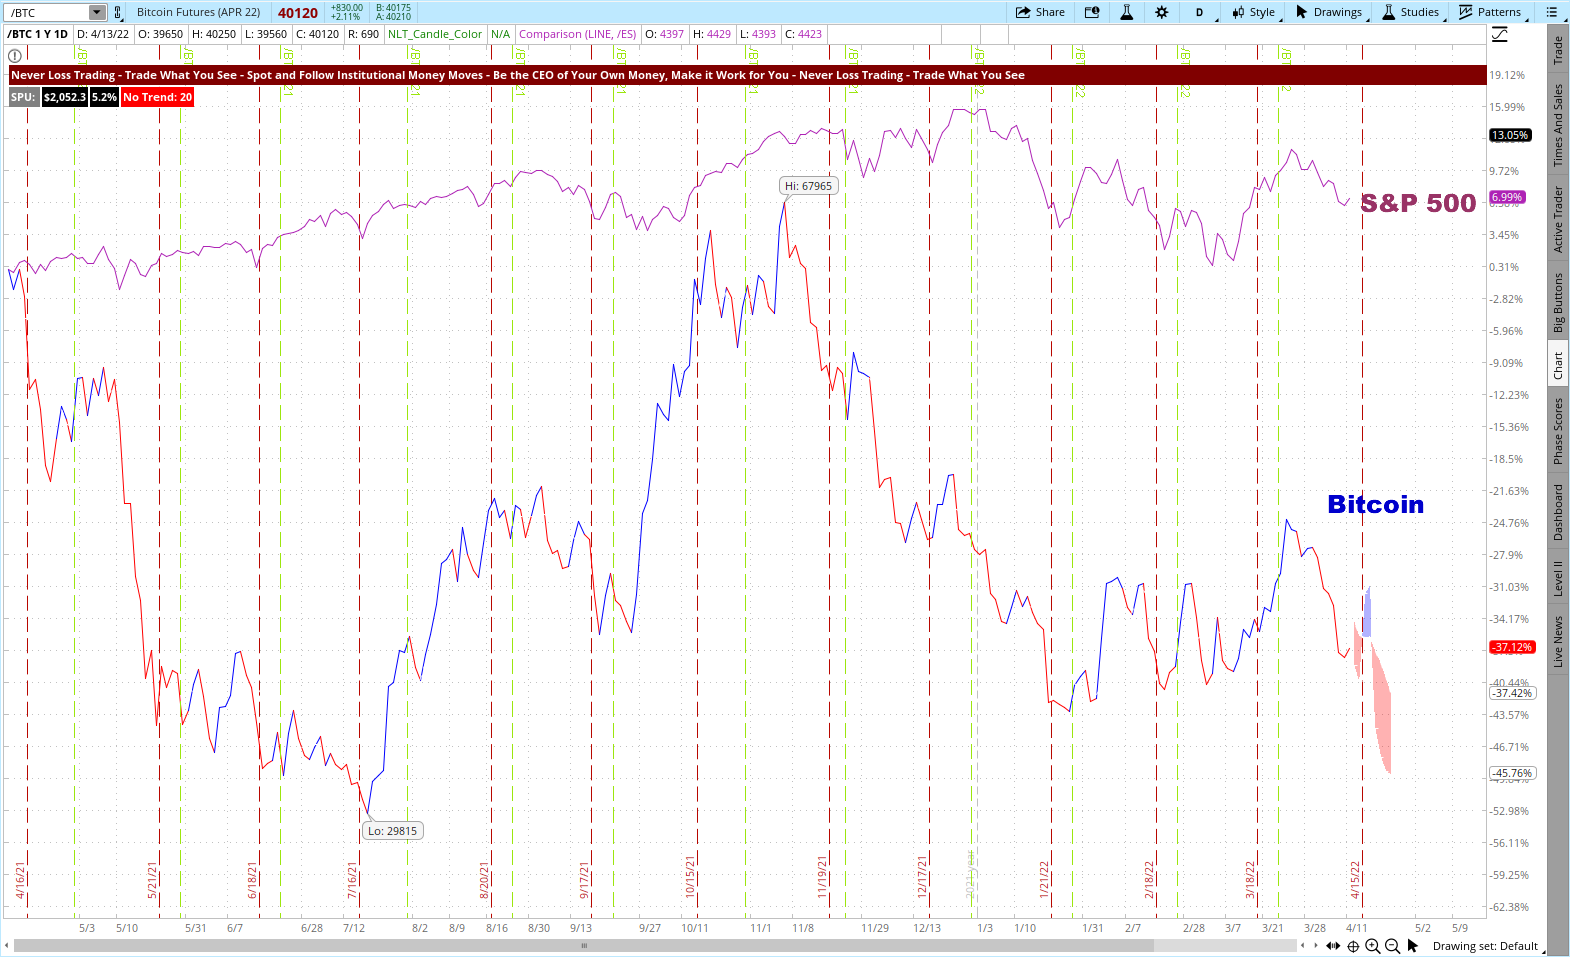
Twelve Months Price Development of Bitcoin and the S&P 500

The chart shows the S&P 500 spaned a price band of 13% over twelve months, while Bitcoin Futures had a 60% variability. Hence, speculating for up and downside moves should be part of your strategy.

Futures traders have an easy way of trading for rising and falling prices. They have the choice of two instruments for participating in the price move of Bitcoin, both issued by the CME:

/BTC, the full contract is based on five Bitcoins. A value change of $5 represents one tick and shifts the future value by $25. The actual margin requirement for trading this contract is $75,000, and you control a notational value of $200,000 (five Bitcoins, each valued at $40,000).

/MBT, the Micro Bitcoin Futures Contract, with a contract size of 0.1 Bitcoin. Again, a value change of five represents one tick and shifts the value of the underlying contract by $0.5. For trading this contract, your broker will reserve a maintenance margin of $1,500, and you control a notational value of $4,000.

The question is, how to best forecast the price move of Bitcoin?

We recommend the NLT Timeless Concept and a combination of the NLT Trend Catching and SPU Move indicators, which helps you to find and act at crucial price turning points.

With the NLT Timeless Concept, you cut price moves into manageable sub-increments that simultaneously keep risk and reward in compliance with the system’s expected high probability forecast at or above 65%.

Hence, you will trade with a positive expectation, but you must learn and comply with the rules. Therefore, we teach the concept one-on-one on your best available days and times, tailoring our systems and concepts to your wants and needs.

We best explain some of the details to learn in a chart example, picking the /BTC Futures Contract. Then, you will see five situations we discuss based on a mechanical approach, where we take every signal as valid, and you learn in the mentorship which ones are higher probable.

/BTC on the NLT Timeless Chart

Bitcoin Futures on the NeverLossTrading Timeless Chart

Situation-1: We see two buy signals, the first one on February 24, 2022, and the second on February 28; both got confirmed in the price movement of the next candle and came to target (gray dot on the chart). Two winning trades.

Situation-2: Short signals and a price move to the red dot. A winning trade.

Situation-3: Long signal and a price move to the blue dot on the chart. Immediately after a short signal, which got stopped, producing one winning and one losing trade.

Situation-4: Three long trading opportunities, and all came to target.

Situation-5: The first sell signal came to its stop at the red crossbar – and we would not take this signal for multiple reasons. The second signal came to target, producing one winning and one losing trade in this sequence.

In summary: Eight winning and two losing trades between February 24 and April 11, 2022. Each transaction was good for a value change of about $10,000. 

Next, we pick a day trading example for the /MBT:

/MBT on the NLT Timeless Day Trading Chart

Micro Bitcoin Futures Contract on the NeverLossTrading Timeless Chart

On April-4, you see a long opportunity that came to target after the re-opening of futures trading at 6 p.m. ET on April 5.

April-5 shows a short signal that came to the red dot target.

April-6 shows multiple short signals that all came to target.

Three solid winning days. Trading one contract produced a value change of about $70 in each situation.

Let us now take a look at the ETF development on a swing trading basis and one rule to consider: do not trade candle #5, which is highlighted for this reason:

BITO on the NLT Timeless Chart, April 2-11, 2022

BITO ETF on the NeverLossTrading Timeless Swing Trading Chart

The chart shows seven winning and one losing trades.

When we get your interest in this, contact us, and we will show you live what our system can do for you.

contact@NeverLossTrading.com, Subj.: Demo

We have more than ten years in business and helped many traders get independent in the financial markets. If you like to read more about our concepts, subscribe to our free trading tips and check our blog.

Trading is not an easy career: when you add up what it costs you to not act at high probability price-turning points, you might be open to investing in a high probability system and appropriate education.

We highly propose following a business plan for trading success that shall entail:

  • Written rules on when to trade and when not
  • A financial plan that breaks down the number of trades needed to come to budget.

See our overview of learning elements we will go through in our coaching and training sessions, and we will focus with you on any asset class: Stocks, Options, Futures, and FOREX. The choice is yours. This is what we will share.

  • Acting with a system probability > 65%
  • Mechanical rules for entry, exit, stop
  • Trade at perfect moments only
  • Consider overall factors, patterns
  • Risk and reward in an acceptable balance
  • Risk-averse trading
  • Holding positions to target
  • Do not add to losers
  • Stick with a trading strategy. Follow a business plan – action plan and financial plan
  • Trade for meaningful price moves
  • Systematic trading
  • Having a mentor to learn from

Here is a schematic:

NeverLossTrading Learning Elements

The frightening truth: 76% of private investors lose money!

We base this number on a study we conducted, and if you like to experience why: write us an email, and we will share the details: contact@NeverLossTrading.com Subj.: 76%. 

Who had assumed such a high rate of losing traders?

If you want a different trading career, find a solid training and coaching program and contact us to find out what could work for you:

contact@NeverLossTrading.com Subj: Demo.

We are ready to share our experiences, helping private investors to build their trading business. Trading is not a typical career, and you best learn from those who are long-term in this business to cope with the rollercoaster of the financial markets. We are here to help and provide feedback on what you might be doing right or wrong.

Make a change to your trading results, and we will find out which of our systems suits you best.

We are happy to hear back from you,

Thomas Barmann (inventor and founder of NeverLossTrading)

www.NeverLossTrading.com

Disclaimer, Terms and ConditionsPrivacy | Customer Support

Saturday, April 9, 2022

Trading Knowledge & Time

By entering the trading world, you are getting into a professional business, were the ones taking the other side of your trade are prepared to win. Hence, you need to ask yourself if you are fit for the task and ready to stand your ground.

Let us invite you to understand what it takes to be a successful trader or investor who takes money long-term from the markets.

Trading Knowledge and Time

Institutional activity dominates the financial markets: stocks, commodities, currencies, and treasuries and when you can spot and follow institutional investment activities, you can build yourself an edge: By the magnitude of institutional buy or sell programs, they scale into positions to not radically change the markets. As a private investor, you can open and close entire positions on the spot, and your edge can be speed in and out of a trade, but you need to pick the right side.

Trading is not a business where the fruits hang low. It is a professional business, and you better enter with a sound understanding, else money goes quick.

Let us start with a shocking statement: 76% of retail traders lose money, and there are many reasons for this. We are happy to share our study. If you are interested in how we come up with this statement, write us an email:

contact@NeverLossTrading.com, Subj.: 76%

For this publication, we take this as a given.

Malcolm Gladwell’s book “Outliers: the story of success reports what sets high achievers apart.” Gladwell says it takes 10,000 hours of intensive practice to achieve mastery of complex skills in a subject matter. Those are a lot of hours ahead of you; however, there is hope:

A coauthor of Gladwell, Anders Ericsson, a professor of psychology at Florida State University, added another critical variable that Gladwell did not focus on: how good a student’s teacher is. Hence, practice is essential, and it is surprising how much it takes to master something complicated. But Ericsson’s research suggests that someone could practice for thousands of hours and still not be a master performer. They could be outplayed by someone who practiced less but had a teacher who showed them just what to focus on at a critical moment in their practice regimen.

In essence: you have to be good at what you do to perform, and you better find somebody helping you to obtain the right skills, mindset, and dedication to master trading or investing: Just loading an app on your smartphone and pushing the buy or sell button does not qualify you to make money from the financial markets, but with the proper teaching on hand, you can certainly shorten your fairway to trading success.

We are more than ten years in the trading education business and trade our accounts daily. From our experience, we put together a matrix with four quadrants by the dimensions of:

  • Knowledge is the understanding gained through learning or experience in making trading or investing decisions and applying appropriate risk-limiting strategies.
  • Time Invested, we measure the hours you spent familiarizing yourself with trading and investing in successfully performing the skill.

We see the difference between trading and investing in the time you hold an open position. Trading specifies shorter-term, like day trading or swing trading. When investing, you have open positions for multiple weeks, months, or years; however, behavior-wise, both require the same knowledge and skills. As a short-term trader, you give yourself less time for sound decisions.

Trading and Investing Behavior & Time

Spinning a matrix of knowledge and time, we see four quadrants:

We chose the following nomenclature for the quadrants:

Matrix of Trading Knowledge and Time Invested

Losses: As a trader, you need a broker, no other qualification is required, and you can risk your money in the financial markets. Hence, there is a constant influx of traders with little experience that empty their trading accounts quickly by not knowing what they are doing.

Frustration: In this quadrant, we find long-term familiar people with the markets (I have 30 years of experience), but they learned very little of what is needed to be a successful trader, and as such, they possess little knowledge of how to risk-limit and size their investments. The worst traders have winning trades and such they celebrate their occasional success but do not make money trading long-term.

Gambling: There, we find people who have a sound knowledge of complex ways of trading or investing, but mostly they do not spend enough time learning money management, risk control, or following a business plan (action plan and financial plan). They produce winning trades but then hurt themselves by overstating their risk and giving back gains by significant losing positions. Hence, gamblers give their money long-term to the bank.

Success: Here, you find a small group of people with a sound knowledge base, familiar with trading/investing, and the financial markets allow them to be independent. They understand probability thinking and long-term take money from the markets.

After explaining the quadrants, let us put numbers to them, expressing the share of traders in each:

Share of Traders in the Knowledge and Time Invested Matrix

The shocking truth: only about 5% of the traders make money from the markets’ long-term, and if you want to be part of those, let us share some of the elements of knowledge and time investment to compare where you stand today and where you want to be. Are you following these success principles for trading and investing decisions?

Success Principles for Trading

  • Decide by a system > 65% probability of winning
  • Mechanical rules for entry, exit, stop
  • Trade at perfect moments only
  • Consider overall factors, patterns
  • Risk and reward in an acceptable balance
  • Capital preservation by risk-averse trading
  • Holding positions to target
  • Do not add to losers
  • Stick with a trading strategy and system
  • Follow a business plan – action plan and financial plan
  • High Participation Rate (number of system opportunities you participate in)
  • Trade for meaningful price moves only
  • Multiple streams of income to engage 80% of your capital
  • Apply risk-limiting strategies (day trading, stocks with options, options)
  • Finding a mentor to learn from

We sure can fill pages of details with what all this means. If you want to learn more about our approach, check out our latest book:

Read about what is needed to reach financial market success with many details and examples, published on Amazon as paperback and Kindle. A guideline to algorithmic-based trading/investing for retail traders: letting the chart tell when to buy or sell!

Let the chart tell when to buy or sell: Here are some examples of how this can go into action as a day trader or swing trader. For longer-term investing articles, check our blog for the topic Retirement Investment, e.g.

  1.  Stock Examples

Starting with a day trading example for AAPL. The chart applies what we call the NLT Timeless Concept: Instead of drawing the price happening over time, we trade for price changes and, with that, prevent long candles with unfavorable risk-reward setups:

AAPL NLT Timeless Trend Catching Chart, January 24, 2022

AAPL on the NLT Timeless Chart

A price threshold is formulated for every trade situation: buy > and sell <. This way, you can operate with buy-stop and sell-stop orders and only enter a trade when the threshold is surpassed in the price movement of the next candle. When you add up winning and losing trades, you see an example of high probability trading where we strive for winning 65% and above.

The chart shows pure mechanical appraisals of trade situations; however, in the mentorship, you will learn the rules of how to pick higher over the lower probable cases.

Let us now take a time-based example for swing trading: holding a position between one and ten days.

AAPL NLT Daily Trend Catching Chart, Jan./Feb., 2022

AAPL on the NLT Trend Catching Chart

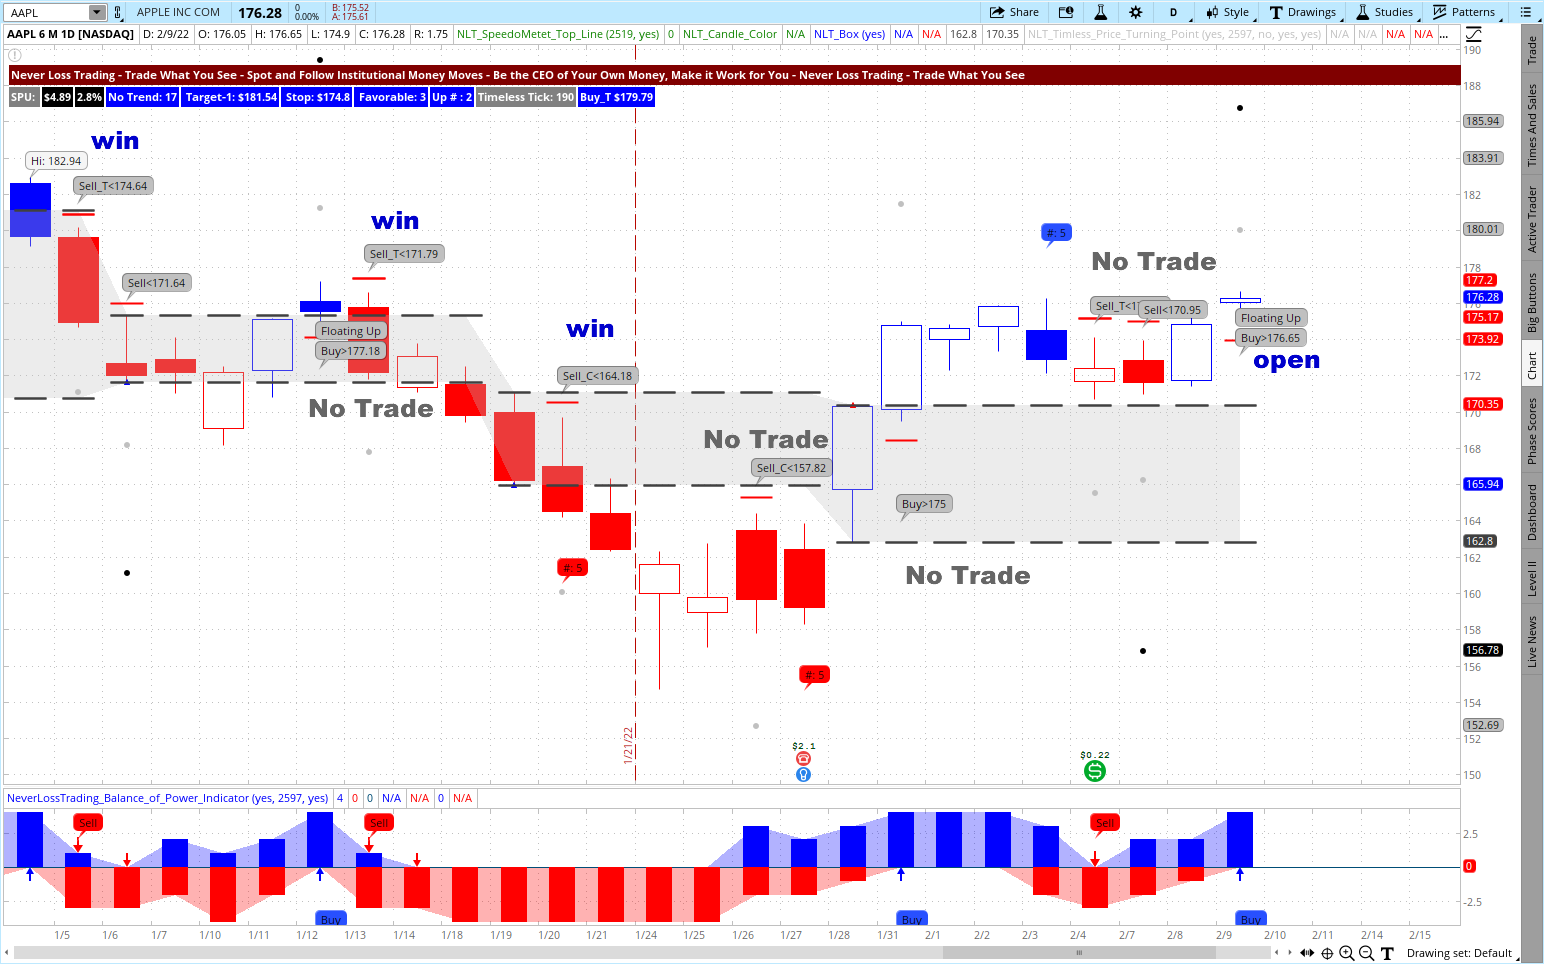
The chart shows multiple situations from January 4 to February 9, 2022, where it reads no trade: A signal spelled out a trading opportunity; however, the direction was not confirmed in the price movement of the next candle as such, no transaction got accepted.

If you trade from an IRA, you would not be able to follow the short signals on the chart (SEC regulations do not allow short selling in IRAs). However, we teach appropriate Options trading strategies that you can profit from when stock prices fall.

  •  Futures Trading

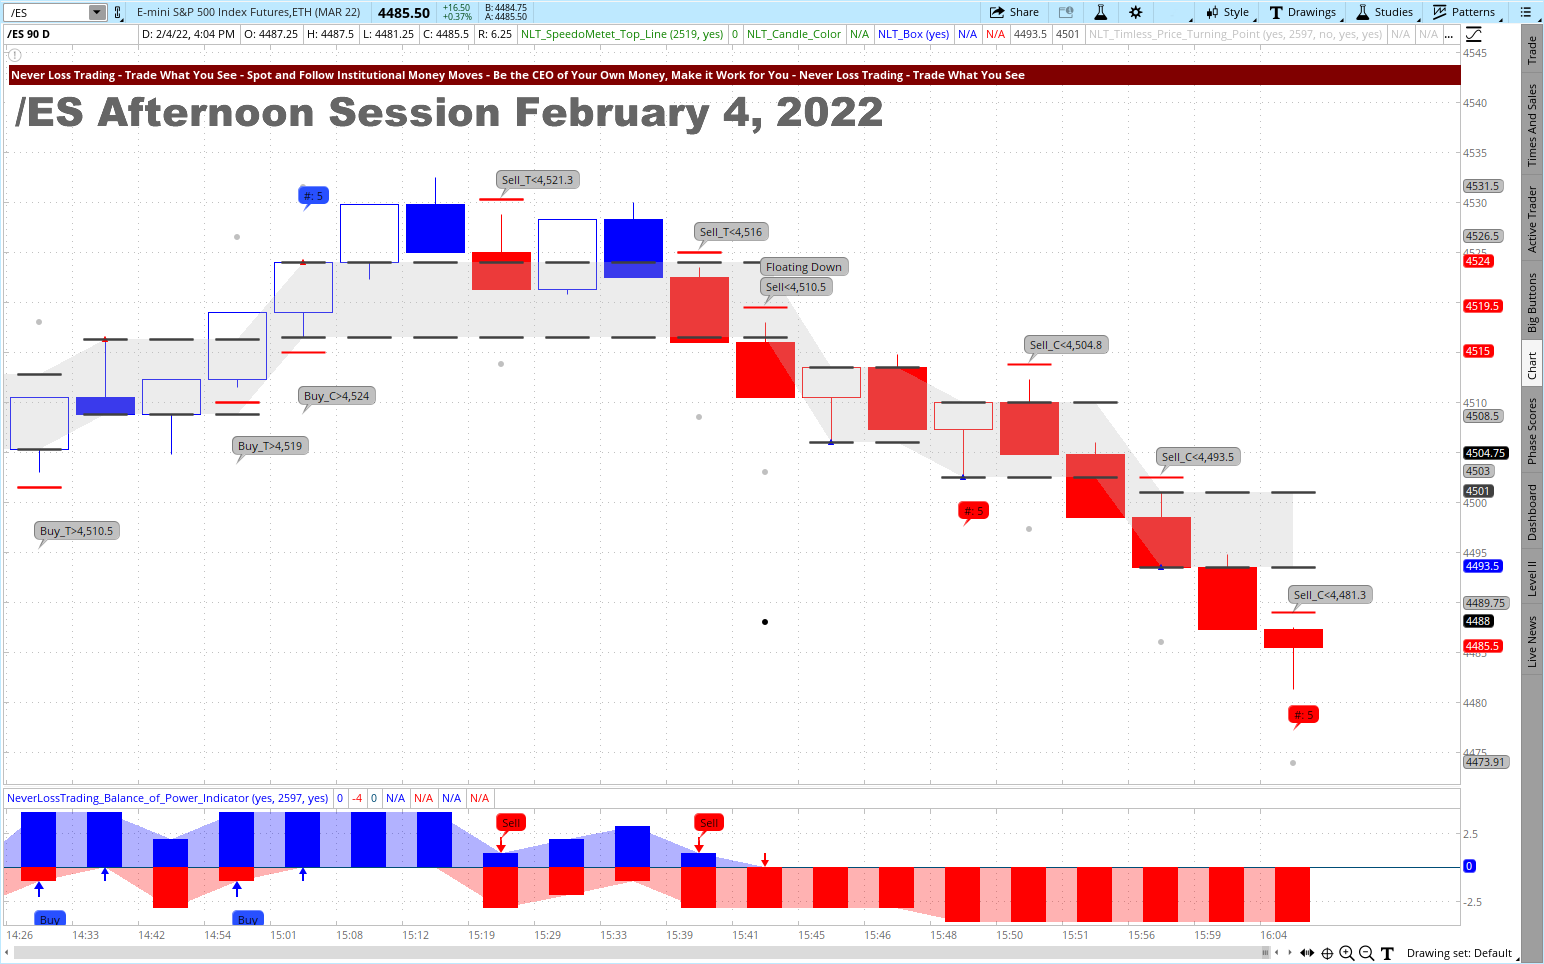
The E-Mini S&P 500 Futures contract is an instrument many retail and professional traders operate with. Hence, let us pick a day trading situation and a longer-term trade setup:

NLT Timeless Trend Catching Chart for the E-Mini S&P 500

E-Mini S&P 500 Futures Contract on the NLT Timeless Chart

The chart shows multiple buy or sell opportunities:

  • Each opportunity formulates as a buy > or sell < a system-defined price threshold, allowing you to enter the trade direction only when the direction is confirmed.
  • Each price change ends at the target (dot on the chart) or the red cross line, indicating where to stop.
  • The system probability is ≥ 65%. The difference between entry to stop is about 1.2-times the difference of entry to the target. In the chosen example, entry to target was $350, and the risk was $420. Adding up three trades: two winners ($700) and one losing trade ($420), gives you a positive expectation of $280 per contract on a set of three trades.

Daily NLT Trend Catching Chart for E-Mini S&P 500

E-Mini S&P 500 Futures Contract on the NLT Trend Catching Chart

From left to right, you see:

  • A trade to the downside, breaking the price containment NLT Box and coming to target: gray dot.
  • Two trades with “No Trade” indication: on the first trade, the target was cut short by a box line – no trade. The second signal was not confirmed.
  • What follows are two winning trades that came to target.
  • Then two “No Trades” where the threshold did not get surpassed in the next candle.
  • A winning trade on Buy_T> $4,426 that came to target three candles after entry.
  • An open trade that did not reach its target or stop. We set the stop by the red crossbar on the chart.
  • FOREX

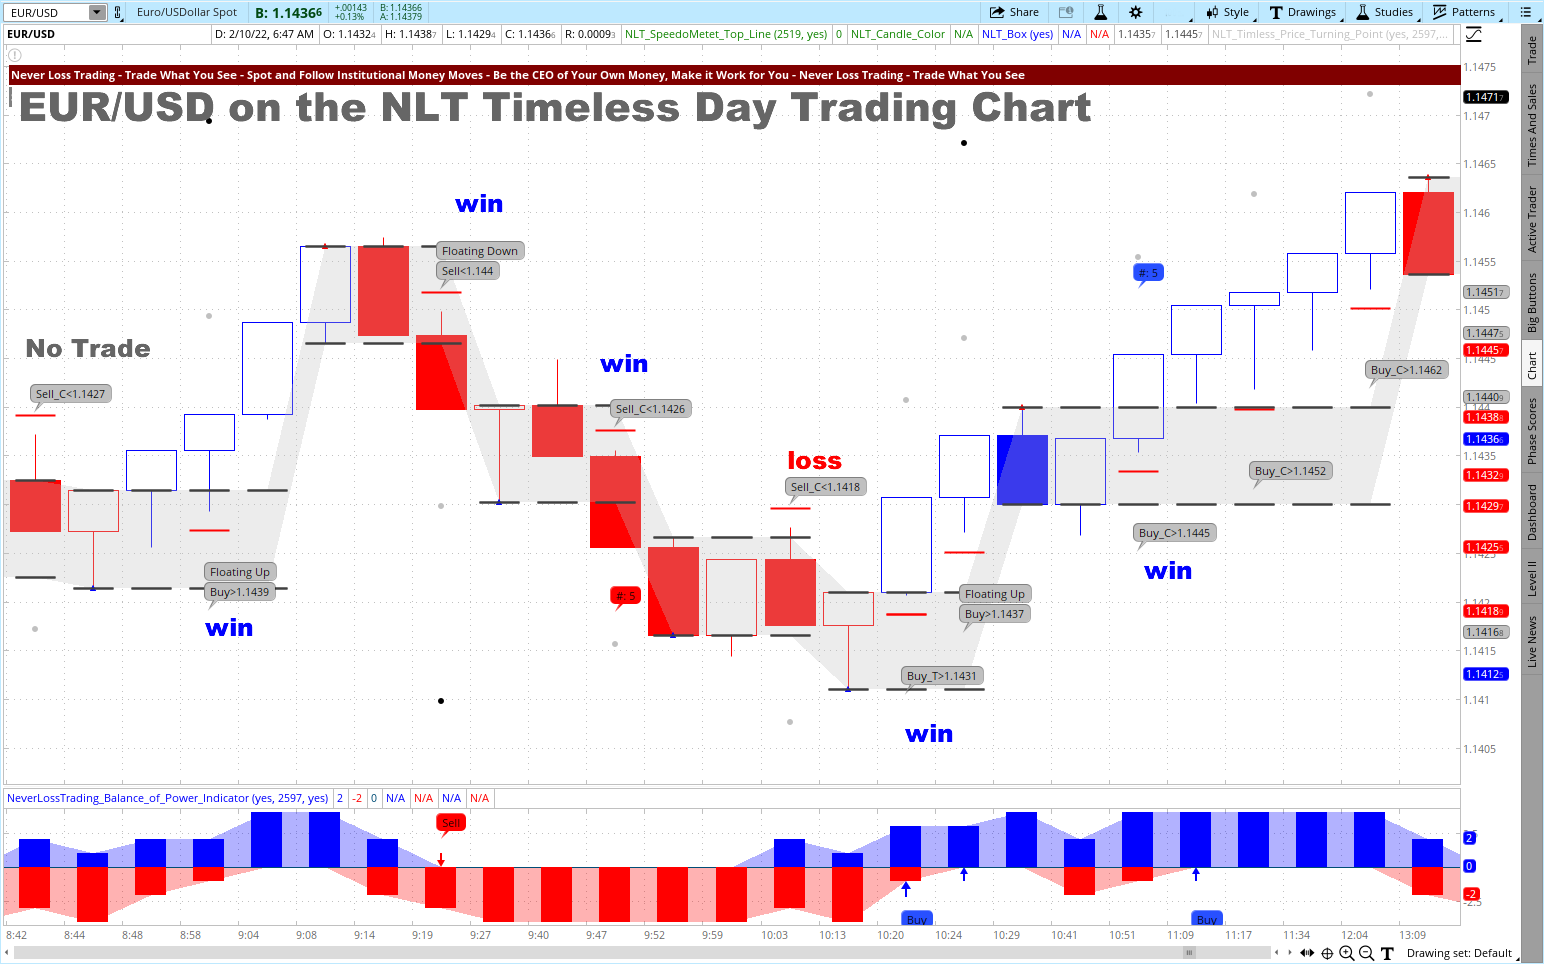
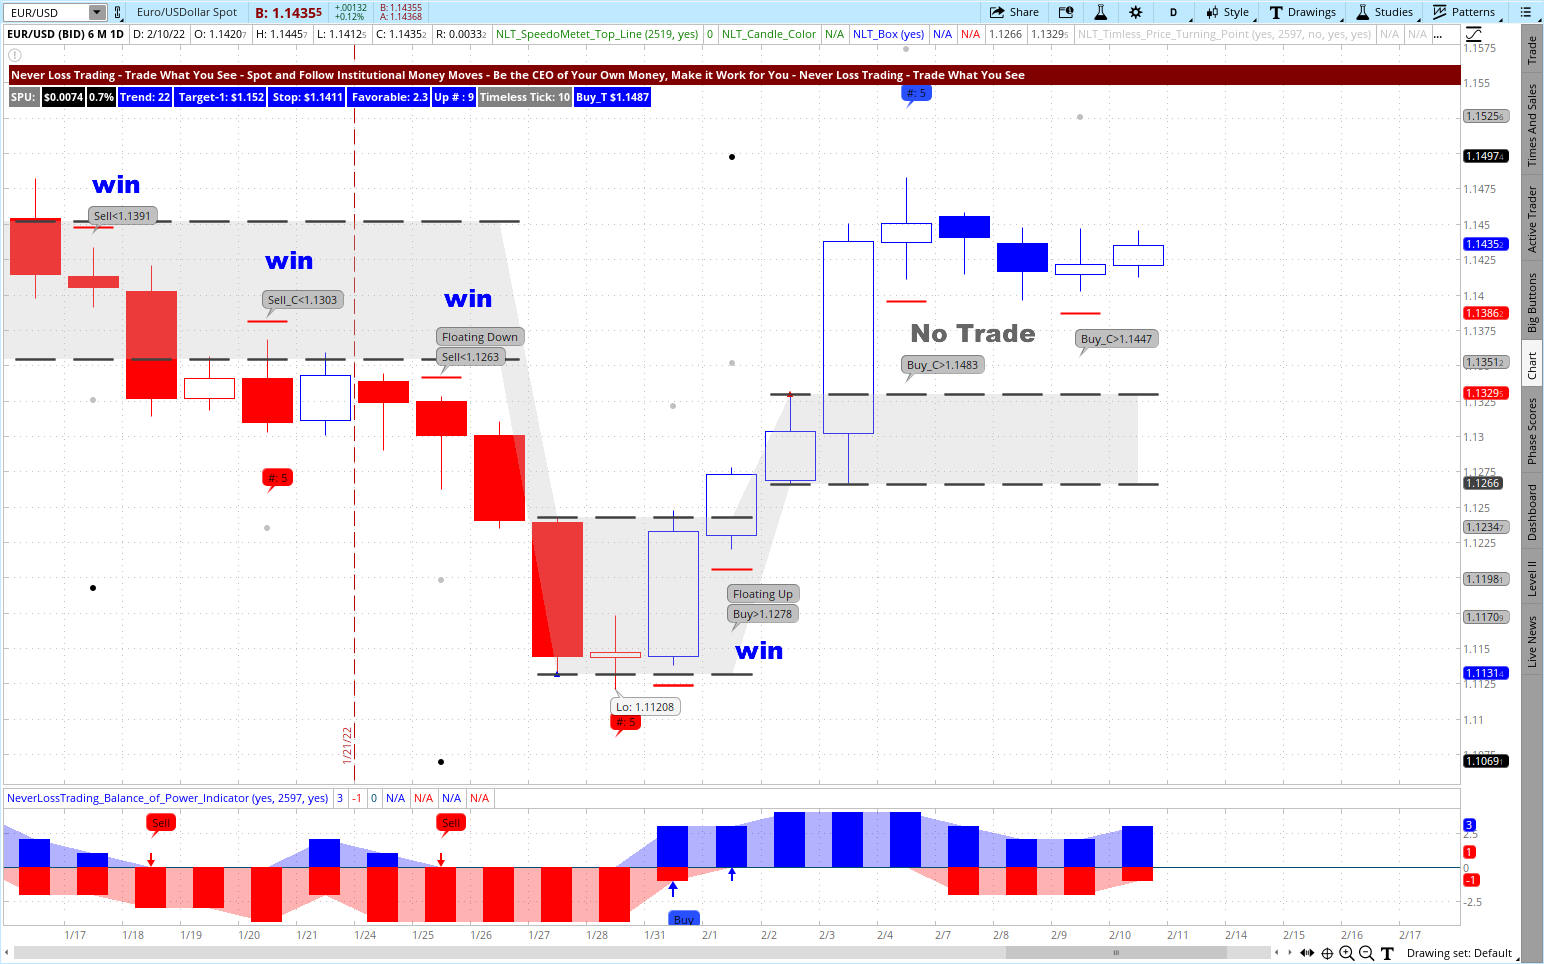
The most favored FOREX pair is the EUR/USD. There are multiple ways to participate in the price development, and we share a day trading and swing trading example:

Timeless NLT Day Trading Chart for EUR/USD

EUR/USD on the NLT Timeless Trend Catching Chart

From left to right:

  • No Trade, by NLT Box Line cutting the price move to target short
  • Wining long trade to target
  • Winning short trade, followed by another winning short trade
  • A losing short trade
  • Two winning long trades.

Daily NLT Trend Catching Chart for EUR/USD

EUR/USD on the Daily NLT Trend Catching Chart

When we sparked your interest, and you want to come on board with our systems and strategies, we invite you to a personal session to see how our systems work life.

contact@NeverLossTrading.com  Subj.: Demo.

We are more than 10-years in the trading education business, teaching one-on-one at your best available days and times.

Traders with little experience often overestimate their abilities. Learning a new profession from a book would be a simple task. However, the reality is different. It takes time to build knowledge and the skillset for building the competency to make money from the financial markets.

Elements of Trading and Investing Competency

Trading and Investing Competency Elements

It would go too far, explaining all trading and investing competency elements, but if you are interested, we are happy to share another article about the subject matter with you:

contact@NeverLossTrading.comSubj. Competency

As humans, one of our psychological patterns is called the Dunning-Kruger effect. It tells us that we vastly rate our competence level much higher than it actually is – and this in multiple competency fields.

In competence tests, probands that lost four out of five competence challenges still rated their competency on the subject matter above 65% and rated the winners’ competency lower.

The question: How to get around it?

With an increased competency in subject matter, the level of confidence in the own ability and skill comes to a level where perceived and actual reality are more related.

The needed competency can be built and obtained. Just do not risk your money with high confidence and little competency.

The question is: Do you possess enough knowledge and skill to put what we shared here into action. Or do you instead want to take our offer for a complimentary session with an expert where we look where you stand and develop a concept to train and coach you with the help of our systems for making competent decisions?

We teach in a holistic approach the step in learning how to turn yourself into the trader and investor you want to be:

Experience in a live session what we can do for you:

+1 866 455 4520 or contact@NeverLossTrading.com

Schedule your consulting hour and consider learning all variables needed for trading and investing success.

Elements of Education in the NeverLossTrading Mentorship

The frightening truth: 76% of private investors lose money!

We base this number on a study we conducted, and if you like to experience why: write us an email, and we will share the details: contact@NeverLossTrading.com Subj.: 76%. 

Who had assumed such a high rate of losing traders?

If you want a different trading career, find a solid training and coaching program and contact us to find out what could work for you: contact@NeverLossTrading.com Subj: Demo.

We are ready to share our experiences, helping private investors to build their trading business. Trading is not a typical career, and you best learn from those who are long-term in this business to cope with the rollercoaster of the financial markets. We are here to help and provide feedback on what you might be doing right or wrong.

Make a change to your trading results, and we will find out which of our systems suits you best.

contact@NeverLossTrading.com  Subj.: Demo.

We are happy to hear back from you,

Thomas Barmann (inventor and founder of NeverLossTrading)

www.NeverLossTrading.com

Disclaimer, Terms and ConditionsPrivacy | Customer Support

Saturday, April 2, 2022

Trading in Silver Investing in Gold

Summary: Experience ways to trade and invest in precious metals by letting the chart tell when to buy or sell!

Gold has a history of being a long-term preservative of money, and this is why people and banks keep it in their vaults; however, today, you will learn how to make sound decisions going long or short in silver or gold.

NeverLossTrading Gold and Silver

There are multiple ways to participate in a value change of silver or gold:

  • Buying the precious metal in the form of coins or bars
  • Trading gold or silver futures
  • Working with ETFs that are directly related to gold and silver (GLD, SLV, e.g.) or their options
  • Investing in mining companies that are digging for gold and silver

Price is the result of a shift in supply and demand; hence, in times of stock market ambiguity, gold and silver come in demand, and we see rising prices.

Let us compare the price development of Gold and Silver and the S&P 500 for the past six months, referencing the E-Mini S&P 500 Futures Contract and Gold Futures. Futures contracts are instruments that are traded around the clock, six days a week, providing the best basis for real-time data. ETFs and stocks catch up to the futures development and gap.

Gold Price Development and S&P 500 Index

Gold Price Development Compared to the S&P 500 Index

The chart shows relatively falling prices for the S&P 500 Futures (-5.15%) and rising prices for gold (+7.99%), reflecting what we said before.

The next question: are gold and silver prices developing correlated or independent. To answer this, we take a three months comparison to see the following:

Gold and Silver on a Three Months Comparison Chart

Gold and Silver Three Months Development

Comparing the two precious metals shows that both prices correlated, while silver has even more significant swings to the up and downside.

Critical for every trading or investing endeavor is that you buy or sell at crucial price turning points, and you have to define those. As an algorithmic trading house, we use our systems and let the chart tell when to buy or sell.

Here is an example of the NeverLossTrading Top-Line Chart for gold futures. If you are not yet familiar with us: our brand name, NeverLossTrading, derives from the concept of trade repair, where we take corrective actions instead of accepting the stop-loss, and Never Stop Loss Trading was a bit lengthy. Hence, our name does not imply a promise of never losing a trade, but we share high probability trading systems and strategies.

With this said, let us take a recent chart example for gold futures.

Gold Futures on the NeverLossTrading Top-Line Chart

Gold Futures on the NLT Top-Line Chart

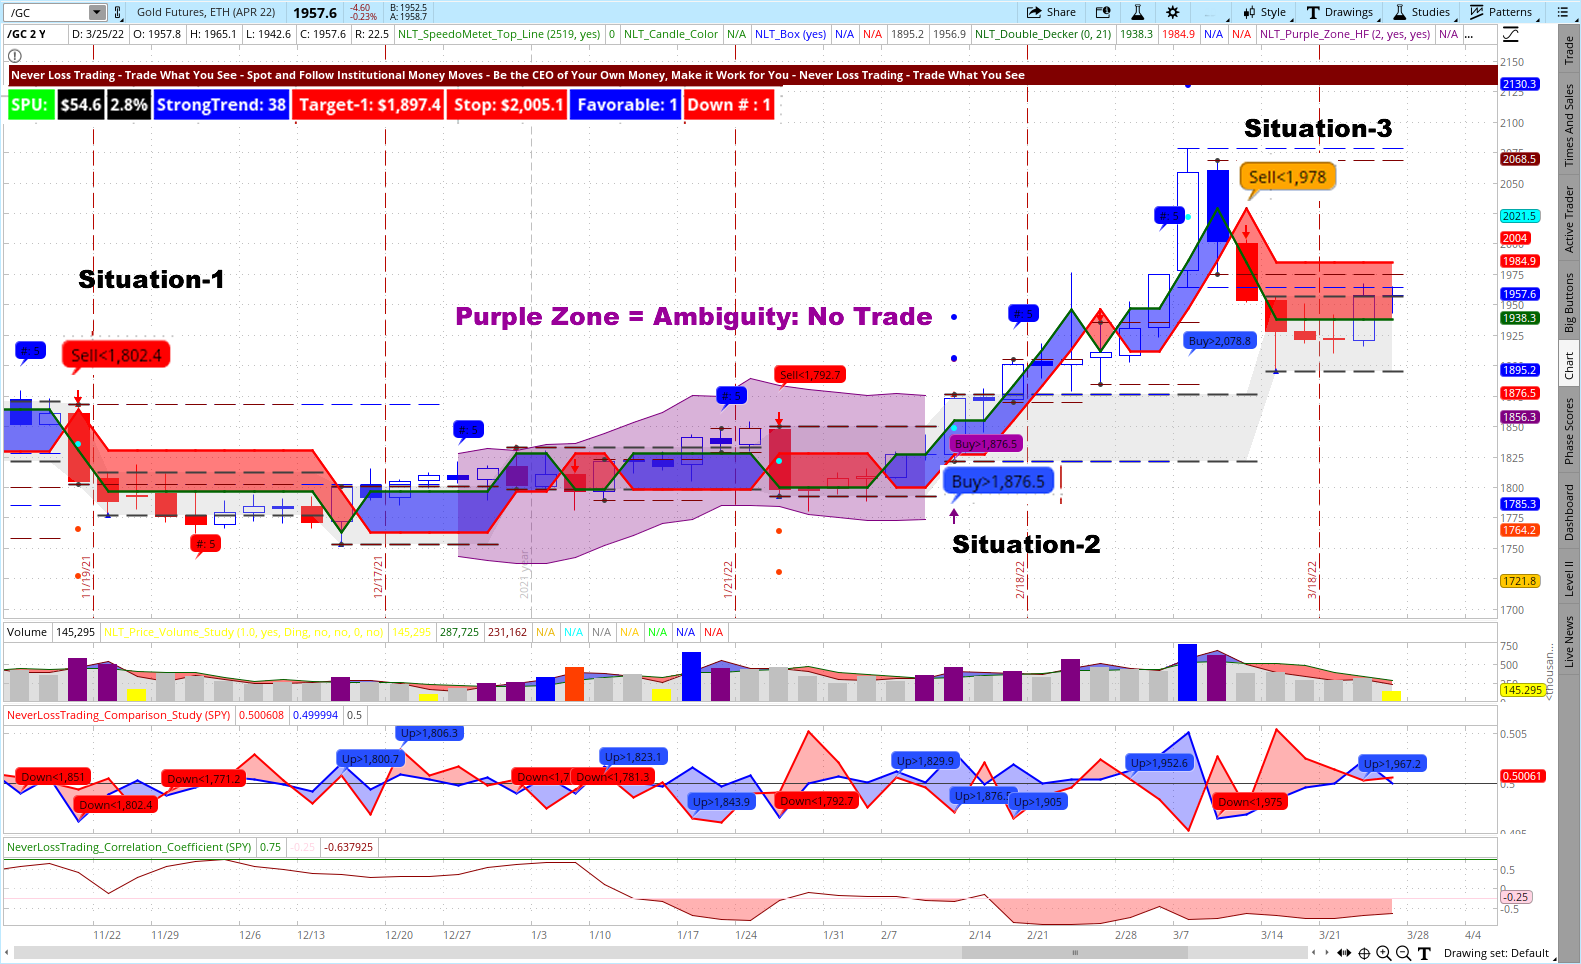
On the chart, we highlighted three trade situations and the NLT Purple Zone:

  • In the NLT Purple Zone, no price direction is found, and we are not accepting directional trade signals if they occur. When the purple zone ends, we have a high chance for a directional price move, as it happened in reality.
  • Situation-1: Sell < $1802.40 defined a short opportunity when the set price threshold was surpassed in the price development of the next candle, which was the fact. Hence we had a short selling opportunity, and the red dot on the chart specified where the exit was.
  • Situation-2: Buy > 1876.40 had its price threshold surpassed in the next candle and led to a trade to the upside for two target dots and the red line on the blue frame, covering the price development functioned as a trailing stop.
  • Situation-3: Another short opportunity, and the trade quickly came to target. On this signal, you do not see a dot on the chart, but you can read the expected price move from the dashboard on the chart:
NLT Top-Line Dashboard for Gold Futures

SPU is our measure for the expected price move. For example, on March 14, it was $54.60; the plan was to exit the trade when this price move from entry was accomplished. The NLT Top-Line dashboard also specifies targets and stops in discrete numbers and relates risk and reward: At the highlighted opportunity, the risk and reward balanced and proposed a favorable trade setup.

Let us take a quick journey to silver, for the same period:

Silver Futures on the NeverLossTrading Top-Line Chart

Silver Futures on the NLT Top-Line Chart

The chart shows two trading opportunities (two buy signals); both were confirmed and came to target. We teach in our mentorships how to participate in such opportunities with risk adequate or risk-limitings strategies.

Why is this important?

At the gold futures example, a risk of about 60 points was involved, which translates back to $6,000. When trading the micro gold futures contract, one risk unit was at a $600 risk, and if you decided to trade GLD or GLD options, we share strategies to scale down the minimum risk unit further.

We took trading gold and silver as an example, while our systems are used for finding and acting at crucial price turning points on Stocks, Futures, FOREX, and their derivatives, like options.

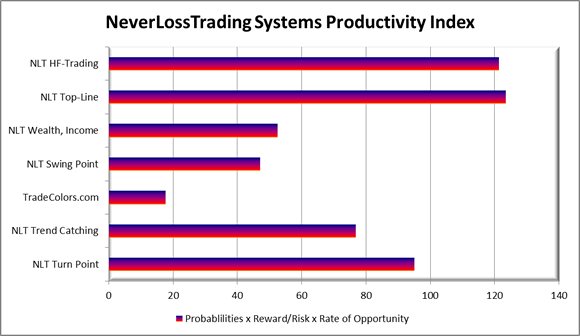
We offer multiple high probability trading systems: TradeColors.com is our entry-level system, and NLT Top-Line, is the top of the line.

Overview of the NLT Trading Systems

NLT System Index Productivity Comparison
NLT Systems Productivity Index

Take the chance and experience which of our systems fits your specific demand best:

contact@NeverLossTrading.com, Subj.: Consulting.

We teach one-on-one only, focusing on your wants and needs at your best available times. For more than ten years, we helped many traders to reach independence and constant income from the markets. Our mentorship entails multiple dimensions of trading knowledge, and with NLT Top-Line, you learn the details in 20 hours. The system also gives you your own scanners where you can find trading opportunities with NLT signals. If you want to rely on our services, we offer the NLT Alerts, where we daily report on potential trade setups.

NeverLossTrading Mentorship Program Elements

NeverLossTrading Mentorship Program Elements

Those are general categories; we tailor the mentorship specifically to your wants and needs and the trading styles you choose. You find more specifics on our blog and website.

Our trade indications show clearly defined entries, target exits, and stop levels (or adjustment levels). With that, your trade selection and execution are painted on the chart, and this is why we say, trade what you see:

“Let the chart tell when to buy or Sell!”

Take the chance for a free consultation meeting:

contact@NeverLossTrading.com, Subj.: Consulting.

Schedule your consulting hour! Working one-on-one spots are extremely limited: Do not miss out!

Follow our free publications and webinars…sign up here, and we are looking forward to hearing back from you,

Thomas Barmann

www.NeverLossTrading.com Disclaimer, Terms and ConditionsPrivacy | Customer Support