Spot and Trade Institutional Money Moves

Algorithmic Trading with Human Interaction for:

Day Traders, Swing Traders, Long-Term Investors

Showing posts with label Trade Alerts. Show all posts

Saturday, June 20, 2026

From Trade Signals to Decisions

How Traders and Investors Act by the NLT Alerts

Traders and investors expect opportunities that are relevant to their style and goals, and that is exactly what we provide. In addition to highlighting signal-based opportunities, we also include a detailed layer of market data in the NLT Alerts to support broader market analysis and better decision-making.

This gives users both the immediate trade idea and the broader context behind it, so they can see not only what stands out but also why it matters in the overall market environment.

Every NLT Alerts Summary packs ten layers of market intelligence into a single report — market outlook, institutional flow, sector development, swing and options signals, futures opportunities, multi-system charts, accumulation lines, and the core trading principles that tie it all together. For a new subscriber, that density can feel like a lot to process. For an experienced one, it is the entire edge. This article walks through how to read each section of the report as a working input into a trading decision, using the June 22, 2026, NLT All-in-One Alerts as the working example.

1. Start with context, not tickers

The temptation with any alert service is to jump straight to the table of buy and sell signals. The NLT report is built to discourage that. Section 1, Market Outlook, exists specifically to set the regime before any individual trade is considered.

There are thousands of opportunities to choose from, and we help our subscribers focus on where institutional action and money flow are actually happening. Trade what you see, but let us help you see it more clearly.

About 85% of a stock’s movement is driven by the broader market, but some names also show their own distinct price action. We highlight both the market-driven context and the individual setups so you can see what is moving with the crowd and what is showing relative strength or weakness on its own. 85% of stock moves with the overall market, but some have individual price action, and we point out both.

Layered on top of that technical read are the week's data catalysts — PMIs, home sales, GDP revisions, and the Core PCE Price Index on Friday — plus three named earnings dates (FedEx, Micron, Nike). The function of this section is to tell you which days carry event risk so that a swing entry timed for Wednesday isn't blindsided by a Thursday GDP revision.

Why does this matter for decision-making? A trade idea that looks technically clean in isolation can still be a poor entry if it sits directly ahead of a high-impact data release or sector earnings date. Reading the Market Outlook first prevents that mismatch.

2. Trade What You See – We point your eyes to it!  

To demonstrate how to act on NLT signals, we use the latest SPY chart as a practical example of how the setup helps identify high-probability buying and selling opportunities. The chart shows where price is confirmed, where momentum begins to fade, and where traders can use NLT levels to separate clean entries from low-quality moves.

On this SPY chart, the NLT framework highlights several key moments when buyers step in near accumulation zones, and sellers gain control near exhaustion or reversal zones. It also shows areas marked “no entry” or “not confirmed,” which are just as important because they help avoid chasing trades when the signal is weak or the move is already extended.

By following the chart's structure, traders can focus on the most relevant price levels rather than reacting emotionally to every swing. In other words, NLT helps turn the chart into a decision-making tool, making it easier to spot where to buy, where to sell, and where to wait for confirmation.

SPY, Daily NLT Multisystem Chart

3. Use sector development to confirm — or veto — a stock-level setup

Section 4, Sector Development, is one of the most underused parts of the report. It scores every S&P 500 sector on daily and weekly signals, patterns, money flow, and trend direction. The practical use case is straightforward: before acting on any individual stock or options signal further down in the report, check whether that stock's sector confirms the same direction.

SectorDaily signalDaily patternWeekly signalRead
TechnologyFavorableBullish CupTrend Up Cont.Leading the tape both daily and weekly
FinancialsTop Rev. / RiskyBullish CupFavorableDaily caution despite a constructive weekly base
HealthcareFloating DownAmbiguous SetupChange / RiskyWeak on both horizons — avoid new long exposure
EnergyFavorableWeakness on LowRiskyMixed — daily favorable but weekly deteriorating

The practical rule: a bullish stock-level signal sitting inside a sector that is also confirmed Favorable carries materially less risk than the same signal sitting inside a sector flagged Risky or Floating Down. The report gives you both pieces — use them together.

4. Read every trade table as one unit, not as isolated columns

Sections 5 (Swing Trading Indications) and 6 (NLT Timeless Opportunities) are where the report becomes directly actionable. Each row is a complete trade specification, and the core NLT principle — stated explicitly in Section 9 — is that you should never act on the Entry Condition alone. Three fields work together:

  • Entry Condition:  The exact price threshold where the trade becomes valid — a Buy > level or a Sell < level. The system requires confirmed price action through this level before the setup is considered active.
  • Adjustment Price:  A pre-defined level for stop management or trade repair. This is the field that operationalizes NLT's signature philosophy — repairing a trade that moves against you rather than mechanically stopping out.
  • Exit / Target Level:  Where the system anticipates the move concluding, used to frame the dollar and percentage potential of the idea.
FieldExample value (MU, swing)What does it tell you
Entry ConditionBuy > $1,151.29The exact price that must be exceeded before the trade is considered active
Adjustment Price$1,074.22The repair / stop-management level — not a hard stop-loss, but where NLT's repair logic activates
Exit Potential$1,226.86The system-projected target where the trade idea is expected to play out
Dollar / % Potential$75.60 / 6.6%Expected reward if entry and exit both confirm as projected
Timeless NLT Tick3,530A proprietary momentum/volume composite — higher generally signals stronger conviction
Days to Earnings3.5Tells you whether the setup is earnings-adjacent risk or a clean technical setup

Aside from the technical numbers, the MU (Micron) setup suggests institutional involvement ahead of the earnings call, making the move more than just a simple reaction to headlines. To manage risk while still participating in the opportunity, we use the NLT Delta Force Options Trading concept to structure a vertical spread into earnings, combining the trade signal with a defined strategy.

This approach helps balance upside potential with controlled exposure, so the trade is guided by both market behavior and a clear risk framework.

5. Confirm signals visually before treating them as actionable

Section 7, Multi-System NLT Charts, exists to let you verify a numeric signal against the actual price structure. Each chart overlays the same Entry, Target, and Adjustment levels from the tables directly on the candles, along with the Light Tower trend indicator, and the Balance of Power volume histogram beneath the price panel.

MU Chart Example

This step matters because we trade what we see by letting the chart tell us when to buy or sell.

A simple pre-trade checklist We score the signals and setup: MU scored at 4 out of 5? Does the sector backing this stock also show a Favorable signal (Technology had a long-term upside signal)? Do the chart's Floating Up Buy Signal agree with the table's direction (Yes)? Is there a near-term earnings date that would change the risk profile (we will initiate a trade ahead of earnings)?

6. Putting it together: the report as a layered filter

Read end-to-end, the NLT Alerts Summary functions less like a single signal feed and more like a funnel: market regime, then sector confirmation, then individual setup detail, then visual chart verification, then macro accumulation context, applied through a fixed three-step execution discipline. Each layer either confirms or contradicts the one before it. A setup that survives all five checks — favorable macro tone, confirmed sector, a complete and reasonable entry/adjustment/target spread, visual chart agreement, and acceptable earnings timing — represents the highest-conviction version of what the report has to offer for that day or week.

If trading were easy, nobody would ever go to work, but it is learnable.

7. The Next Step: A Conversation About Your Trading

Trade selection at perfection begins with a system built for the way you want to trade. Every NLT student starts with a free one-hour consulting session — a private conversation, no group presentation, no obligation — focused entirely on the trader’s individual goals: which markets, which time frame, which strategy style, and which program within the NLT system fits best.

📩 Contact us: contact@NeverLossTrading.com

Subject: Consulting

This is not a sales call. It is the same disciplined, specific, individually focused approach NLT applies to everything else. You bring your trading questions. We bring the system.

To stay in contact: Sign up for our free trading tips.

Good trading,

Thomas F. Barmann

www.NeverLossTrading.com

Disclaimer, Terms and Conditions, Privacy

Saturday, March 9, 2024

2 Minute Trading and Investing Decisions

Private investors make critical decisions in less time than ever in today’s investment landscape. On average, traders decide to enter or exit an investment in less than two minutes. Rather than lamenting this fact, we acknowledge it and empower our traders/investors to make informed, fact-based decisions within this brief window.

Let’s delve into how NLT Investors can navigate swing trading and longer-term investing decisions efficiently and effectively:

NLT Alerts

Our NLT Alerts serve as invaluable tools for investors, providing timely notifications of market developments and opportunities. These alerts are meticulously curated to ensure relevance and accuracy, enabling investors to stay ahead of the curve and make swift decisions with confidence with asset focus on:

  • Stocks
  • Futures
  • FOREX

Experience the power of our comprehensive market analysis firsthand! We meticulously monitor daily, weekly, and four-hour signals, providing our subscribers with a comprehensive overview of market dynamics. Our daily summaries offer concise insights into key developments, complemented by detailed analyses to guide informed decision-making.

As a gesture of confidence in the value we provide, we invite you to receive our daily stock alert summary free for a week. Take advantage of this opportunity to assess the depth and quality of our insights, and discover firsthand how our analysis can enhance your trading strategy.

contact@NeverLossTrading.com Subj.: Stock Alerts

For traders engaged in Futures or FOREX markets, we provide a comprehensive summary tailored to your specific needs. However, we understand the importance of clarity in interpreting our alerts, which is why we offer additional interaction to ensure you fully grasp our methodology.

Our goal is to empower traders to seize opportunities at crucial price turning points, equipped with pre-defined entry thresholds, exits, and stops. By engaging with us further, you’ll gain invaluable insights into how to leverage our alerts effectively, maximizing your potential for success in these dynamic markets.

Navigating investment decisions solely from a table can be a daunting task. At the core of our methodology lies a fundamental principle: “trade what you see, let the chart tell when to buy or sell.” In line with this ethos, we equip our clients with sophisticated charting software, a vital tool that empowers them to make informed decisions with confidence and clarity.

Charting Software

Harnessing the power of advanced charting software, our investors allow the chart to dictate when to buy or sell. By analyzing key indicators and price movements, investors can precisely identify optimal entry and exit points, all within a few minutes.

Trade what you see: Let the chart tell when to buy or sell!

Weekly Charts for Longer-Term Investing

We employ weekly charts as our primary analytical tool to manage positions over multiple weeks or months. Within the following chart example, we utilize NLT Top-Line and NLT Swing Power signals to inform our decision-making process. Additionally, we rely on visual indicators such as dots, which delineate potential exit points based on our analysis. Furthermore, the red line of the NLT Double Decker serves as a dynamic trailing stop line, helping safeguard profits and manage risk effectively throughout the trade.

The yellow indicator on the price chart is the newly launched NLT SwingPower indicator. To explain what it does, we are happy to send you a PDF write-up.

contact@NeverLossTrading.com Subj.: SwingPower PDF

SPY October 2023 to February 2024, Weekly Development

We had four trade indications: blue from NLT Top-Line and yellow from NLT Swing Power, which we will now discuss in detail to share how we select following or not following chart indications.

#Indicator
1NLT Top-Line Buy > $436.29, confirmed with a target at the second dot, where we anticipate a slight pullback and exit. This signal was expected to come to the second dot in a maximum of ten candles, which it did.
2NLT SwingPower Buy > $451.52 came to the system-set target. If you operated with both systems, then it would be a directional trad confirming indicator.
3NLT Top-Line Buy > $436.29, confirmed with a target at the second dot, where we anticipate a slight pullback and exit. This signal was expected to come to the second dot in a maximum of ten candles, which it did.
4NLT SwingPower Buy > $451.52 came to the system-set target. If you operated with both systems, then it would be a directional trad confirming indicator.

It’s good to see how the NLT systems performed on the way up, but how did they support solid decisions on the way down?

SPY October 2023 to February 2024, Weekly Development

We picked the period of January to September 2023 and will discuss the individual signals of the system performance, discussing nine trade indications.

#IndicatorResult
1Double Sell signal that came to the system set target.worked
2Additional sell signal on the way to target that we neglect (Buy < $437.95, buy not entering a new signal at the exit candle: a simple rule to learn.no trade
3Buy_S> $437.84 that came to the system set target (dot on the chart).worked
4/5Two additional buy signals are on the way to target, which we neglect.no trade
6NLT End of Purple Zone sell signal that reached its target.worked
7NLT Top-Line Buy signal that failed.failed
8The yellow sell signal came to the target.worked
9Orange NLT Top-Line Signal that worked.worked
10Directional confirming yellow buys signal we neglect on the way to targetno trade
11NLT Top-Line sell signal that reached its targetworked
12NLT Top-Line sell signal that reached its targetworked

Eight trading opportunities where seven worked, and one failed: this is what we call high probability trading.

Swing Trading Example

Our swing trading signals typically span from one to ten days, contingent upon fulfilling predetermined price thresholds with each new candle. This meticulous approach ensures that trades are only initiated when specific criteria align with our system’s parameters, thereby enhancing the probability of success.

In individual stock trading, we recognize the heightened price pressure exhibited compared to broader stock market indices when there is a discernible shift in supply or demand dynamics. This understanding underscores the importance of precision in identifying and responding to such market movements.

To provide further clarity on the efficacy of our trading systems in navigating complex scenarios, we present a comparative analysis of short and long positions in the SPY, offering insights into their performance under varying market conditions. If you find value in leveraging high-probability systems to inform your trading decisions, we cordially invite you to participate in an online demo. During this session, you will have the opportunity to select stocks, commodities, or FOREX pairs of interest, and together, we will evaluate the outcomes of both successful and unsuccessful trades, allowing you to gauge the effectiveness of our approach firsthand.

contact@NeverLossTrading.com Subj.: Demo

SPY September to November 2023

The chart shows ten price move indications we evaluate and discuss for your understanding.

#IndicatorResult
1Red NLT Top-Line Sell signal, confirmed and came to target.worked
2Yellow buy signal, we neglected on the way to the target of the first signal.no trade
3Red NLT Top-Line Sell signal, confirmed and came to target.worked
4Yellow buy signal, we neglected on the way to the target of the prior signal.no trade
5Yellow buy signal that worked.worked
6Yellow buy signal, not confirmed in the price movement to the next candle.no trade
7Red NLT Sell Signal, confirmed.worked
8We neglect the yellow buy signal because the blue channel border cuts the price movement to target short.no trade
9Two independent buy signals came to target.worked
10Buy signal that came to target.worked

Our approach systematically adheres to predefined rules, ensuring that trades are not executed mechanically at every price movement indication. Instead, we exercise discretion and selectivity, only entering trades when the subsequent candle’s price movement exceeds the established system-set threshold.

In our personalized one-on-one coaching sessions, we provide comprehensive guidance and mentorship over several months. Through this intensive program, we equip you with the knowledge and skills to make informed decisions based on NLT indications. By allowing the chart to dictate optimal entry and exit points, we empower you to navigate the markets with confidence and precision.

To underscore the integrity of our methodology and dispel any notion of cherry-picking favorable periods, we deliberately select the most current price indications for SPY from a daily chart when composing this article. This deliberate approach provides an accurate and unbiased representation of our system’s performance, showcasing its efficacy across market conditions.

SPY January and February 2023

#IndicatorResult
1Blue NLT Top-Line buy signal was confirmed and came to target.worked
2Yellow buy signal, we neglected on the way to the target of the first signal.no trade
3Red NLT Top-Line sell signal not confirmed.no trade
4Yellow buy signal, confirmed.worked
5Red NLT sell signal not confirmed.no trade
6Blue NLT buy signal confirmed.worked
7We neglected the yellow buy signal on the way to the target of the blue signal while it was confirmed and worked in itself. no trade

We could undoubtedly add example over example, but if you are interested in working with our systems, we offer you a free demo:

contact@NeverLossTrading.com Subj.: Demo

Day Trading Examples

NeverLossTrading provides a solid foundation for day trading, ensuring that students, regardless of their experience level, clearly understand market dynamics and order types by acting at crucial price turning points. In addition to conventional time-based day trading strategies, we have pioneered the NLT Timeless Concept, which operates based on system-specified price increment changes. Within our timeless day trading framework, we integrate multiple systems to optimize accuracy and effectiveness. Nevertheless, it is crucial to emphasize that our trading approach is inherently probabilistic. While we strive for precision, we acknowledge that no trade outcome can be guaranteed with absolute certainty.

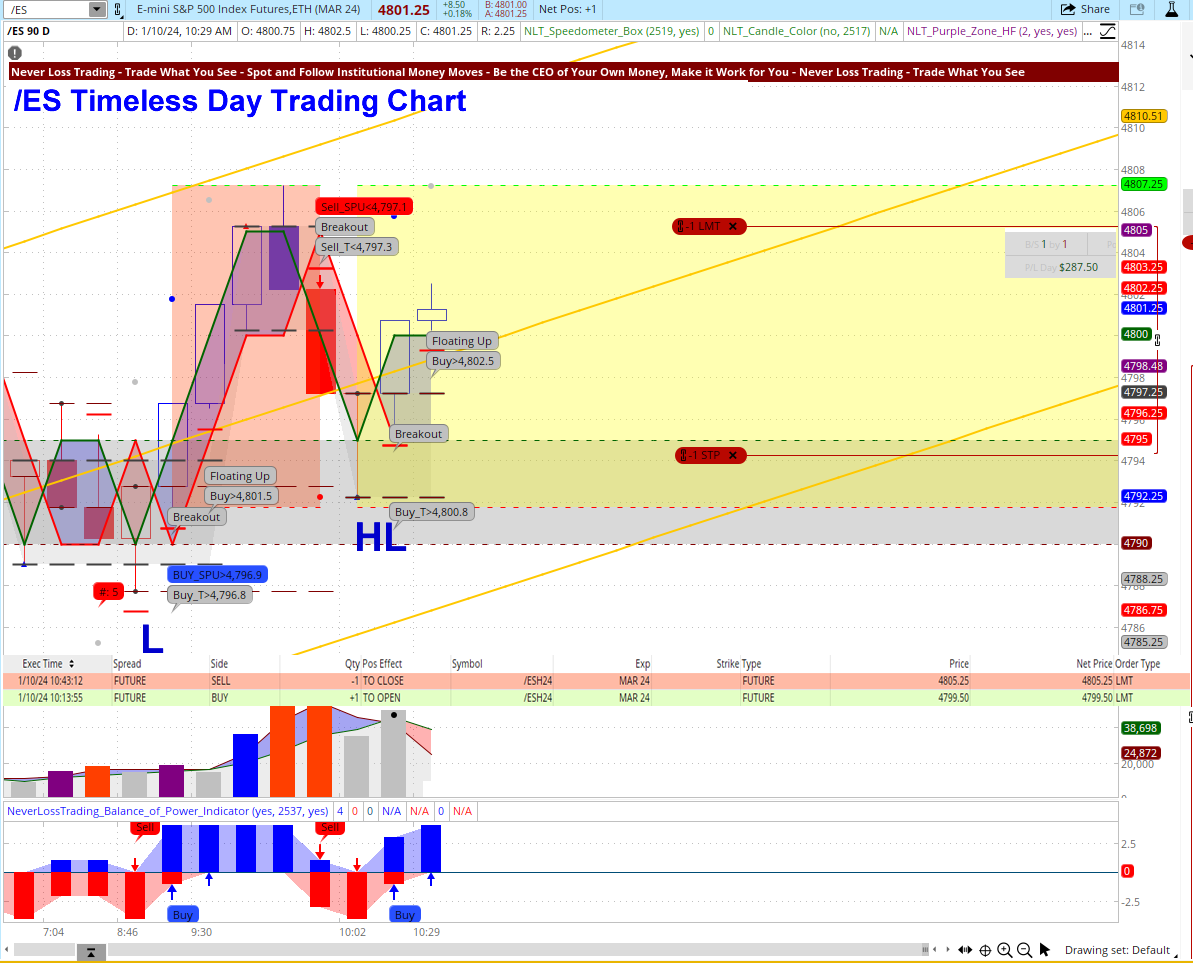
NLT Timeless Day Trading Chart

In the above chart, we highlighted four potential trade situations:

  • The first two trade indications occurred in what we call an NLT Purple Zone (indication of directional price ambiguity), and we do not trade as long as zones of price ambiguity hold.
  • In Situation-3, the NLT Purple Zone ended in a long signal: Buy > $4,789. The target for the trade was at the dot of the chart and the stop at the bottom of the indication candle.
  • Situation-4 offered a short opportunity at a strong signal, NLT PowerTower Down, Sell < $4787.50, combined with an NLT Breakout signal. Knowing from the NLT Dashboard where to enter, we placed a sell-stop order, which did not immediately fill but continued the price move and came to target (dot on the chart).

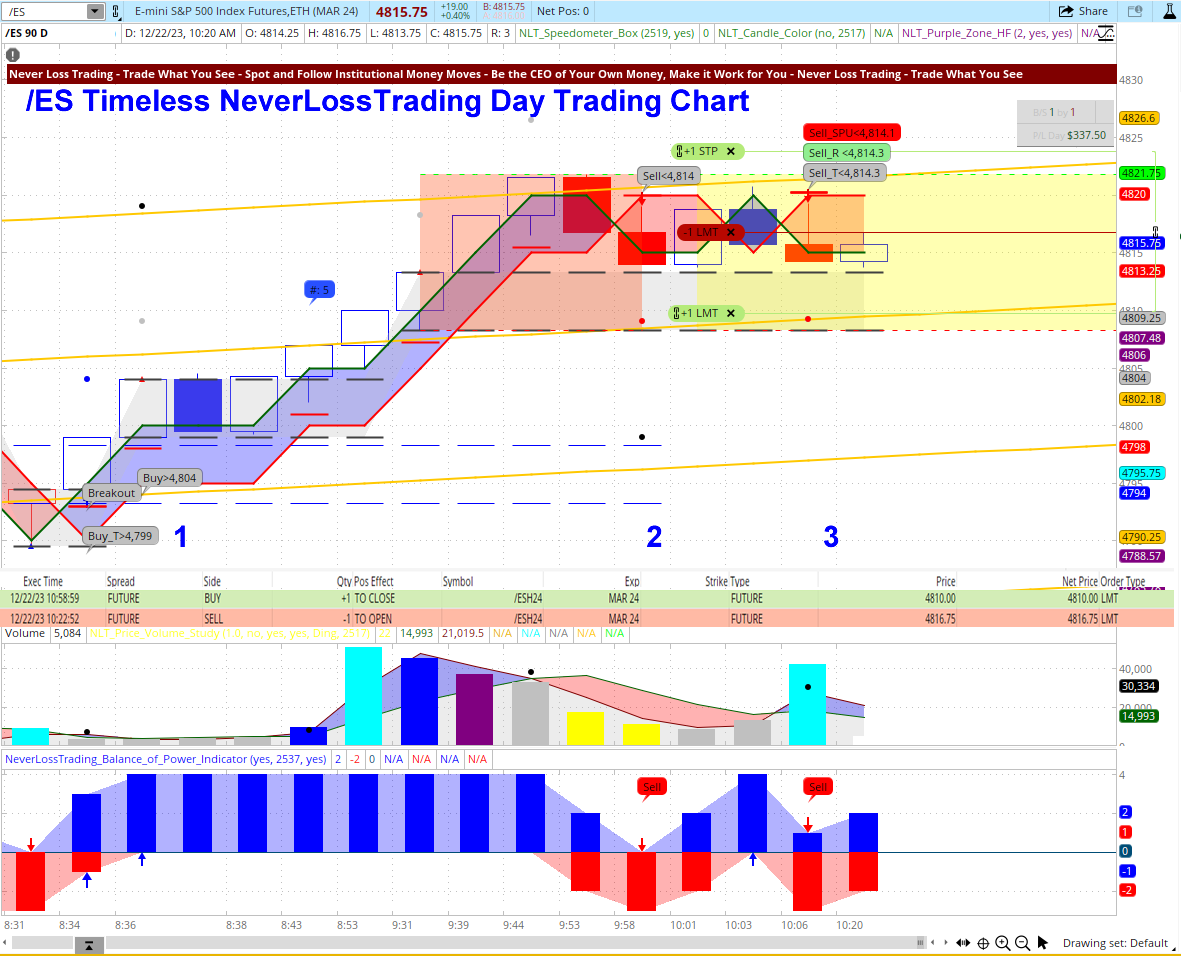
NLT Day Trading Chart Example

From the left to the right, we highlighted three trade potentials:

  • Situation-1: Long opportunity, expressed by two buy signals. The upward price move is trailable by the red line of the blue frame that follows the price momentum.
  • Situation-2 did not lead to a trade because a black dashed line cut the potential price movement to target short, and we spared the trade.
  • Situation-3: A short trade with a bracket order developed, came to target, and produced $337.50 per contract.

If this is for you, we are happy to demonstrate how our systems work in real time:

contact@NeverLossTrading.com Subj.: Demo 

In conclusion, while investment decision-making may accelerate, NLT Investors are equipped with the tools and strategies needed to thrive in this dynamic environment. By leveraging NLT Alerts, advanced charting software, trade repair strategies, and a combination of daily and weekly charts, investors can make informed decisions within two minutes and confidently seize opportunities.

Are you ready for a solid basis for quick trading and investing decisions?

We teach and coach one-on-one, and spots are limited.

Thomas Barmann (inventor and founder of NeverLossTrading)

www.NeverLossTrading.com

Disclaimer, Terms and ConditionsPrivacy | Customer Support

Saturday, August 29, 2020

Stock and Options Trading by Alerts


This white paper shows how we combine NeverLossTrading indications and options trading activity for finding and following trading and investing opportunities when they develop intraday.


We are blogging and sharing content for more than ten years, and we helped many traders and investors to produce consistent income from the financial markets.


With our systems and indicators, we are tracking institutional money moves and trade along with those by finding and acting on high probability setups with the goal of ≥ 65% accurate directional prediction.

Let us give you an example of how our systems spell out opportunities on the chart to spot and follow:

AAPL Weekly NLT Top-Line Chart, Feb. to Aug. 2020


Even so, reading and operating with our indicators needs to be learned, the chart demonstrates how our system points out opportunities at key price turning points and along with the price development of the observed asset: in our case AAPL.

For more input on our systems: contact@NeverLossTrading.com

In the NLT Options Trading Alert, we combine NLT indicator readings and options trading activities, highlighting where our systems find significant changes in supply and demand intraday. There is no fixed reporting schedule, the trading day and happening defines when the alerts are generated:

  • First reports come out around 10 a.m. ET forward.
  • End of the day alerts, around 3 p.m. to 3:30 p.m. ET.

-      We only share reports when referring changes in supply and demand are identified. When nothing happens, no alert will be generated and shared.

-      An alert based on the end of the day numbers will also be generated and shared.

-      Only shares with meaningful option trading conditions are considered (tight bid/ask spreads, minimum volume and open interest requirements we set).

With the NLT systems, we are operating on confirmed signals only: Daily signals, for example, have to be confirmed in the price continuation of the next day.

By combining early indicator readings and options trading activities, we are opening positions without confirmation on the day of occurrence, and we were able to achieve high probability results 65%.

In summary: The goal of this new alert service is to inform you intraday about happenings: The actual price move of the underlying, combined with the intraday options activity, proposes early entries into developing directional price moves.

Options trading with the right strategies provides:

-      Fantastic return opportunities.

-      Risk-limited trading: Limiting the trading risk, either to the premium paid, when buying options, or to the width of the spreads, minus the premium received on credit spreads.  

We are a big proponent of trading risk-limited only; it builds the basis for every successful trader by preventing drawdowns.

Could you have traded the stock instead of the option on the spelled out opportunities?

Yes, because we traded directional only, and such trading the stock instead of the option would have lead to the same positive results: 72% winners over 28% losing trades.

Before launching this alert service, we tested the NLT Options Trading Alert for three months, with the following results:

·       Between June 4 and August 25, 2020, we conducted 69 trades in 58 trading days: 1.2 transactions per day. Of those, 60 positions are closed, and nine are still open.

·       Of the 60 closed trades, 43 (72%) were winners and 17-times we lost (28%).

·       The average return of the winning trades was 74% of the investment made. The average loss was 65% of the investment made.

·       On the first pass, we kept the maximum risk-unit per trade below $500, and such we left put or call buying opportunities for high-value shares like TSLA out, except spread trades allowed to participate with the set risk limit.  

In summary: We were winning more often than we lost, and we produced a higher return and lower loss average per trade:

A success principle in which we believe in!

Here is an overview of the stock symbols we traded (options of some of the listed symbols were traded multiple times):  

Stock Symbols of the Options Trades Conducted


The listed symbols were not the only trades we conducted; NLT offers multiple alert services from which we choose and execute opportunities for all asset classes: stock, options, futures, and FOREX.

All traded symbols provided substantial daily open interest and volume: an imperative for meaningful options trading.

The average time in a trade was 11 days, with the following  distribution:

Average Days in a Trade


About 25% of the trades were adjusted, mostly by rolling positions forward:

-      40% of the losing trades were adjusted

-      12% of the winning trades were adjusted

By producing an average 74% return over a 65% average loss, the adjustment method provided an edge. Options trading adjustment methods are taught at our mentorship programs.

Watch Video

Producing consistent income from trading and investing is a process, and we provide systems, strategies, and a game plan, helping you to develop yourself into the trader you want to be.

If you are up for learning this and using the NLT Options Alert, let us get super interactive on multiple levels:

-      Level-1: Write us an email that you want to test the end of the day NLT Options Alert to see if you can get value out of it, and it will end up in your inbox at the end of the day or early next day. Subj.: NLT Options Alert Only.

-      Level-2: We interact with you and share opportunities we find intraday and at the end of the day. When you are up for this, we want to have content-filled conversations, and such we want to offer this to ten individuals only. For being able to act on the opportunities we share, options trading experience is of help. If you want to learn how to work with our systems, indicators, and strategies, we are happy to help you with one of our mentorship programs (incl. software, teaching, coaching). For being part of Options Level-2, please email us: Subj.: NLT Options Exchange.

No, there is no charge, and no credit card is needed to participate. When you like our service, we will make you an offer, and you decide if you accept it or not. For you to participate, a legit name and email address is needed:

contact@NeverLossTrading.com

We are looking forward to hearing back from you!

Thomas

www.NeverLossTrading.com

Disclaimer, Terms and Conditions, Privacy | Customer Support

Saturday, April 29, 2017

Never Loss Trading Alerts Updated for May 1, 2017

When markets are moving slower, there are still opportunities to capture:
The last hours of the day offer such opportunity and now, you can follow through on confirmed signals.
Knowing and testing this effect for the last years, we are ready to publish the last hour opportunity alert, which is integrated into our NLT All-in-One Alert.
In another filtering step we also developed the NLT Short list as a tab on the NLT All-in-One Alert.
This way you can easily carry over selected symbols into your watch list, to scan for high/low breaks:
Giving you the opportunity to be alarmed when one of the observed symbols fulfills the required chart setup conditions; without the need for you to watch and control multiple charts at the same time.
Ending the month of April, the NLT Long Term Investor Alert includes an updated monthly alert for May 2017.
Monday, May 1, most of Europe celebrates a holiday: Labor Day and thus, the pre-market on Monday might be a bit slower.
Many of our NLT Alerts are there for you to test FREE for one Week…check it out and click.
For more information on how to operate with a high probability trading system:
Call: +1 866 455 4520 or contact@NeverLossTrading.com
To subscribe to our FREE trading tips, webinars, and reports…click here.
We are looking forward to hearing back from you,
Thomas

Friday, February 24, 2017

Which are the Best Stocks to Trade?

A big question-mark: 
question-markt
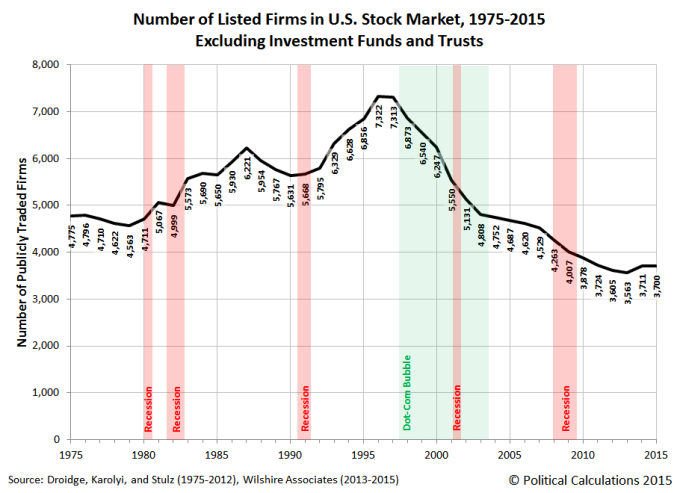
The US Stock exchanges lists about 3700 different stocks traded in the US, excluding Investment funds and trusts.
If you are not yet signed up to our FREE Trading Tips, Webinars, Reports…sign up here.
stocks-trades-at-us-exchanges
But which are the best stocks to trade?  
  • Stocks with a sound volume.
  • Most important: Stocks with an indication for a directional price move.
  • And, stocks with a solid option chain, option volume and open interest.
Unfortunately, most retail traders do not follow those principle, they trade:
  • Stock that are recommended.
  • The same set of assets over and over, even so they might not move.
  • Without having a repair strategy at entry, in case the trade goes wrong.
If you like what you see and you are ready to see how our systems perform live:
Call +1 866 455 4520 or contact@NeverLossTrading.com
If you are not yet signed up to our FREE Trading Tips, Webinars, Reports…sign up here.
By training and coaching one-on-one, spots are extremely limited, so do not miss out.
Good trading,

Thursday, March 24, 2016

Which Stock to Trade?

Don’t we all want to trade a stock that is outperforming the markets?
Outperforming has two dimensions:
  • A price development far above the market.
  • A price development far below or against the market.
As you can see, we are already considering more than one strategy to trade the markets. Let us assume: By having thousands of tradable assets, we always have the ability to pick a stock that has a potential for a desired price-move and thus, we neglect price-neutral-strategies and focus on going long or short in an asset.
How do you notice a strong individual stock performance?
Never be late for a trade (without Brand).png
We can help you twofold:
Each of the NLT Alerts or scans has clearly defined entries, exits, and stops- or adjustment levels.
How to go short from an IRA or trade high value stocks from a small account?
By applying option strategies!
Now, it gets even more demanding:
  • Which strike price to pick?
  • Which expiration day to choose?
Answering all this is part of our mentorship programs; in this article we just want to guide you through a list of trade preparation steps and give you some examples of high probability trading.
Let us share some wisdom:
  • Long-term investors best trade from a daily chart.
  • Swing traders from a 4-hour and daily chart.
  • Day traders from meaningful sub-day time frames.
Long-Term Investor Example: Time in the Trade 1-5 weeks, while many of us only stay in a trade for two weeks.
TSLA Weekly NLT Top-Line Chart
TSLA on a Weekly NLT Top-Line Chart March 2016
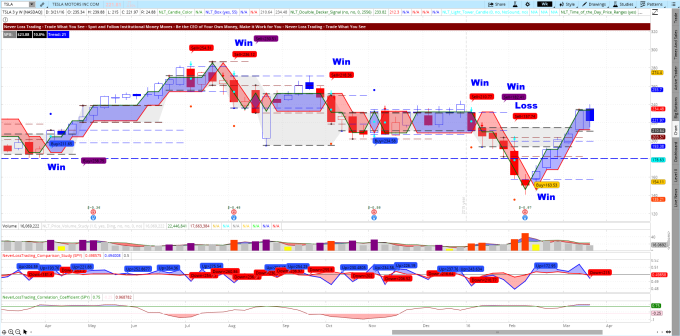
Dots on the chart mark the target, bubbles the formulated price threshold for the entry. Bubbles, where the requested price threshold was not surpassed by the next candle are not commented. TSLA on the above chart had six winners and one losing trade, by accepting trades mechanically; considering that we do not want to trade the second NLT Light Tower (candle with a cyan dot) in a price sequence, the loss could have been prevented. When applying trade repair strategies, the losing trade could have even been turned into a winner.
As a live example, we are taking the NeverLossTrading Long-Term Investor Watch List Alert for the Week of March 14, 2016 and strike a balance today at March 24, 2016; documenting the following results:
March 14 to March 24, 2016 Predictions and Results: 9-Winners, 2-Losses
March 24, 2016 Long-Term Investor Alert
81% winners after two weeks or less in a trade is a result that speaks for high probability trading, which we dedicate ourselves to; check your charts and you will see for yourself.
The subscription to the NeverLossTrading Long-Term Investor Alert is $195/month. As a special offer, we give you the first week for free for testing…click here for the details. Test it out with no obligations. We only trade when the desired price threshold is surpassed: The NLT Alert contains the entry price level desired to indicate a strong institutional price move.
If you rather want to learn and experience how to accept and execute those trades with our systems, schedule your individual consulting hour:
Call +1 866 455 4520 or contact@NeverLossTrading.com
We are teaching one-on-one only, thus capacities are limited: do not miss out!
In case you are not yet part of our free trading tips, reports, and webinars…sign up here.
We are looking forward to hearing back from you,
Thomas