
Summary: Experience solid stock trading strategies and examples for mid-year 2022 forward. We share in this publication for traders who invest more than $40,000 in the stock market.
We are in a volatile market, and shorter-term swing trading provides higher profitability than long-term holding. If you want to hold a portfolio of stocks, you need to know how to put an automatic hedge in your portfolio and act on crucial price turning points; if you do not, you accept an extraordinary risk.

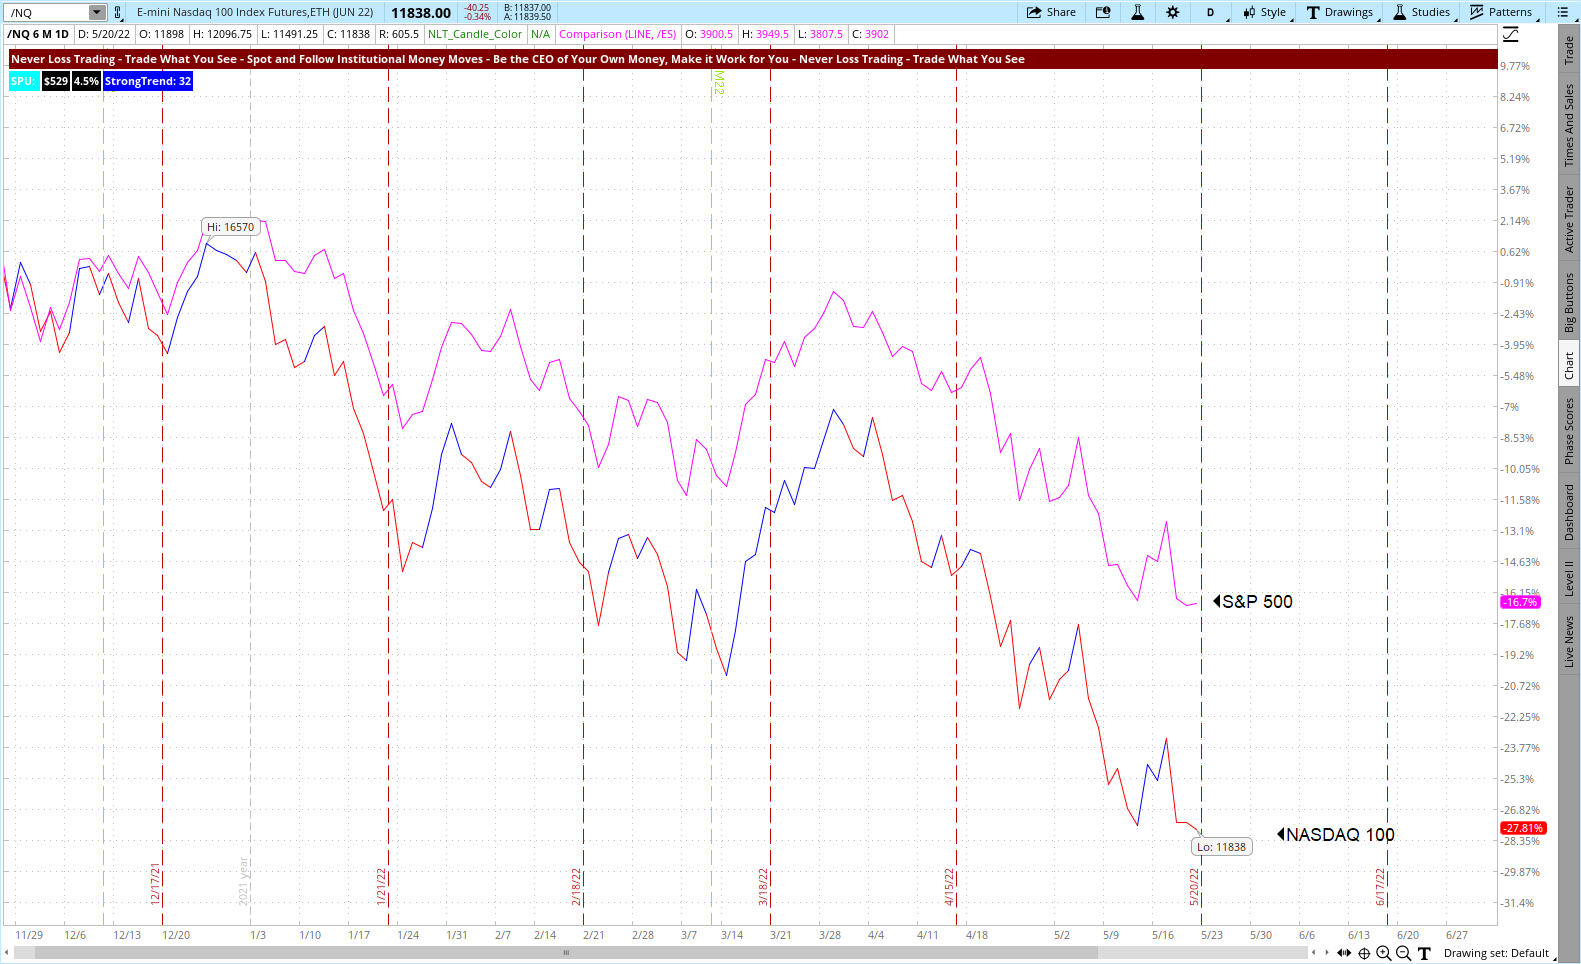
The average portfolio holding in 2022 is down by about 20%:
- If you hold a NASDAQ 100-oriented portfolio, its value dropped by about 28% over the last six months.
- An S&P 500-related portfolio dropped by about 17%.
Those are solid numbers, and by continuing to buy and hold, your portfolio value might soon be cut in half, requiring you to produce a 100% return to make up for the shortfall.
We best put this in perspective by charting the development of the S&P 500 and the NASDAQ 100 on a six months comparison:
S&P 500 and NASDAQ, Six Months Development May 2022
What if you invested in growing sectors like Energy, Metals & Mining instead of Technology?
Technology, Metals & Mining, Energy, Six Months May 2022

In this case, you would be up in 2022 over 2021, while Metals & Mining gave a good portion of their development back. So to determine investment and cutoff points, you need a system.
Let us pick the example of XME, an ETF for Metals & Mining:
XME on the Weekly NLT Top-Line Chart

We highlighted three situations on the chart:
Situation-1: NLT Purple Zone, which indicates ambiguity in the price development and you do not want to be invested in this phase, and disregard by and sell signals.
Situation-2: NLT Buy Signals at the end of the purple zone signify that the underlying asset is ready for a strong upside price move, which you can follow and trace by the blue framed momentum price development on the chart (blue for upside momentum, red for down).
Situation-3: Sell signal on the top, confirmed and should have led to an exit at $58.55.
If you managed your portfolio this way, you would have gained about 14% between February and April and closed your position not to give most of your gains back, which would have happened if you continued holding.
Next, we analyze the Energy sector by the XLE ETF:
XLE on the Weekly NLT Top-Line Chart
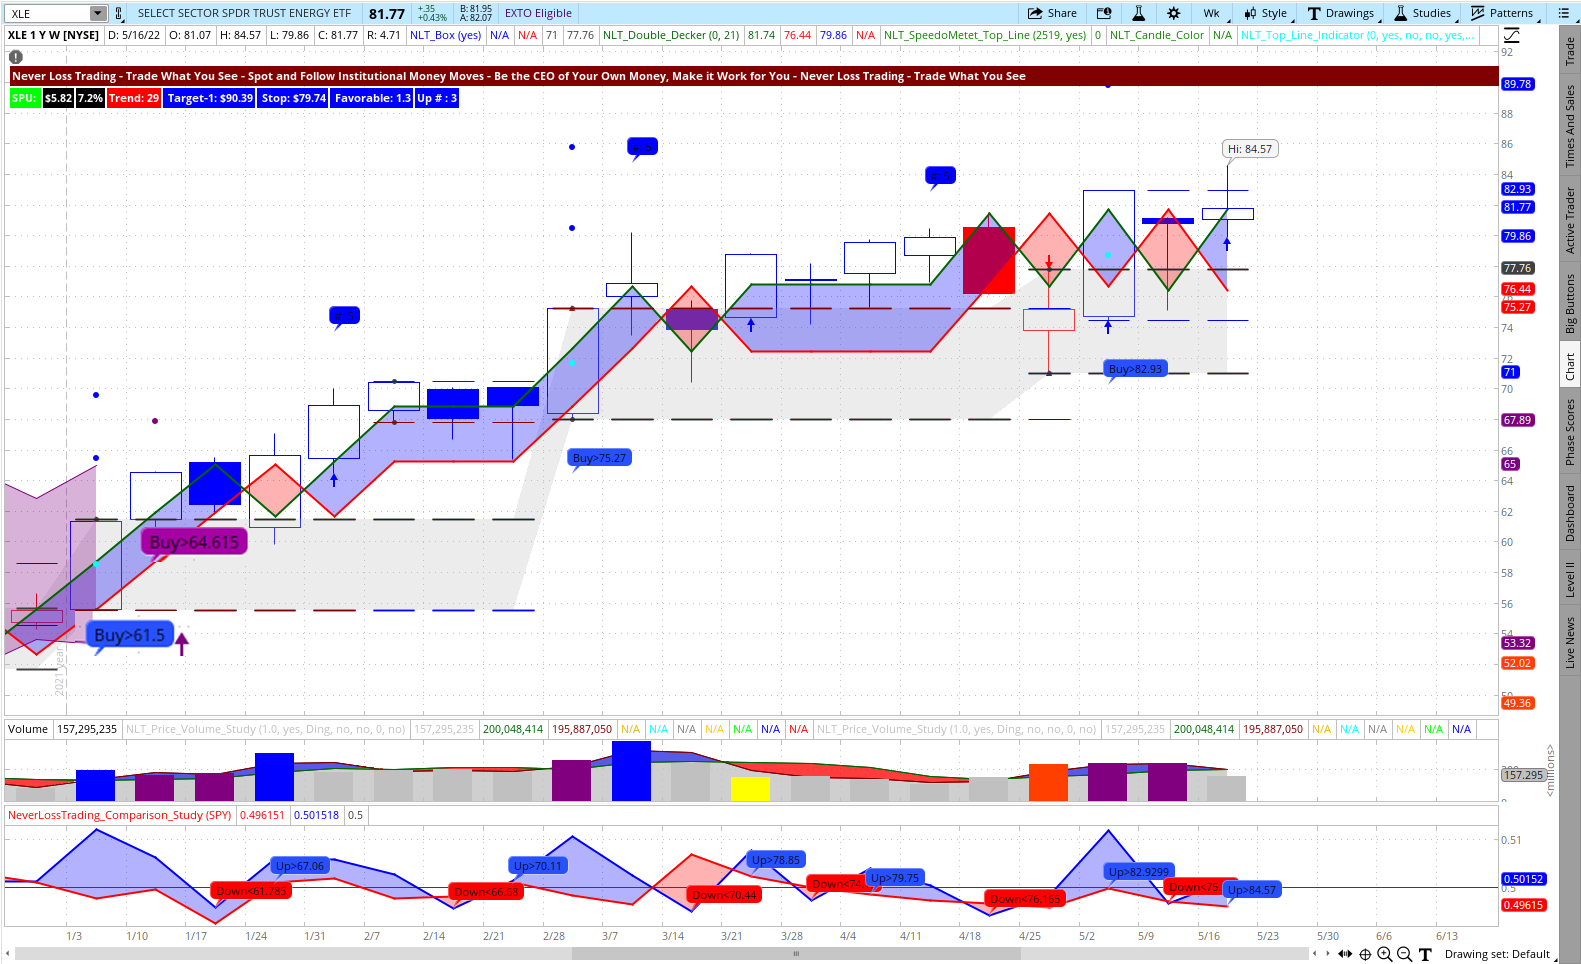
Beginning of the year 2022, the price development of XLE came out of the purple zone and had no sell signal on its way up. Therefore, we mark a critical price level: $77.76, where we would exit XLE long positions to find other investment opportunities.
Let us now check what the NLT Top-Line system said about the S&P 500 development in 2022 and explain it by highlighting three decisive price turning points the system mapped out, and we ask the following questions upfront:
- Are you operating and acting by system-defined crucial price turning points?
- Do you know short-selling strategies that help you to participate when markets tank in any of your accounts?
- Can you apply portfolio hedging when you continue to hold stocks in your investment accounts to protect you from another potential > 20% market drop?
- How do you select to be long or short to participate when prices move?
SPY on the Weekly NLT Top-Line Chart

Situation-1: Right after the first week of January 2022, a lower study sell signal pointed towards a weak opening of the market. The signal was confirmed in the price movement of the next candle and then followed up by a price chart sell signal: Sell < $437.95, which took five bars to come to target, where the trade was closed.
Situation-2: Buy > $444.86 was confirmed in the price movement of the next candle. The dashed lines on the chart indicated that the price movement to the target has to be cut short, and the price level of $459.50 was the exit point.
Situation-3: The lower study indicated a confirmed short-selling signal: Down < $443.47, which was later supported by the end of purple zone signal, Sell < $411.21 and closed the trade at target ($393.18).
The first examples were geared towards longer-term trading decisions, while we practice and propose to be rather a swing trader in the current environment, taking our signals from daily and four hour charts:
TSLA on the NLT 4-hour Top-Line Chart

The recorded time frame is May 4 to May 16, 2022, and we highlighted four trade situations and took directional price indications from the price chart and lower comparison study.
Situation-1: May 4 – 6, 2022, showed the NLT Purple Zone. We color up-trends in blue and downtrends in red; when no directional trend is present, we mix red and blue, and a purple zone appears on the chart. In times of ambiguity, we do not engage in trades, and the NLT Purple Zone helps the trader identify those situations. When a purple zone ends, we expect a directional price movement, and it happened.
Situation-2: Two of the NLT indicators agree on shorting TSLA if the price of Tesla in the next candle drops below $797.34. The Tesla share with most brokers is rated HTB (hard to borrow). Hence, we chose to trade options contracts to participate in the down movement of TSLA and applied the NLT Delta Force Concept, which specifies the strike price to choose, the time to expiration to pick and the maximum price to pay for the option. This is where most traders struggle, and we help with a clearly defined concept to determine the action to take. On the chart, you see the trade target market by two dots, and when the price move to the dot concluded, we close the positions. To reach the lower dot, marked as a target, we expected a maximum of 10 candles and got there after six.
Situation-3: A potential long signal: Buy > $787.35; however, the set price threshold was not achieved in the price movement of the next candle, and no transaction was initiated.
Situation-4: From the lower study, the Down < $ 758.19 signal was confirmed in the price movement of the next candle and led to a short trading strategy on TSLA that came to target the next day.
When technology is under pressure, QID, as a reverse ETF to the NASDAQ 100, offers excellent long trading opportunities:
QID on the NLT Daily Top-Line Chart
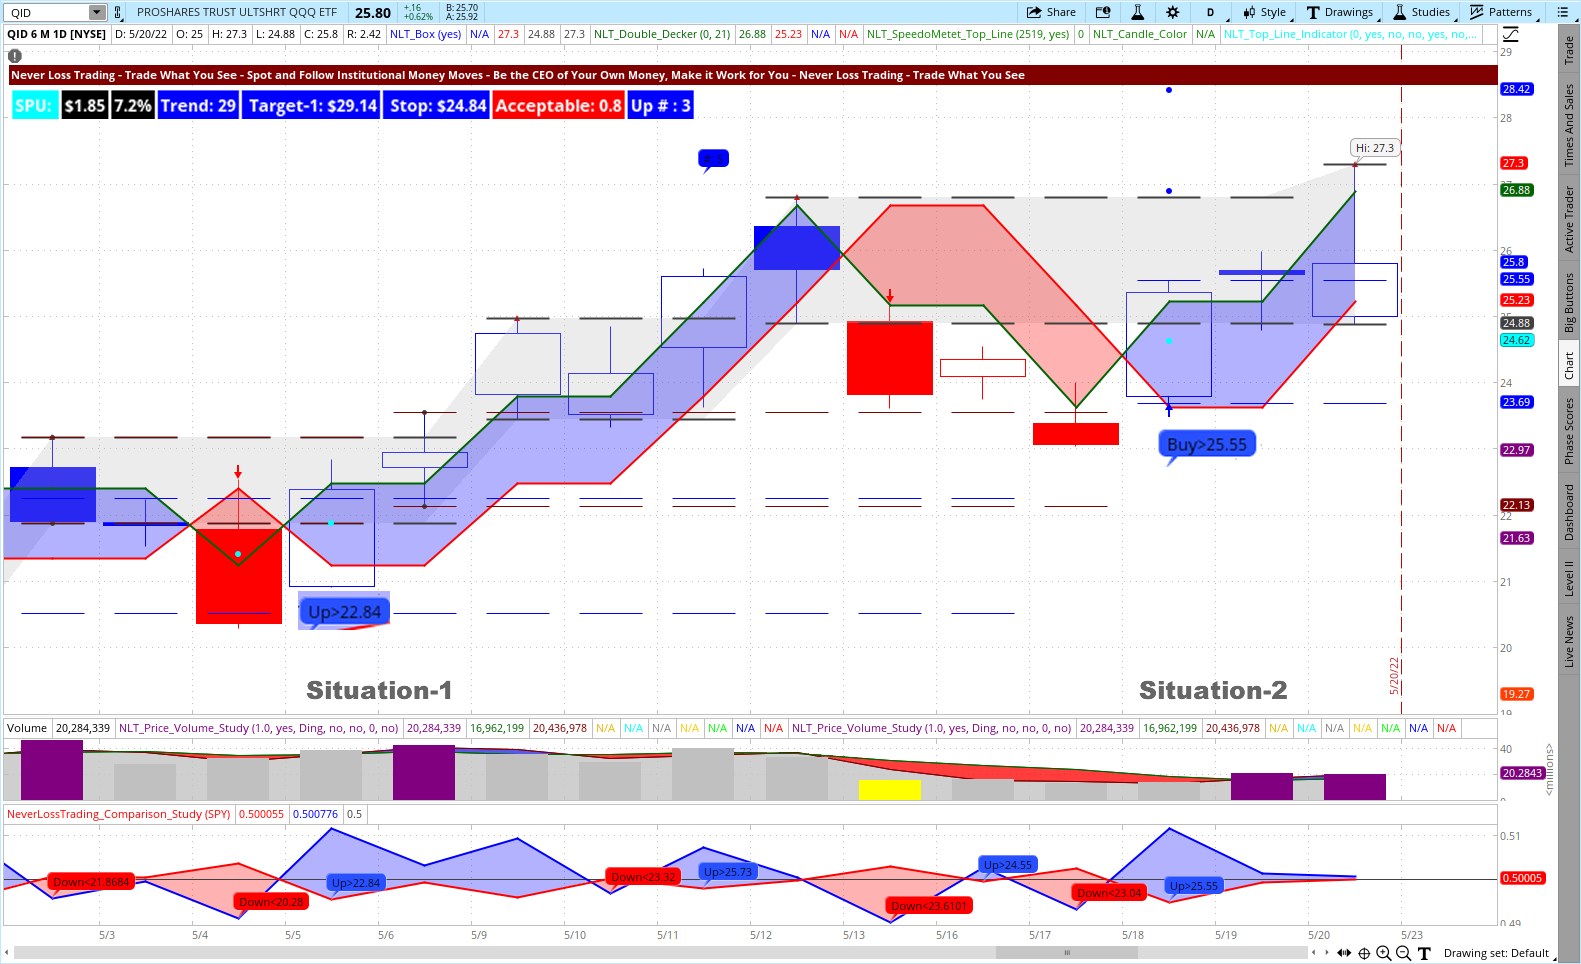
On the chart, we highlighted two trade situations:
Situation-1: Candles with a cyan dot, we call light towers, stand tall and point in a direction. In the highlighted situation, we have a change in command: buyers take over from sellers by showing two opposite-facing light towers in a row. Candle number five of the up-sequence is highlighted, and we like to take profit at the close of this candle, expecting other market participants to do the same. The trade was good for a 12% return on cash in four days.
Situation-2: An NLT Power Tower shows buy $25.55 and prints a target dot at $26.88, giving you a 5.2% return on cash in a matter of two days.
But which stock to trade and which strategy to apply, when and why?
With NLT Top-Line, you get market scanners and watch list indicators that help you find those opportunities we shared to act at crucial price turning points. We also do the work for you and provide those opportunities into your inbox through the NLT Alerts.
Trading is about gauging the probability of a price move with specifically defined:
- Entry Decisions: going long or short when a system declared price threshold is surpassed
- Exit Decisions: at entry, specify the exit, assuming that other market participants will start selling or covering their positions at such point.
- Stop: Give the price development enough wiggle room to reach the target.
- Risk/Reward: Based on your system probability, allow, for example, a maximum risk of 1.2-times the reward when you operate at a 65% probability of predicting the price move right.
The most critical decision is that you risk limiting your trade by either trading stocks combined with options or solid stock options by themselves. We are indeed teaching you chart setups to choose. However, you are dealing with a probability that is not 100%; hence, you will have losing trades; however, if you can limit your losers and harvest on winners, you are trading with an edge.
Instead of using the stop, concepts of trade repair gave us our brand name, but never stop loss trading was a bit lengthy.
Unfortunately, many retail traders do not limit their risk aside from applying a stop and on gaps and suffer through solid drawdowns.
When you are ready for a change and participate with our system in trading along with significant price moves,
contact@NeverLossTrading.com Subj: Demo.
NeverLossTrading is a concept that custom adapts to traders’ affinity, wants, and needs. We focus on acting at crucial price turning points and take our price move indications from several sources or market cuts. We have signals that check for price correlations, others for volatility or volume change. Combining NLT Systems gives traders a higher participation rate: more trades to participate per day, week, or month, where each system works as a standalone.
No trader is the same as another. We offer excellent customer service and adopt our systems to individual wants and needs, teaching and coaching at your best available days and times. We put together an overview of learning elements to take away from our training and coaching sessions:
Summary of learning elements:
- Acting with a system probability > 65%
- Mechanical rules for entry, exit, stop
- Trade at perfect moments only
- Consider overall factors, patterns
- Risk and reward in an acceptable balance
- Risk-averse trading
- Holding positions to target
- Do not add to losers
- Stick with a trading strategy. Follow a business plan – action plan and financial plan
- Trade for meaningful price moves
- Systematic trading
- Having a mentor to learn from
Learning Elements to Trading Success

We also help you to journal your trades. Such a journal provides excellent feedback on how you are developing, and you find a perfect example in this article on our Blog: How to Control Your Trading Results
It is not the time for buy and hold; hence, if you do not change your trading strategy, your accounts will suffer substancial losses. The biggest professional fund investor is BlackRock, inc. After the financial crisis in 2008/2009 many institutional investors decided to let BlackRock (BLK) do the investment for them. When they would be successful in putting buy and hold portfolios together the share would be up, bu it is not: it pefroms below the S&P 500.
BLK and S&P 500 Three Months Development
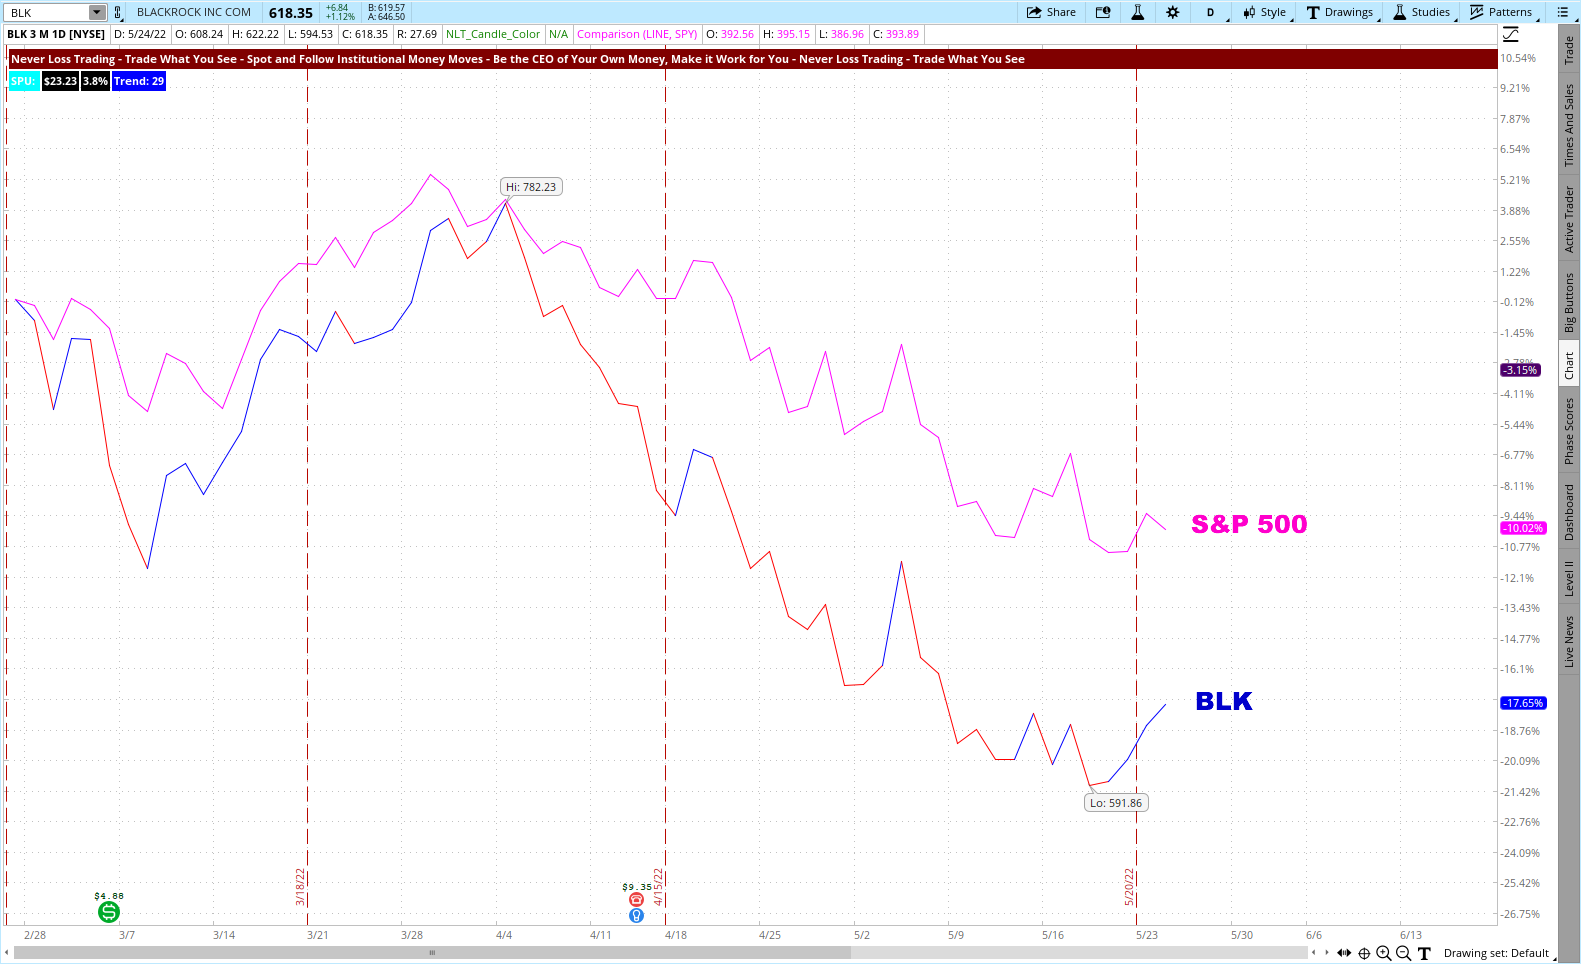
If professional investors cannot make money in the current market with buy and hold, why should you?
Hence, get ready to make a change to your decision making or system and investment strategies.
To succeed in trading, you must work with an experienced coach and learn as much about trading. Our #1 competitive advantage is the support and customer service we offer. We work one-on-one with you to specify what we teach to your specific wants and needs; hence, if your knowledge base is not expanding rapidly, you are doing something wrong.
Ongoing education and mentoring are crucial to longevity in this business.
Veteran traders have been through more ups and downs than you can imagine. So whatever you’re going through, experienced pros have probably experienced it already.
If you are ready to learn, meet us in a one-on-one session where we find out which learning program suits you best:
contact@NeverLossTrading.com Subj: Demo.
We are ready to share our experiences and help you build up your trading business. Trading is not a typical career, and you best learn from those who are long-term in this business to cope with the rollercoaster of the financial markets. We are here to help and provide feedback on what you might be doing right or wrong.
Make a change to your trading results, and we will find out which of our systems suits you best.
We are happy to hear back from you,
Thomas Barmann (inventor and founder of NeverLossTrading)
Disclaimer, Terms and Conditions, Privacy | Customer Support


