
Summary: When price change goes viral, it offers chances and risks—experience how to act with the odds in your favor.
Volatility measures the rate or frequency of price changes over a given period of time. The NeverLossTrading Top-Line examples shared are for people who hold accounts above $50,000 and care about their money or retirement.
The volatility rate or rate of price change varies asset by asset. It shows the range to which the price of a security may increase or decrease. Since the beginning of the year, the financial markets have shown increased volatility, while in 2021, the stock market showed relatively low volatility. As traders, we are confronted with multiple volatility measures:
- Statistical volatility (explained above)
- Implied volatility is used in the options pricing model to gauge the expected fluctuations in the returns of the underlying assets: high volatility, options prices increase and decrease at times of low volatility.

In essence, if a security price fluctuates rapidly in a short period, it is termed to have high volatility. Conversely, if the security prices fluctuate slowly over a longer time, it is termed to have low volatility.
As a trader, you can choose to engage in assets of higher or lower volatility; both have advantages and disadvantages that depend on your trading style and strategy.
We take multiple volatility-related stats to determine the speed of price changes and the influence on the value of related assets and summarize some in a video:
The current market situation shows increased volatility levels that express a higher risk for long-term portfolio holders: We teach how to hedge your holdings in our mentorships. On the other hand, volatility swings offer great short-term trading opportunities if you are ready to identify crucial price turning points for solid returns.
At NeverLossTrading, we developed the SPU (Speed Unit) as a measure of volatility for each asset, and we express the volatility measure as a possible rate of price change based on the following price move model:
NeverLossTrading Price Move Model

Theory: Key asset holders will have a solid need to re-balance their inventories. Thus, at a particular price expansion (measured by our SPU), they will either float- or shorten supply, which will result in an opposite directional price move that will then take away from our profits. Knowing this, we pre-calculate how far the expected price move will reach, and there we take profit, assuming it will retrace or reverse after.
Hence, we let the market and institutions appraise the asset price journey and latch on, entering and exiting positions faster than institutions can.
Our brand name derives from the concept of repairing a trade instead of accepting a stop loss; however, Never Stop Loss Trading was a bit lengthy.
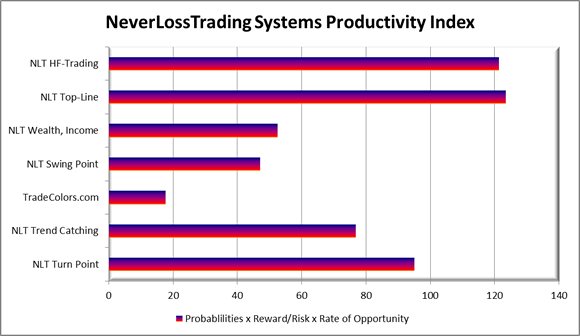
TradeColors.com is our introductory system to high probability trading. We always allow for upgrades; you only pay the difference if you start with TradeColors.com and upgrade after.
Many of our clients purchase more than one system: Our systems are productivity tools, and by combining them, you produce a higher participation rate and higher returns.
Our tool to calculate the expected price move is the SPU = Speed Unit, and it indicates how far a price move shall reach until it comes to an end.
With our systems, you can operate with conditional buy-stop and sell-stop OCO orders (one-cancels-the-other). Without the need to be in front of your computer for the orders to execute. You enter by price thresholds, ensuring that other market participants have the same directional assumption as you do and exit at the SPU target or adjust the trade at the stop.

By a change in the frequency and amplitude of the price movement over time, we specify indications to act on high probability price turning points, applying mechanical rules rather than leaving room for interpretation.
With the help of the NeverLossTrading indicators, we report changes in supply and demand and multiple levels, time-based and based on pre-defined price moves and report the happenings:
- On a monthly level
- Weekly level
- Daily
- 4-Hour based,
We share the price thresholds: buy > or sell < through our alerts, or you can find them on your own with the help of system-related market scanners or watch list indicators.
We cover all asset classes: Stocks, Options, Futures, and FOREX.
As a retail trader, you have multiple opportunities for:
- Day trading (opening and closing positions on the same day)
- Swing trading (holding position for multiple days)
- Longer-term investing (holding positions for weeks and months)
Based on clearly defined risk-limiting strategies, you can act with a high probability price move model on key price turning points.
With the help of our systems, we help retail traders to decide at trade entry for the five significant challenges they face to prevent the common mistakes often made:
- Trade entry decisions (when to trade)
- Exit decisions (where to take profit)
- Stops (where to place them)
- Maximum time in a trade (specified by the signal)
- Risk to reward (only act at favorable setups)

Let us do short volatility or SPU measure comparison:
The actual daily SPU of Tesla (TSLA) on May 16, 2022, was $65.72, telling a trader that the share has an expected value change of 9.1% per day. On the other hand, the daily SPU for SPY (ETF of the S&P 500 Stock Market Index) was at $12.01 or 3.1%; hence, TSLA produces three times the opportunity for a trader to create income than the Index and entails three times the risk when your trade goes wrong. Twelve months ago, on the same day, SPY had an NLT-SPU of $5.34 or 1.3%, and TSLA showed an NLT-SPU of $32.90, or 5.9% and 4.5-times the volatility compared to the Index.
Our systems always tune you to the right SPU, specifying the trade exit and stop. However, suppose you trade for an inadequate price expansion or an ineffective stop. In that case, it is like trying to receive an FM signal on your radio on the wrong frequency, and the results will either be distorted or fail by not having a connection to the underlying price movement.
When you failed in the past by the trade turning on you before it came to target, you now have a hint of using the wrong expected price move by not operating with the SPU.
The following chart explains:
TSLA on the NLT 4-hour Top-Line Chart
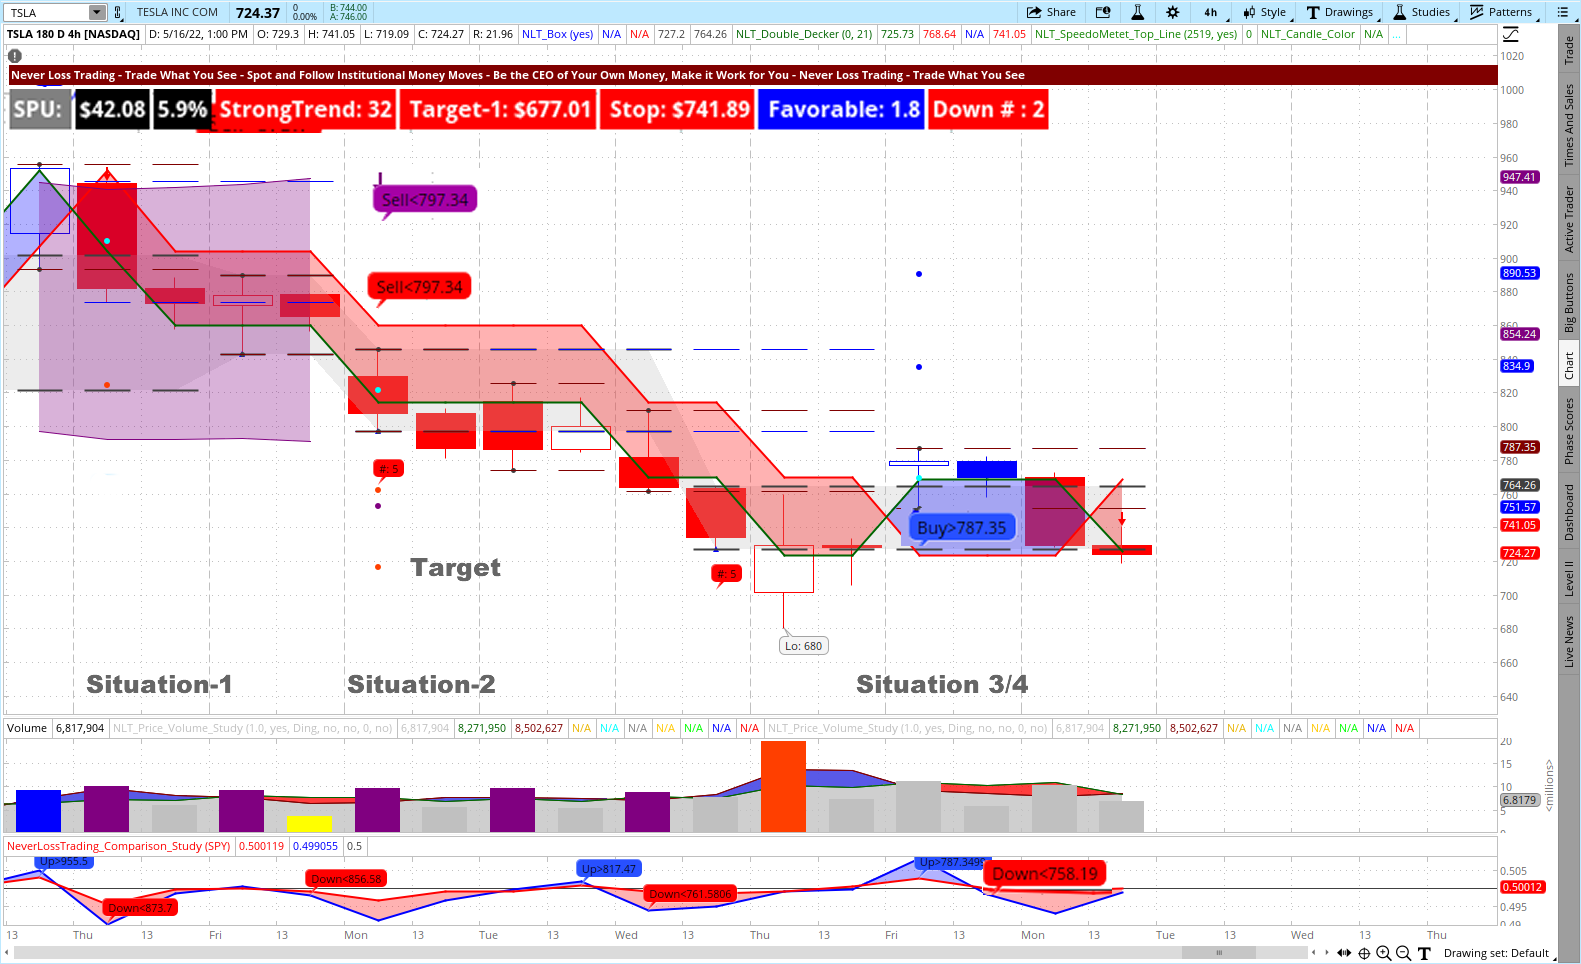
The recorded time frame is May 4 to May 16, 2022, and we highlighted four trade situations and took directional price indications from the price chart and lower comparison study.
Situation-1: May 4 – 6, 2022, showed the NLT Purple Zone. We color up-trends in blue and downtrends in red; when no directional trend is present, we mix red and blue, and a purple zone appears on the chart. In times of ambiguity, we do not engage in trades, and the NLT Purple Zone helps the trader identify those situations. When a purple zone ends, we expect a directional price movement, and it happened.
Situation-2: Two of the NLT indicators agree on shorting TSLA if the price of Tesla in the next candle drops below $797.34. The Tesla share with most brokers is rated HTB (hard to borrow). Hence, we chose to trade options contracts to participate in the down movement of TSLA and applied the NLT Delta Force Concept, which specifies the strike price to choose, the time to expiration to pick and the maximum price to pay for the option. This is where most traders struggle, and we help with a clearly defined concept to determine the action to take. On the chart, you see the trade target market by two dots, and when the price move to the dot concluded, we close the positions. To reach the lower dot, marked as target, we expected a maxium of 10 candles and got there after six.
Situation-3: A potential long signal: Buy > $787.35; however, the set price threshold was not achieved in the price movement of the next candle, and no transaction was initiated.
Situation-4: From the lower study, the Down < $ 758.19 signal was confirmed in the price movement of the next candle and led to a short trading strategy on TSLA that came to target the next day.
Let us take a longer-term perspective, which you should consider, in particular, if you hold a portfolio of stocks in your retirement accounts (401(k), IRA). In such cases, we chose a weekly chart for decision-making and select again the SPY (
ETF of the S&P 500 Stock Market Index) as the core measure of the stock market. You will see three highlighted trade situations and their decisions from left to right.
SPY on the Weekly NLT Top-Line Chart
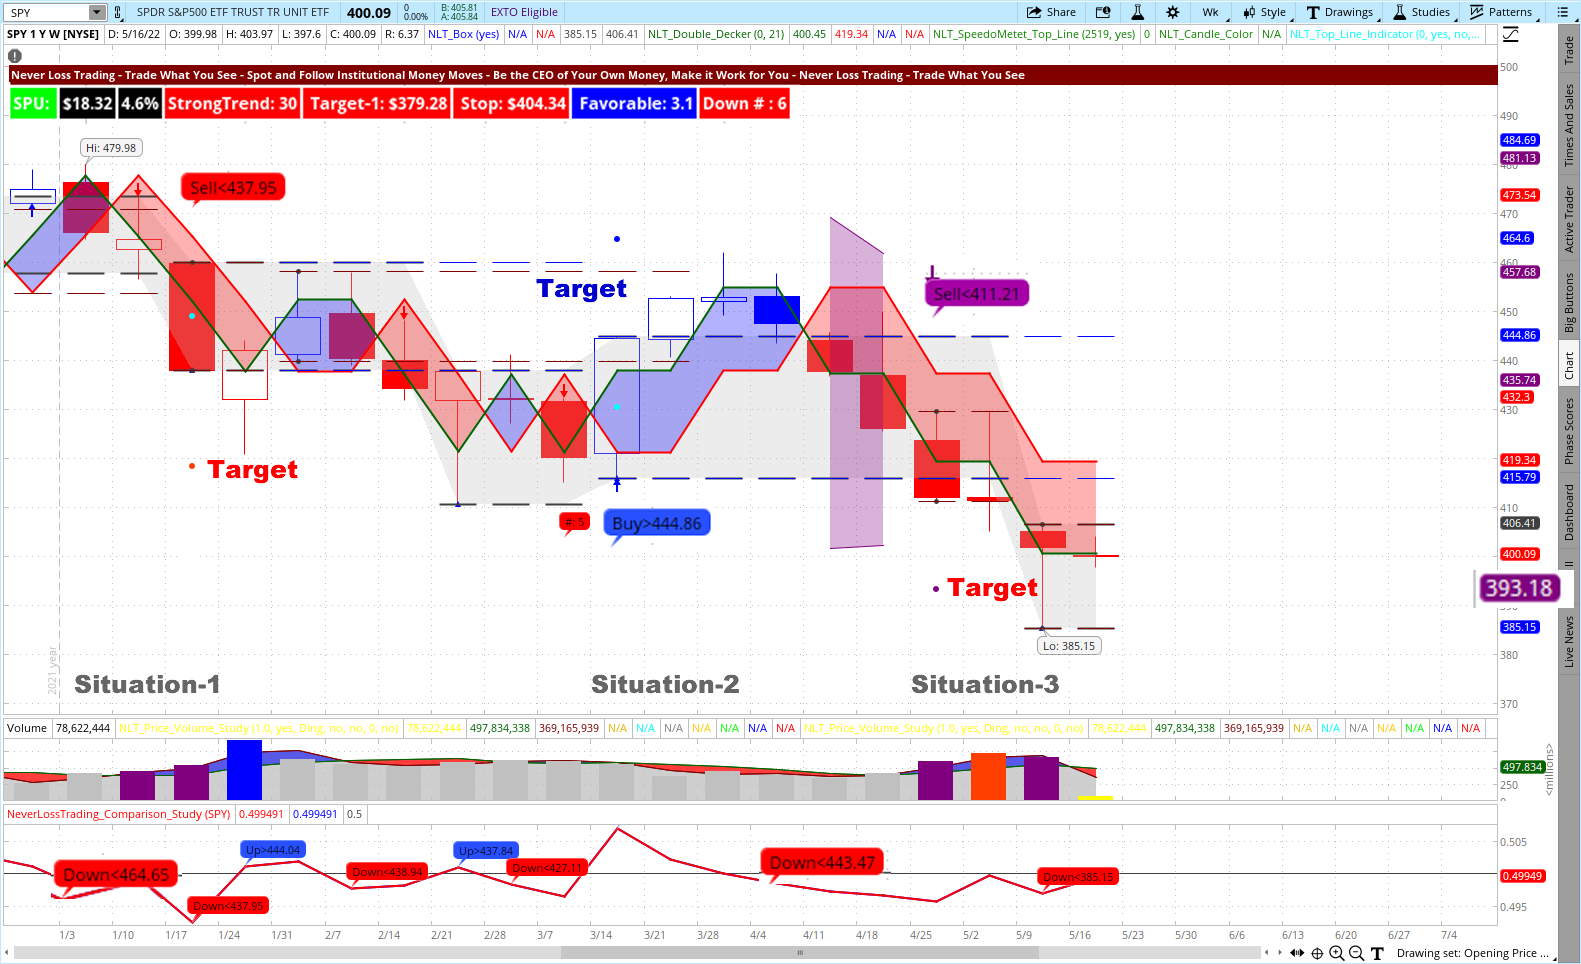
Situation-1: Right after the first week of January 2022, a lower study sell signal pointed towards a weak opening of the market. The signal was confirmed in the price movement of the next candle and then followed up by a price chart sell signal: Sell < $437.95, which took five bars to come to target, where the trade was closed.
Situation-2: Buy > $444.86 was confirmed in the price movement of the next candle. The dashed lines on the chart indicated that the price movement to the target has to be cut short, and the price level of $459.50 was the exit point.
Situation-3: The lower study indicated a confirmed short-selling signal: Down < $443.47, which was later supported by the end of purple zone signal, Sell < $411.21 and closed the trade at target ($393.18).
These two examples explain how vital a clear-cut volatility-based price move strategy is to follow the swings of the markets at crucial price turning points.
How did you judge the situations on your own, and do you have adequate strategies on hand to trade along with developing price moves?
We are entering a bear market, where buy and hold is not a sound survival strategy. If you want to make judgments from charts as we did here, contact us for a demo:
contact@NeverLossTrading.com Subj: Demo.
NeverLossTrading is a concept that customers adapt to traders’ affinity, wants, and needs. We focus on acting at crucial price turning points and take our price move indications from several sources or market cuts. We have signals that check for price correlations, others for volatility or volume change. Combining NLT Systems gives traders a higher participation rate: more trades to participate per day, week, or month, where each system works as a standalone.
No trader is the same as another. We offer excellent customer service and adopt our systems to individual wants and needs, teaching and coaching at your best available days and times. We put together an overview of learning elements to take away from our training and coaching sessions:
Summary of learning elements:
- Acting with a system probability > 65%
- Mechanical rules for entry, exit, stop
- Trade at perfect moments only
- Consider overall factors, patterns
- Risk and reward in an acceptable balance
- Risk-averse trading
- Holding positions to target
- Do not add to losers
- Stick with a trading strategy. Follow a business plan – action plan and financial plan
- Trade for meaningful price moves
- Systematic trading
- Having a mentor to learn from
Learning Elements to Trading Success

We also help you to journal your trades. Such a journal provides excellent feedback on how you are developing, and you find a perfect example in this article on our Blog: How to Control Your Trading Results
To succeed in trading, you must work with an experienced coach and learn as much about trading. Our #1 competitive advantage is the support and customer service we offer. We work one-on-one with you to specify what we teach to your specific wants and needs; hence, if your knowledge base is not expanding rapidly, you are doing something wrong.
Ongoing education and mentoring are crucial to longevity in this business.
Veteran traders have been through more ups and downs than you can imagine. So whatever you’re going through, experienced pros have probably experienced it already.
If you are ready to learn, meet us in a one-on-one session where we find out which learning program suits you best:
contact@NeverLossTrading.com Subj: Demo.
We are ready to share our experiences and help you build up your trading business. Trading is not a typical career, and you best learn from those who are long-term in this business to cope with the rollercoaster of the financial markets. We are here to help and provide feedback on what you might be doing right or wrong.
Make a change to your trading results, and we will find out which of our systems suits you best.
We are happy to hear back from you,
Thomas Barmann (inventor and founder of NeverLossTrading)
Disclaimer, Terms and Conditions, Privacy | Customer Support

No comments:
Post a Comment